
Abstract
Background
The mechanism of Venous thromboembolism (VTE) is complicated and difficult to prevent due to factors such as bone marrow invasion, therapy, and immune-mediated effects. This study aims to establish a nomogram model for predicting the risk of thrombosis in lymphoma patients undergoing chemotherapy, which has been increasing over the past 30 years.
Methods
The data of lymphoma patients from the Affiliated Cancer Hospital of Chongqing University in China between 2018 and 2020 were analyzed. This included age, sex, body mass index, ECOG score, histological type, Ann Arbour Stage, white blood cells count, haemoglobin level, platelet count, D-dimer level, and chemotherapy cycle. Univariate and multivariate cox analysis was used to determine the risk factors for VTE. Characteristic variables were selected to construct a nomogram model which was then evaluated using ROC curve and calibration.
Results
Age, sex, PLT, D-dimer and chemotherapy cycle were considered as independent influencing factors of VTE. The mean (standard deviation) of the C index, AUC and Royston D statistics of 1000 cross-validations of the Nomogram model were 0.78 (0.01), 0.81 (0.01) and 1.61(0.07), respectively. It indicates a good calibration degree and applicability value as shown by the calibration curve. The DCA curve showed a rough threshold range of 0.05–0.60 with a good model.
Conclusions
We have established and validated a nomogram model for predicting the risk of thrombosis in lymphoma patients. This model can assess the risk of thrombosis in each individual patient, enabling the identification of high-risk groups and targeted preventive treatment.
Introduction
Venous thromboembolism (VTE) refers to the abnormal formation of blood clots within the venous system, which can lead to the obstruction of blood vessels, including deep vein thrombosis (DVT) and its complications, as well as pulmonary embolism (PE). Malignant tumours pose a significant risk factor for VTE, with tumour patients exhibiting a 4–7 times higher risk compared to non-tumour patients [Citation1]. Furthermore, the 6-month mortality risk for tumour patients with VTE increases approximately threefold, ranging from 29% to 94% [Citation2]. Lymphoma, as a malignant tumour of the haematological system, often occurs with VTE and is at increased risk in patients receiving chemotherapy [Citation3,Citation4]. Being the second leading cause of death in cancer patients, VTE significantly impacts the quality of life and prognosis of affected individuals. Currently, VTE risk assessment primarily utilizes the Caprini [Citation5] and Khorana [Citation6] assessment scales. While the Caprini scale is more suitable for surgical patients, the Khorana scale is designed for medical and outpatient settings. However, due to the complex nature of lymphoma, which encompasses various pathological subtypes, diverse tumour loads, affected sites, and treatment plans, the evaluation capacity of the aforementioned scales is limited. To address this limitation, we propose the use of a nomogram model specifically tailored to predict the high-risk group for VTE in lymphoma patients, with the aim of improving VTE diagnosis rates.
The nomogram model, based on multi-factor regression analysis, incorporates multiple predictive indicators and represents their relationships by scaled line segments on a single plane. This visual risk assessment approach has been extensively studied in various solid tumours [Citation7–10]. However, limited data exist on the risk of VTE in the lymphoma population. In a study by Yang et al. [Citation11], the nomogram model demonstrated a high level of concordance between predicted and actual VTE probabilities in lymphoma patients, outperforming the Khorana model. Building upon our previous research foundation [Citation12,Citation13], we have expanded the sample size and included multiple research factors in our study. The developed nomogram model enables the prediction of VTE risk in lymphoma patients based on factors such as age, gender, body mass index(BMI), ECOG score, pathological type, Ann Arbour stage, blood routine, coagulation pattern, and chemotherapy cycle. This predictive tool offers a robust screening approach for thrombosis prevention and treatment.
Materials and methods
Study design and population
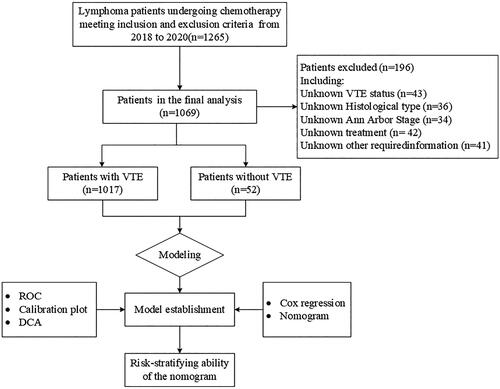
This study aimed to investigate the risk of VTE in lymphoma patients undergoing chemotherapy at the Affiliated Cancer Hospital of Chongqing University from January 2018 to December 2020 (). All patients included in the study were diagnosed with lymphoma based on histopathological examinations following the WHO classification criteria. Exclusion criteria encompassed adolescent patients (<18 years of age), individuals with pre-existing VTE, patients with concomitant infections or complex pathological types, and those with incomplete medical records (Refers to a very small number of patients who enter and leave the hospital 24 h without undergoing relevant examinations and treatment.). Each patient completed informed consent forms upon their participation in the study. The study was conducted in compliance with the guidelines outlined in the Declaration of Helsinki and received ethical approval from the Ethics Committee of Chongqing University Cancer Hospital.
Figure 1. Flowchart detailing the inclusion and exclusion criteria that resulted in the final study cohorts.
Data collection and definition
All data were collected from the Affiliated Cancer Hospital of Chongqing University in China. A total of 12 variables, including age, sex, Body Mass Index (BMI), ECOG score, histological type, Ann Arbour stage, white blood cell count (WBC), haemoglobin level (HB), platelet count (PLT), D-dimer level (D-dimer), and chemotherapy cycle, were recorded for each patient. In the article’s modelling, the data for patients who did not experience VTE were extracted from the results obtained before their first chemotherapy session. For patients who experienced VTE, their blood parameter data was collected at the time of the VTE diagnosis.
Statistical analysis and nomogram model establishment
If the measurement data followed a normal distribution, they were described using mean ± standard deviation, and t-tests were used for comparisons. For non-normally distributed data, median (M) and interquartile range (IQR) were used for description, and non-parametric tests were employed for comparisons. Count data were presented as frequencies and percentages and compared using chi-square tests. To develop an effective clinical prediction model with an optimal balance between model performance and clinical applicability, feature selection was performed on the data. Initially, univariate Cox regression analysis was conducted on the selected variables to explore their associations with VTE. Subsequently, variables with a significance level of p < 0.2 in the univariate analysis and those deemed clinically significant were included in the multivariate analysis, identifying them as independent predictors of VTE. We conducted a proportional hazards assumption test for the Cox regression model, and the results of the test indicate that the model adheres to the proportional hazards assumption. The discriminative ability of the nomogram model was assessed using receiver operating characteristic (ROC) curves. Calibration curves were generated using bootstrapping with 1000 samples, and the decision curve analysis (DCA) was conducted. Additionally, we conducted 100 10-fold cross-validations and computed the average C-index, average AUC and average Royston D statistics to evaluate the Nomogram model. Furthermore, patients were stratified into risk groups, and the prediction effect of the model was further validated using Kaplan-Meier survival curves. All statistical analyses were performed using R version 4.1.2 (http://www.r-project.org), and statistical significance was defined as a two-tailed p-value of <0.05.
Results
Clinical characteristics of patients
A total of 1069 patients were enrolled in the study from January 2018 to December 2020. Among them, 635 patients were female, accounting for 59.4% of the total cohort. The average age of the patients was 55.61 ± 14.44 years. The distribution of lymphoma subtypes included 106 cases (9.92%) of Hodgkin lymphoma, 788 cases (73.71%) of B-cell lymphoma, 87 cases (8.14%) of T-cell lymphoma, and 88 cases (8.23%) of NK/T-cell lymphoma. The majority of patients exhibited good Eastern Cooperative Oncology Group (ECOG) performance status (≤ECOG grade 1: 83.72%), while approximately 64.36% of patients had Ann Arbour Stage III/IV. The majority of patients (93.17%) underwent 1-5 cycles of chemotherapy. During a median follow-up period of 23.1 months, 52 patients (4.92%) were diagnosed with VTE, all of whom had lymphoma. Among VTE patients, 13.46% had Hodgkin lymphoma and 86.54% had non-Hodgkin lymphoma. The statistical results indicate that among the 52 VTE patients, the median time to VTE occurrence was 3.45 months. All VTE episodes occurred following the initiation of chemotherapy. Baseline comparisons between the two groups revealed statistically significant differences in age, ECOG performance status, HB, D-dimer levels, and chemotherapy cycle (p < 0.05) ().
Table 1. Clinical characteristics of lymphoma patients with or without VTE.
Analysis of influencing factors
Univariate analysis revealed that Age, Sex, ECOG, HB, PLT, D-dimer, and Chemotherapy cycle were significant factors influencing VTE. Specifically, Male (HR = 0.53(0.28–0.97), p = 0.040) and ECOG 1 score (HR = 0.53(0.28–0.99), p = 0.045) were associated with a lower risk of VTE. On the other hand, Age (HR = 1.03(1.01–1.05), p = 0.007), ECOG 2 score (HR = 1.18(0.59–2.36), p = 0.639), HB (HR = 0.98(0.97–0.99, p < 0.001), D-dimer (HR = 1.21 (1.13–1.29, p < 0.001), Chemotherapy cycle 6-10 (HR = 2.88(1.29-6.44), p = 0.010), and Chemotherapy cycle ≥11 (HR = 3.09(0.95–10.00), p = 0.060) were associated with a higher risk of VTE. Multivariate analysis identified Age, Sex, HB, D-dimer, and Chemotherapy cycle as significant influencing factors for VTE. Male (HR = 0.51(0.28–0.94), p = 0.032) and increasing Age (HR = 1.02(1.00–1.04), p = 0.019) were associated with a lower risk of VTE. HB (HR = 0.98 (0.97–0.99, p = 0.019), D-dimer (HR = 1.19 (1.10–1.29, p < 0.001), and Chemotherapy cycle 6–10 (HR = 3.70(1.65–8.31), p = 0.002) were associated with a higher risk of VTE. The impact of Chemotherapy cycle ≥11 (HR = 2.65(0.80–8.80), p = 0.112) on VTE risk did not reach statistical significance. Notably, among these factors, D-dimer exhibited the greatest risk for VTE, with patients having D-dimer >0.5 showing a 3.1 times higher risk compared to those with D-dimer ≤0.5 ().
Table 2. Univariate and multivariate analysis of the risk factors for VTE.
Construction of nomogram
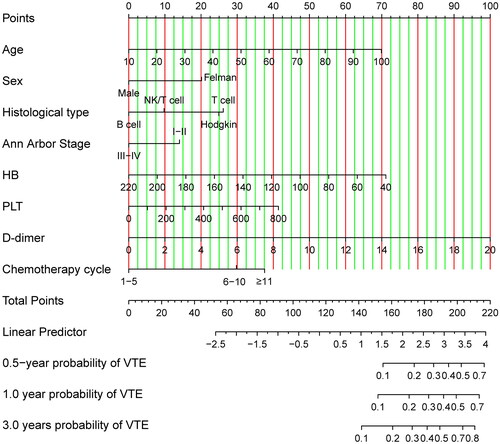
The nomogram model was developed. The univariate Cox regression analysis was performed to verify the risk factors for VTE. And entered the variables with p-value < 0.2 into the multivariate Cox regression model to analyze the association between each variable and VTE to find independent risk factors. The nomogram was created based on the risk score calculated by the final Cox regression model that was constructed by a stepwise process. Notwithstanding the absence of statistical significance for the variables PLT and Ann Arbour Stage in both univariate and multivariate analyses, we have opted to incorporate them into the final construction of the nomogram model, given their clinical significance. Utilizing the results of multivariate COX regression, we developed nomogram models for lymphoma patients at 0.5-year, 1-year, and 3-year intervals (see ). The nomogram allows for the calculation of the total points assigned to each patient based on the assigned points for each risk variable. The total points projected on the bottom scales indicate the probability of 0.5-, 1- and 3-year VTE. A higher total score indicates a lower risk of VTE. The basic survival probability of the Nomogram we constructed is 0.97.
Figure 2. Nomogram model predicting 0.5-, 1- and 3-year VTE in lymphoma patients.
Model performance and validation of the nomogram
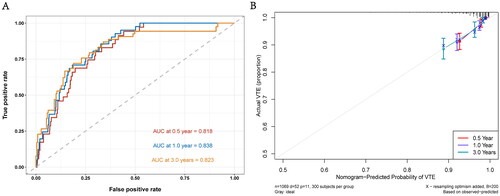
illustrates the ROC curves of the Nomogram model for 0.5-, 1-, and 3-years. The AUC values for all the curves in the graph exceeded 0.79, indicating the outstanding generalization ability of the Nomogram model. displays the calibration curve for all the data. The distribution of points on both sides of the diagonal line is even, indicating that the Nomogram model exhibits excellent prediction accuracy. Additionally, the C-index(se) for the data was calculated as 0.78(0.03), further confirming the high accuracy of the model. Furthermore, we conducted 100 iterations of ten-fold cross-validation to calculate the average C-index, AUC, and Royston D statistics of the model, ensuring its stability. The average C-index(se) for the model was 0.78(0.01), the average AUC(se) was 0.81(0.01), and the average Royston D statistics was 1.61(0.07). These results validate the robustness of the model.
Figure 3. (A:0.5-, 1- And 3-year ROC curves for nomogram model, B:0.5-, 1- and 3-year calibration curves of nomogram model.).
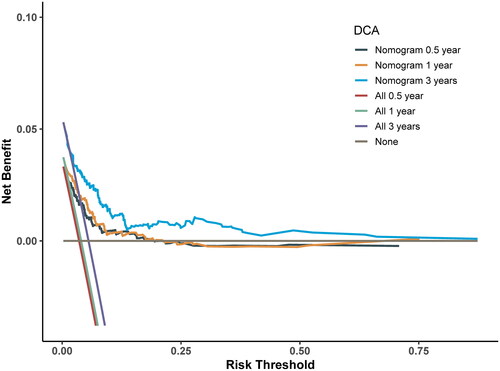
emphasizes the high clinical significance of the Nomogram model in practical applications. To assess the clinical utility of the model, we constructed a DCA curve, as shown in . The x-axis of the DCA curve represents the Threshold Probability, which is the point at which the risk of VTE occurrence for patients (Pi) reaches a certain value. The y-axis represents the Net Benefit (NB), which is the difference between benefits and harms. From the graph, it is evident that when the threshold probability for VTE occurrence falls within the range of 0.05 to 0.60, the average net benefits of different timeframes exceed those of considering all patients as either having or not having VTE. This implies that within this range, the model’s predictions hold practical value for clinical decision-making, helping physicians better differentiate which patients should undergo treatment or other interventions to achieve higher net benefits.
Figure 4. 0.5-, 1- And 3-year DCA curves for nomogram models.
Risk-stratifying ability of the nomogram
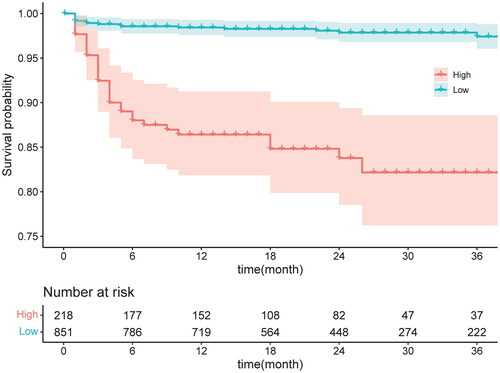
To further assess the model’s applicability, the data were divided into high-risk and low-risk groups based on the model’s prediction results. Kaplan-Meier curve analysis was conducted, revealing a statistically significant difference between the two groups (p < 0.001). ().
Figure 5. K-M curves of different risk levels to estimate the VTE of patients in two groups.
Discussion
Lymphoma is a common malignant tumour of the blood system, and it differs from other solid tumours due to its propensity for bone marrow invasion and coagulation system abnormalities. These factors contribute to an increased risk of thromboembolism and other complications, leading to higher mortality rates among lymphoma patients [Citation14]. Furthermore, the complexity of thrombosis in lymphoma patients, including factors such as thrombocytopenia, glucocorticoid use in chemotherapy regimens, and haematopoietic stem cell transplantation, makes its mechanism and prevention and treatment more challenging to understand. While there are existing models like Caprini RAM and Padua to assess the risk of VTE [Citation15], there remains a lack of accurate prediction models specifically tailored to lymphoma patients, which limits their representation and effectiveness. Therefore, this study aimed to address this gap by establishing a nomogram model that predicts the risk of VTE in lymphoma patients using a larger sample size and multiple factors. The model aims to identify the risk factors associated with VTE, providing valuable insights for thrombosis prevention and treatment in lymphoma patients.
The nomogram model is a reliable method for predicting the probability of individual outcome events. It simplifies complex regression equations into visually intuitive graphs [Citation16], enhancing the model’s interpretability and meeting the clinical demand for integrated models. Notably, the nomogram model has demonstrated superior accuracy and prognostic value compared to other prediction models [Citation17,Citation18]. Therefore, its use has gained popularity in recent years. In this study, we developed a nomogram prediction model for assessing VTE risk in lymphoma patients, incorporating variables such as age, sex, BMI, ECOG score, pathological type, Ann Arbour stage, blood routine, D-dimer, and chemotherapy cycle. The model’s predictive ability has been internally validated and proven to be accurate.
Previous studies have incorporated nomogram models to accurately predict the risk of VTE in lymphoma patients by considering factors such as clinical stage, pathological type, and pre-chemotherapy haemoglobin levels [Citation11]. However, our study expands on this by including additional factors such as age, gender, BMI, ECOG score, pathological type, Ann Arbour stage, blood routine, D-dimer, and chemotherapy cycle of lymphoma patients. Moreover, our study encompasses a larger patient population and a more comprehensive set of variables compared to previous models. Therefore, our risk prediction model for VTE in lymphoma patients may offer valuable insights and guidance in clinical practice.
A meta-analysis [Citation19] revealed a higher incidence of VTE in patients with non-Hodgkin lymphoma compared to Hodgkin lymphoma. The incidence of VTE in non-Hodgkin lymphoma was found to be associated with an increase in the Ann Arbour stage, with the majority of VTE cases occurring within 3 months after chemotherapy [Citation20]. Another study identified that the risk of VTE in lymphoma patients was influenced by patient-related factors, histological type, stage, and treatment regimen [Citation21]. The HD13–15 study [Citation22], involving 5,773 patients with Hodgkin lymphoma in advanced stages, reported the highest risk of VTE. Consistent with previous studies [Citation23], our research also identified age as a risk factor for lymphoma-associated VTE. Moreover, a platelet count ≥350 × 109/L was found to increase the risk of VTE and act as an independent risk factor in lymphoma patients. Several studies have associated the use of chemotherapy drugs such as thalidomide and its analogues, cisplatin, L-asparaginase, and doxorubicin with an increased incidence of VTE [Citation24,Citation25]. Similarly, our study revealed that an increase in the chemotherapy cycle was linked to a higher risk of VTE in lymphoma patients. This effect may be attributed to the cumulative impact of chemotherapy drugs, leading to sustained damage to vascular endothelial cells, elevated pro-coagulant proteins, reduced endogenous anticoagulants, and platelet activation. Our findings also indicated that patients with an ECOG score of 2 had a greater risk of VTE compared to those with an ECOG score of 1, aligning with the clinical observation that patients with poorer physical condition, prolonged bed rest, and higher thrombosis risk are associated with higher ECOG scores. Notably, patients with an ECOG score of 0 exhibited an increased risk of VTE compared to those with an ECOG score of 1, possibly due to the fact that patients with an ECOG score of 0 generally have better overall condition and receive stronger and more frequent doses of chemotherapy drugs. Furthermore, D-dimer was identified as a reliable predictor of VTE, with numerous studies confirming its correlation with VTE in haematologic malignancies.
Thrombosis prevention plays a crucial role in reducing the mortality rate among malignant tumour patients, offering long-term benefits with minimal investment. The nomogram model provides an accurate estimation of VTE risk in lymphoma patients, enabling the identification of high-risk individuals who can benefit from specific treatments and preventive anticoagulant therapy. Our study is limited to a single centre and may not fully represent the broader population, and our study has a certain selection bias in the selection of samples. But it can still offer valuable insights and guidance for clinicians and serve as a consultation resource for patients. We anticipate that future research and data collection will further enhance our understanding of thrombosis prevention and treatment, leading to more precise interventions.
Ethics approval and consent to participate
In our research, we followed the Declaration of Helsinki’s ethical principles concerning the use of human subjects in medical research. Chongqing University Cancer Hospital’s Ethics Committee reviewed and approved research studies(Approval Number -CZLS2021252-A).
Authors’ contributions
GL conceived and designed the study. XL and QX performed statistical analysis and interpretation. GL and QX drafted the manuscript. ZY and JL performed the data collection and cleaning. AS,GW and HL designed and substantively revised the article. All authors contributed to the article and approved the final manuscript.
Acknowledgements
We would like to thank all participants as no meaningful research could have been conducted without them.
Disclosure statement
The authors declare that they have no known competing financial interests or personal relationships that could have appeared to influence the work reported in this paper.
Data availability statement
The datasets generated and/or analyzed during the current study are not publicly available due to local legal requirements but are available from the corresponding author on reasonable request.
Additional information
Funding
References
- Key NS, Khorana AA, Kuderer NM, et al. Venous thromboembolism prophylaxis and treatment in patients with cancer: ASCO clinical practice guideline update. J Clin Oncol. 2020;38(5):1–9. doi: 10.1200/JCO.19.01461.
- Bartholomew JR. Update on the management of venous thromboembolism. Cleve Clin J Med. 2017;84(12 Suppl 3):39–46. doi: 10.3949/ccjm.84.s3.04.
- Cronin-Fenton DP, Sondergaard F, Pedersen LA, et al. Hospitalisation for venous thromboembolism in cancer patients and the general population: a population-based cohort study in Denmark, 1997-2006. Br J Cancer. 2010;103(7):947–953. doi: 10.1038/sj.bjc.6605883.
- Chew SH, Achmad Sankala HB, Chew E, et al. Tumefactive demyelinating lesions versus CNS neoplasms, a comparative study. Mult Scler Relat Disord. 2023;79:104992. doi: 10.1016/j.msard.2023.104992.
- Bahl V, Hu HM, Henke PK, et al. A validation study of a retrospective venous thromboembolism risk scoring method. Ann Surg. 2010;251(2):344–350. doi: 10.1097/SLA.0b013e3181b7fca6.
- Khorana AA, Kuderer NM, Culakova E, et al. Development and validation of a predictive model for chemotherapy-associated thrombosis. Blood. 2008;111(10):4902–4907. doi: 10.1182/blood-2007-10-116327.
- Li J, Qiang WM, Wang Y, et al. Development and validation of a risk assessment nomogram for venous thromboembolism associated with hospitalized postoperative Chinese breast cancer patients. J Adv Nurs. 2021;77(1):473–483. doi: 10.1111/jan.14571.
- Wang L, Wei S, Zhou B, et al. A nomogram model to predict the venous thromboembolism risk after surgery in patients with gynecological tumors. Thromb Res. 2021;202:52–58. doi: 10.1016/j.thromres.2021.02.035.
- Wang Y, Zhou H, Zhong G, et al. Development and validation of a nomogram to predict the probability of venous thromboembolism in patients with epithelial ovarian cancer. Clin Appl Thromb Hemost. 2022;28:10760296221095558. doi: 10.1177/10760296221095558.
- Zhang HR, Xu MY, Yang XG, et al. Nomogram for predicting the postoperative venous thromboembolism in spinal metastasis tumor: a multicenter retrospective study. Front Oncol. 2021;11:629823. doi: 10.3389/fonc.2021.629823.
- Yang J, Zhang Y, Yang P, et al. A novel nomogram based on prognostic factors for predicting venous thrombosis risk in lymphoma patients. Leuk Lymphoma. 2021;62(10):2383–2391. doi: 10.1080/10428194.2021.1913149.
- Chen Y, Lei H, Wang W, et al. Characteristics and predictors of venous thromboembolism among lymphoma patients undergoing chemotherapy: a cohort study in China. Front Pharmacol. 2022;13:901887. doi: 10.3389/fphar.2022.901887.
- Lei H, Tao D, Zhang N, et al. Nomogram prediction for the risk of venous thromboembolism in patients with lung cancer. Cancer Cell Int. 2023;23(1):40. doi: 10.1186/s12935-023-02882-1.
- Kekre N, Connors JM. Venous thromboembolism incidence in hematologic malignancies. Blood Rev. 2019;33:24–32. doi: 10.1016/j.blre.2018.06.002.
- Zhou H, Hu Y, Li X, et al. Assessment of the risk of venous thromboembolism in medical inpatients using the Padua prediction score and Caprini risk assessment model. J Atheroscler Thromb. 2018;25(11):1091–1104. doi: 10.5551/jat.43653.
- Park SY. Nomogram: an analogue tool to deliver digital knowledge. J Thorac Cardiovasc Surg. 2018;155(4):1793. doi: 10.1016/j.jtcvs.2017.12.107.
- Guntupalli SR, Spinosa D, Wethington S, et al. Prevention of venous thromboembolism in patients with cancer. BMJ. 2023;381:e072715. doi: 10.1136/bmj-2022-072715.
- Richie CD, Castle JT, Davis GA, et al. Modes of failure in venous thromboembolism prophylaxis. Angiology. 2022;73(8):712–715. doi: 10.1177/00033197221083724.
- Caruso V, Di Castelnuovo A, Meschengieser S, et al. Thrombotic complications in adult patients with lymphoma: a meta-analysis of 29 independent cohorts including 18 018 patients and 1149 events. Blood. 2010;115(26):5322–5328. doi: 10.1182/blood-2010-01-258624.
- Antic D, Jelicic J, Vukovic V, et al. Venous thromboembolic events in lymphoma patients: Actual relationships between epidemiology, mechanisms, clinical profile and treatment. Blood Rev. 2018;32(2):144–158. doi: 10.1016/j.blre.2017.10.002.
- Schmidt RA, Lee AYY. How I treat and prevent venous thrombotic complications in patients with lymphoma. Blood. 2022;139(10):1489–1500. doi: 10.1182/blood.2019003689.
- Borchmann S, Müller H, Hude I, et al. Thrombosis as a treatment complication in hodgkin lymphoma patients: a comprehensive analysis of three prospective randomized German Hodgkin study group (GHSG) trials. Ann Oncol. 2019;30(8):1329–1334. doi: 10.1093/annonc/mdz168.
- Heit JA. Epidemiology of venous thromboembolism. Nat Rev Cardiol. 2015;12(8):464–474. doi: 10.1038/nrcardio.2015.83.
- Oppelt P, Betbadal A, Nayak L. Approach to chemotherapy-associated thrombosis. Vasc Med. 2015;20(2):153–161. doi: 10.1177/1358863X14568705.
- Kim SH, Lim KM, Noh JY, et al. Doxorubicin-induced platelet procoagulant activities: an important clue for chemotherapy-associated thrombosis. Toxicol Sci. 2011;124(1):215–224. doi: 10.1093/toxsci/kfr222.