
Abstract
Background
Immune checkpoint inhibitors (ICIs) have achieved substantial advancements in clinical care. However, there is no strong evidence for identified biomarkers of ICIs in NPC.
Methods
In this retrospective study, 284 patients were enrolled into a training or validation cohort. Inflammatory indexes based on peripheral blood parameters were evaluated, including the systemic immune-inflammation index (SII), the neutrophil-lymphocyte ratio (NLR), the platelet-lymphocyte ratio (PLR), the lymphocyte-to-C-reactive protein ratio (LCR), and the lymphocyte-monocyte ratio (LMR). The optimum cut-off value for patient stratification was identified using X-tile. The Kaplan-Meier method and Cox’s proportional regression analyses were used to identify prognostic factors.
Results
Immunotherapy significantly changed the levels of SII, NLR, PLR, LCR and LMR in NPC patients. Patients with lower SII, NLR, and PLR, as well as those with higher LCR and LMR, before immunotherapy had superior PFS (all p < 0.05). Moreover, PFS in the decreased SII, reduced NLR and increased LMR group was significantly longer than in the opposite group (all p < 0.05). Both univariate and multivariate analyses validated that baseline SII and LMR, and the immunotherapy-related SII reduction and LMR elevation were independent prognostic factors for PFS in advanced NPC patients receiving ICIs.
Conclusions
Immune checkpoint inhibitor treatments significantly changed the levels of SII, NLR, PLR, LCR and LMR in NPC patients treated with immunotherapy. A lower baseline SII and a higher baseline LMR, and a reduction in SII and an elevation in LMR after immunotherapy are favorable factors for predicting survival among advanced NPC patients.
KEY MESSAGES
There is no strong evidence for identified biomarkers of immune checkpoint inhibitors (ICIs) in nasopharyngeal carcinoma (NPC).
Lower baseline SII and higher baseline LMR were related to better PFS. The dynamic changes of SII and LMR were independent prognostic factors for the survival of NPC patients receiving ICIs.
Neutrophils, platelets, lymphocytes, and monocytes can be used as cheap and valuable biomarkers for predicting tumor response in NPC on immunotherapy.
Introduction
Nasopharyngeal carcinoma (NPC) is a local malignant tumor characterized by its unique geographical locality. It mainly occurs in south China, Southeast Asia and North Africa, where there is a high incidence of the Epstein-Barr virus (EBV), which is linked to the etiology of NPC [Citation1]. Advances in radiotherapy and combination chemotherapy strategies have increased 5-year survival rates to nearly 80% depending on the stage of the disease, but advanced patients are still prone to recurrence and distant metastasis [Citation2]. Tumor immunotherapy is a new therapeutic method developed in recent years, which has greatly changed the treatment regimen of NPC [Citation3]. Camrelizumab is a programmed cell death protein 1 (PD-1) inhibitor. It was approved by the Chinese National Medical Products Administration (NMPA) in 2021 to treat patients with advanced NPC [Citation4]. Although immune checkpoint inhibitors (ICIs) elicit durable antitumor effects, more than 60% of patients with refractory recurrence and/or metastatic (R/M NPC) do not benefit clinically from single-agent immunotherapy [Citation3]. Thus, there is an urgent need to identify patients that are likely to benefit from ICIs. The tumor-node-metastasis (TNM) staging system is extensively used for guiding clinical treatment selection; however, many patients with equal staging have differing clinical outcomes [Citation5]. This may be due to the inherent biodiversity and tumor heterogeneity in different patients [Citation6]. Therefore, more accurate and available indicators are needed to predict effective immunotherapy treatment outcomes.
The interaction between systemic inflammation and the local immune response has been identified in tumorigenesis, development, and clinical prognosis of several types of malignancies [Citation7,Citation8]. Thus, inflammatory biomarkers reflecting a response to ICIs treatments may help clinical decision-making. Several baseline inflammatory and immune-based prognostic scores, namely, the systemic immune-inflammation index (SII), the neutrophil–lymphocyte ratio (NLR), the platelet–lymphocyte ratio (PLR), the lymphocyte-to-C-reactive protein ratio (LCR), and the lymphocyte–monocyte ratio (LMR) have been reported to predict immunotherapy prognosis of malignant tumors for gastric cancer [Citation9], small cell lung cancer [Citation10], urinary tract cancer [Citation11], pancreatic cancer [Citation12], and esophageal squamous cell carcinoma [Citation13]. For instance, in patients with advanced urothelial carcinoma receiving atezolizumab, a low baseline SII level showed a better median overall survival (OS) [Citation11]. Similarly, SII was shown to be highly related to an incremental risk of death in pancreatic cancer [Citation12]. Yet, the relationship between peripheral inflammatory indexes and NPC patient survival for those receiving ICIs, as far as we know, has not been investigated.
Apart from baseline peripheral blood biomarkers, a previous study reported that the changes in biomarkers during immunotherapy treatment would be more telling of a direct treatment response [Citation12]. A few studies have focused on the changes in inflammatory markers pre- and post-immunotherapy, which might reflect the relationship between the host’s innate inflammatory being and the immune response [Citation12]. For instance, Shang et al. showed that elevated NLR after two doses of immunotherapy was associated with better progression-free survival (PFS) for pancreatic cancer (PC) patients, and that elevated SII was a negative predictor for the survival of PC patients receiving ICIs combined with chemotherapies as a first-line treatment [Citation12]. Moreover, it has been reported that increased PLR and NLR values 6 weeks after immunotherapy are related to poor prognosis in advanced solid cancer patients receiving ICIs [Citation14]. Chen et al. also indicated that gastric cancer patients with a higher baseline LMR and incremental LMR after ICI therapy had superior PFS [Citation15]. However, the dynamic changes of these peripheral inflammatory indexes in the context of ICIs for NPC have not been previously studied. Here, we aimed to discover the prognostic value of baseline inflammatory and immune-based prognostic indexes as well as their dynamic changes in NPC patients who received ICIs.
Patients and methods
Patients
One hundred and eighty-four patients diagnosed with NPC between 2005 and 2021 at Sun Yat-sen University Cancer Center (SYSUCC) were included into a training cohort, and 100 NPC patients at the Second Affiliated Hospital of Guilin Medical University were enrolled into a validation cohort. The American Joint Committee on Cancer (AJCC, 8th Ed.) staging system was used for classification. The study inclusion criteria were: (1) patients with histopathological confirmed NPC; (2) locally advanced recurrent or metastatic NPC with failed standard therapy or without effective standard therapy; (3) treated with ICIs; and (4) patients with a complete record of hematological indicators. The exclusion criteria were: patients with other malignancies, and treated with targeted therapy (cetuximab and so on). The patient enrollment flowchart is shown in Supplementary Figure 1. Data was collected regarding age, gender, karnofsky performance score (KPS), TNM stage, smoking status, EBV status, family history, radiotherapy history, and immunotherapy type.
Assessment of hematological parameters
Fasting whole blood was collected from patients in an ethylene diamine tetraacetic acid (EDTA) anticoagulant-treated tube upon admission prior to the next cycle of treatment, and analyzed within 30 min of collection. A combination of two or three hematological inflammation parameters, SII, NLR, PLR, LCR, and LMR were defined as: SII = Neutrophils × platelets/lymphocytes; NLR = Neutrophils/lymphocytes; PLR = Platelets/lymphocytes [Citation16]; LCR = Lymphocyte/C-reactive protein; LMR = Lymphocytes/monocytes (Supplementary Table 1). We included SII, NLR, PLR, LCR and LMR at the initiation of the ICIs and at the time of achieving optimal antitumor effectiveness after immunotherapy. The optimal antitumor effectiveness was defined as the best therapeutic effect achieved by each patient during the course of immunotherapy, including complete remission (CR), partial response (PR), stable disease (SD), or progressive disease (PD). The mean period after the initiation of ICIs to the evaluation of hematological biomarkers was 5.56 months for the training cohort and 9.07 months for the validation cohort. In addition, the optimal antitumor effectiveness in the training cohort was 52 patients of PD, 71 patients of PR, and 61 patients of SD. In the validation cohort, the optimal antitumor effectiveness was PD in 15 patients, PR in 41 patients, and SD in 44 patients.
X-Tile™
Participants were categorized as having ‘low’ or ‘high’ levels of an indicator via the X-Tile software (Yale University, New Haven, CT, US). X-Tile was also used to evaluate the ideal cut-off value of peripheral blood baseline inflammatory and immune-based prognostic indexes in the training cohort [Citation17].
Follow-up
NPC patients were mostly followed-up by telephone and periodic hospital review. Follow-up was performed every 6 weeks after treatment until death. The last patient follow-up was carried out in April 2022. PFS was considered the time between the initial treatment and the date of disease progression or death from any cause.
Statistical analyses
X-Tile was used to find the optimal cut-off values. The paired t-test was used to assess the inflammatory and immune-based prognostic index levels at two different time points. The Kaplan-Meier method and the log-rank test were used to compare survival. To determine the prognostic value of the potential factors, univariate, and multivariate analyses were conducted. Variables with P values < 0.15 based on the univariate analysis were included in the multivariate Cox regression model, together with 95% confidence intervals (CIs). For statistical analyses, SPSS25 (IBM, Armonk, NY, USA), X-Tile (Version 3.6.1), and Graphpad Prism 8 (Graphpad Software, CA, USA) were used.
Results
Patient baseline characteristics
A total of 284 patients were included this study: 184 in the training cohort, and 100 in the validation cohort. The patients’ baseline characteristics are detailed in Supplementary Table 2.
In the training cohort, the median age of the patients was 46 years old, and 152 (82.6%) patients were male. Most of the patients were EBV-positive (72%). And the majority of patients (74%) had received radiotherapy. Only 23 (13%) patients had a family history of NPC. Also, 127 (69%) patients were nonsmokers, and 57 (31%) were smokers. As for disease stage, 5 (2.7%) patients were stage I, 30 (16.3%) were stage II, 67 (36.4%) were stage III, and 82 (44.6%) were stage IV. Considering the type of immunotherapy, 82 (44.6%) patients received Camrelizumab, 54 (29.3%) Toripalimab, 32 (17.4%) Sintilimab, 10 (5.4%) Nivolumab, and 6 (3.3%) Pembrolizumab. The median PFS of the training cohort was 7.88 months.
The validation cohort consisted of 74 (74%) men and 26 (26%) women. The median age was 53 years old. In this cohort, 68 (68%) patients were EBV-negative. And 66 (66%) patients received radiotherapy. Just 12 (12%) patients had a family history of NPC. And most patients were nonsmokers (70%). In terms of disease stage, 5 (5%) patients were stage I, 8 (8%) were stage II, 40 (40%) were stage III, and 47 (47%) were stage IV. The immunotherapy treatments in this group were Camrelizumab (46/46%), Toripalimab (30/30%), Sintilimab (14/14%), Nivolumab (5/5%), and Pembrolizumab (5/5%). The median PFS was 12.67 months in this cohort. In general, there was no significant difference between the two cohorts.
Comparison of peripheral blood levels of inflammation-related indications before and after immunotherapy
In contrast to the baseline of the inflammatory and immune-based prognostic indexes, we observed significant undulation of SII, NLR, PLR, LCR, and LMR in NPC patients’ post-immunotherapy (Supplementary Table 3). There were significant differences between the inflammation-related indication levels pre-immunotherapy and post-immunotherapy in both the training and validation cohorts (p < 0.05). In the training cohort, the mean level of SII pre-immunotherapy and post-immunotherapy were 1272 and 1570. The mean level of LMR at baseline was 2.83 and 2.62 after immunotherapy. While in the validation cohort, compared with the baseline level, the mean level of SII, and LMR were 1017 vs 805.3, and 2.90 vs 3.61 after receiving ICIs, respectively.
Evaluation of inflammation-related Indications before immunotherapy by X-Tile
X-Tile was used to find the optimum cut-off value for the baseline inflammatory and immune-based prognostic indexes on PFS. Based on the data of the training group, the appropriate baseline cut-off values for SII, NLR, PLR, LCR, and LMR levels conducted by X-Tile were 947.82, 3.17, 253.52, 0.03, and 1.34, respectively (Supplementary Figure 2). The results of the validation cohort were analyzed according to the cut-off value of the training cohort.
The impact of inflammation-related indications on PFS
The SII, NLR, PLR, LCR, and LMR levels before immunotherapy were categorized as ‘high’ or ‘low’ based on the cut-offs identified by X-tile. The association between the baseline level and dynamic changes in the inflammation-related indication levels and PFS for NPC patients were analyzed (, and ). In the two cohorts, it was found that a high baseline SII, NLR, PLR, and a low baseline LCR, LMR in peripheral blood indicated poor PFS prognosis for NPC patients receiving immunotherapy ( and ).
Figure 1. Survival curves according to the cutoff levels of baseline SII, NLR, PLR, LCR, and LMR determined by X-tile.
(A) Significant difference in PFS between patients with baseline SII higher than 947.82 and those with SII lower than 947.82 (6.27 months vs 11.43 months, P < 0.001) in the training cohort.
(B) Significant difference in PFS between patients with baseline NLR lower than 3.17 and those with NLR higher than 3.17 (11.43 months vs 6.3 months, P = 0.0014) in the training cohort.
(C) Significant difference in PFS between patients with baseline PLR lower than 253.52 and those with PLR higher than 253.52 (9.5 months vs 6.1 months, P = 0.0335) in the training cohort.
(D) Significant difference in PFS between patients with baseline LCR higher than 0.03 and those with LCR lower than 0.03 (9.6 months vs 3.95 months, P = 0.0009) in the training cohort.
(E) Significant difference in PFS between patients with baseline LMR higher than 1.34 and those with LMR lower than 1.34 (9.4 months vs 1.78 months, P < 0.001) in the training cohort.
(F) Significant difference in PFS between patients with baseline SII higher than 947.82 and those with SII lower than 947.82 (8.17 months vs 17.9 months, P = 0.0423) in the validation cohort.
(G) Significant difference in PFS between patients with baseline NLR lower than 3.17 and those with NLR higher than 3.17 (17.9 months vs 12.6 months, P = 0.016) in the validation cohort.
(H) Significant difference in PFS between patients with baseline PLR lower than 253.52 and those with PLR higher than 253.52 (16.97 months vs 10.67 months, P = 0.0476) in the validation cohort.
(I) Significant difference in PFS between patients with baseline LCR higher than 0.03 and those with LCR lower than 0.03 (17 months vs 8.17 months, P = 0.0456) in the validation cohort.
(J) Significant difference in PFS between patients with baseline LMR higher than 1.34 and those with LMR lower than 1.34 (17.73 months vs 8.17 months, P = 0.0178) in the validation cohort.
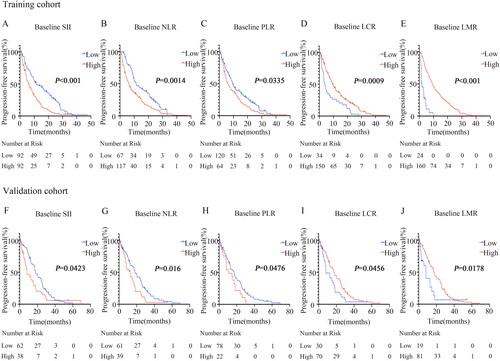
Figure 2. Survival curves according to fluctuations in SII, NLR, and LMR levels.
(A) Significant difference in SII between patients with SII elevation and those with SII reduction after receiving immunotherapy compared to the baseline (7.13 months vs 11.27 months, P = 0.0416) in the training cohort.
(B) Significant difference in NLR between patients with NLR elevation and those with NLR reduction after receiving immunotherapy compared to the baseline (6.93 months vs 11.07 months, P = 0.0412) in the training cohort.
(C) Significant difference in LMR between patients with LMR elevation and those with LMR reduction after receiving immunotherapy compared to the baseline (13.3 months vs 7.1 months, P = 0.0128) in the training cohort.
(D) Significant difference in SII between patients with SII elevation and those with SII reduction after receiving immunotherapy compared to the baseline (12.63 months vs 23.5 months, P = 0.0435) in the validation cohort.
(E) Significant difference in NLR between patients with NLR elevation and those with NLR reduction after receiving immunotherapy compared to the baseline (12.6 months vs 17 months, P = 0.0399) in the validation cohort.
(F) Significant difference in LMR between patients with LMR elevation and those with LMR reduction after receiving immunotherapy compared to the baseline (17.73 months vs 8.77 months, P = 0.005) in the validation cohort.
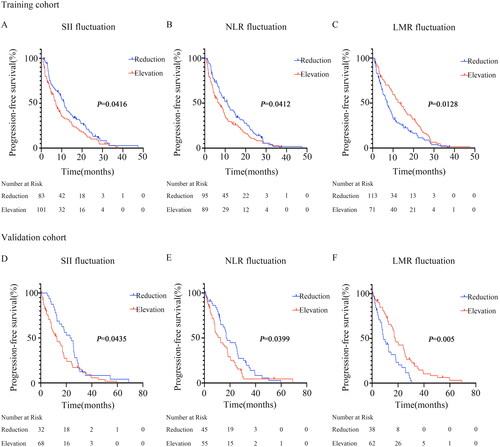
Correlations between the fluctuations in inflammation-related indications and survival were further analyzed ( and ). In the training cohort, the median PFS for patients with elevated SII was 7.13 months, while the median PFS for patients with decreased SII was 11.27 months ( and ). Furthermore, we observed that NPC patients with an increasing NLR after immunotherapy had an inferior PFS (6.93 vs. 11.07 months, p = 0.0412, , and ). Patients with an increasing LMR after receiving immunotherapy exhibited better PFS (13.3 vs 7.1 months, p = 0.0128, , and ). Most importantly, these findings were confirmed in the validation cohort ( and ). No significant difference between the dynamic changes in PLR and LCR levels was found for PFS in both the training and validation groups.
Univariate and multivariate analyses
All of the prognostic factors from the univariate and multivariate analyses are detailed in and . Regression analysis using univariate Cox models showed that the relevant risk factors for PFS for all the patients were EBV status, baseline SII, baseline NLR, baseline PLR, baseline LCR, and baseline LMR. The immunotherapy-related SII reduction and NLR decline exhibited superior PFS (all p < 0.05). Increasing LMR after immunotherapy indicated better PFS (all p < 0.05) in both cohorts.
Table 2. Predictive factors for PFS by univariate analysis.
Table 3. Predictive factors for PFS by multivariate analysis.
In the multivariate analyses, EBV status, baseline SII, and baseline LMR were found to be independent indicators for PFS in the training and validation cohorts. The immunotherapy-related SII elevation independently predicted poor PFS (training cohort: Hazard ratio (HR): 1.503, 95% CI: 1.081–2.090, p = 0.015; validation cohort: HR: 3.187, 95% CI: 1.770–5.738, p < 0.001). Moreover, post-immunotherapy LMR elevation independently indicated superior PFS (training cohort: HR: 0.646, 95% CI: 0.434–0.962, p = 0.031; validation cohort: HR: 0.350, 95% CI: 0.192–0.641, p = 0.001) in both cohorts.
Discussion
ICIs have made great progress and were approved for the treatment of R/M NPC in China in 2021. Despite the considerable progress in clinical treatment, only a small number of NPC patients achieve clinical benefits and enhanced survival from immunotherapy [Citation3]. Therefore, the identification of biomarkers that predict the response and elaborate on the biological mechanisms of responders and non-responders to immunotherapy are of utmost importance. In our study, we determined 5 hematological inflammation parameters for outcome prediction in patients with advanced NPC who received immunotherapy. We first observed that immunotherapy significantly altered the levels of inflammation parameters including elevated SII, NLR, and PLR as well as decreased LCR and LMR. We found that patients with lower baseline levels of SII, NLR, and PLR, and higher baseline levels of LCR and LMR exhibited longer PFS. More importantly, we evaluated the prognostic value of immunotherapy-related dynamic inflammation parameter alterations for tumor progression and identified that SII reduction and LMR elevation were prominently correlated with superior PFS in NPC patients who received immunotherapy.
Alterations in hematological inflammation parameters observed after immunotherapy are partially consistent with previous investigations. In metastatic renal cell carcinoma (RCC) patients treated with ICIs, SII had visibly changed after immunotherapy [Citation18,Citation19]. Similarly, other researchers found a significant change in NLR, PLR, and LMR in advanced RCC patients 6 weeks after nivolumab treatment [Citation20]. A reduction in NLR has also been shown in 40.9% of esophageal squamous cell carcinoma patients in the response group, and 45.2% in the non-response group at 6 weeks post anti-PD-1 inhibitor treatment [Citation13]. The immunotherapy-related fluctuation in NLR has been documented for several tumors, namely, non-small cell lung cancer [Citation21,Citation22], hepatocellular carcinoma [Citation23], urothelial carcinoma [Citation24], head and neck cancer [Citation25], and gastric cancer [Citation26]. Based on this growing evidence, it would seem that immunotherapy leads to the undulation of inflammatory indexes.
Our data identified a positive association between a lower baseline SII and a favorable immunotherapy response, which was confirmed as an independent predictive indicator for superior PFS in NPC patients. It has been reported that systemic immune-inflammation indexes could predict prognosis in patients with nasopharyngeal carcinoma [Citation27,Citation28]. Similar to our finding, a lower SII at baseline significantly predicted longer survival in patients who received ICIs for various cancers, including urothelial carcinoma [Citation11], pancreatic cancer [Citation12], renal cell carcinoma [Citation29], and biliary tract cancer [Citation30]. However, the PFS rate was similar between the SII low group and the SII high group for esophageal squamous cell carcinoma (ESCC) patients who received combined treatment with an anti-PD-1 antibody [Citation13]. As to the baseline LMR, in a study including advanced gastric cancer patients receiving ICIs, patients with a higher LMR at baseline had superior PFS and OS [Citation15]. In addition, a baseline LMR of at least 1.7 showed improved PFS and OS in patients for pembrolizumab-treated metastatic melanoma [Citation31]. All of the above research supports our result that a higher baseline LMR may be a promising factor for predicting immunotherapy survival. Other studies have also shown that baseline LMR has no prognostic effect in metastatic RCC patients treated with nivolumab [Citation29]. However, such results may due to the line of immunotherapy, the type of tumor, the kind of immunotherapy, the pathology of the cancer, and the time of blood sample collection. Further evidence is required.
Cancer patients often show immunotherapy-induced alterations in hematological inflammation parameters as aforementioned. Hence, we further studied whether the dynamic inflammation index fluctuations impact the survival of NPC patients. Our results revealed that elevated SII and reduced LMR were negative predictors of PFS for NPC patients receiving ICIs. Some studies have reported the prognostic importance of dynamic changes in SII and LMR regarding the survival of immunotherapy patients. For pancreatic cancer patients receiving ICIs, an increasing baseline SII was a negative predictor for both OS and PFS [Citation12]. Further, a rising SII was associated with tumor progression after 12 weeks of ICI treatment in mRCC patients [Citation19]. One study showed that rising of LMR at 4 weeks after nivolumab immunotherapy was positively correlated with an objective response and a prolonged PFS in advanced non-small cell lung carcinoma (NSCLC) patients [Citation32]. Similarly, 154 patients with advanced NSCLC who received ICIs, a ≥ 30% elevation in LMR from T0 (baseline) to T1 (second cycle) and T0 to T2 (third cycle) correlated with the overall response rate [Citation33]. All of the above studies fully confirm the reliance of our results.
In accordance with the definitions of SII and LMR, elevated SII and reduced LMR may be due to thrombocytosis, neutrophilia, lymphocytopenia, and monocytosis. It has been reported that increasing platelets may provide support for tumor development by increasing tumor vasculogenesis and generating adhesive molecules [Citation34,Citation35]. Neutrophils may not only stimulate the proliferation and metastasis of tumors [Citation36], but also resuscitate aged cancer cells and contribute to immune evasion by inhibiting the activation of T cells [Citation37]. In addition, the absence of enough lymphocytes may cause an underactive tumor immune response [Citation38]. Monocytes can also encourage tumorigenesis by suppressing the anti-tumor immune response in vivo [Citation39]. In a sense, our findings confirm the involvement of neutrophils, platelets, lymphocytes, and monocytes in the immunology of cancer.
This study has some limitations. (1) This is a retrospective study. (2) Patient overall survival was immature for analysis. Only PFS analysis was performed. Despite these limitations, we were able to identify some prognostic indexes: a high baseline SII, a low baseline LMR, higher post-immunotherapy SII, and lower post-immunotherapy LMR detrimentally affected survival. The specific and fundamental mechanisms however, remain unidentified. Our findings require verification in a larger study that also assesses the mechanisms and connections between inflammatory and immune-based prognostic indexes and NPC survival. There should also be more research with larger samples to prove the predictive power of SII and LMR fluctuations in various cancers treated with immunotherapy. The frequency of monitoring SII and LMR also needs further verification.
In our study, we revealed that immunotherapy significantly alters the levels of SII, NLR, PLR, LCR, and LMR in NPC patients treated with ICIs. Our investigation confirmed a significant association between SII changes, LMR changes, baseline SII, baseline LMR and immunotherapy effectiveness. This is, as far as we know, the first study to present the prognostic value of dynamic changes in patients with NPC receiving ICIs in two independent cohorts. Our findings are not only consistent with the literature, but also provide new results, in those neutrophils, platelets, lymphocytes, and monocytes are cheap and clinically valuable biomarkers for predicting tumor response.
Conclusions
Immune checkpoint inhibitor treatments meaningfully changed the levels of SII, NLR, PLR, LCR, and LMR in NPC patients treated with immunotherapy. Lower baseline SII, NLR, and PLR, and higher baseline LCR, and LMR, were related to a better PFS. A decreasing SII and an increasing LMR were associated with a longer PFS. The dynamic changes of SII and LMR were independent prognostic factors for the survival of NPC patients receiving ICIs. Therefore, the monitoring of neutrophils, lymphocytes, monocytes, and platelets, are of great value for immunotherapy. Clinically, the fluctuations in SII and LMR may be used to predict survival. In the future, we anticipate that these biomarkers will be a dependable indicator in predicting the prognosis of NPC patients treated with immunotherapy.
Authors contributions
Study concepts: Hongyun Zhao and Fan Luo; Study design: Hongyun Zhao and Fan Luo; Data acquisition: Jiaxin Cao, Qun Chen, Xue Bai, Lusha Liu, Wenjuan Ma, Chaozhuo Lin; Quality control of data and algorithms: Hongyun Zhao, Fan Luo, Ting Zhou, Jianhua Zhan; Data analysis and interpretation: Jiaxin Cao, Qun Chen, Xue Bai, Lusha Liu;Statistical analysis: Jiaxin Cao, Qun Chen, Xue Bai, Lusha Liu, Feiteng Lu; Manuscript preparation: Jiaxin Cao, Qun Chen, Xue Bai, Lusha Liu, Fan Luo; Manuscript editing: Hongyun Zhao, Fan Luo, Yan Huang, Yunpeng Yang; Manuscript review: Hongyun Zhao and Fan Luo.
Ethics approval and consent to participate
The study was conducted in accordance with the Declaration of Helsinki and was approved by the Ethical Review Committee of Sun Yat-sen University Cancer Center (B2022-338-01). Informed written consent was obtained from all participants.
Table 1. The impact of baseline inflammation-related indications and dynamic changes for PFS.
| Abbreviations | ||
| NPC | = | nasopharyngeal carcinoma |
| EBV | = | Epstein-Barr virus |
| PD-1 | = | programmed cell death protein 1 |
| NMPA | = | National medical products administration |
| ICIs | = | immune checkpoint inhibitors |
| R/M NPC | = | refractory recurrence and/or metastatic nasopharyngeal carcinoma |
| SII | = | systemic immune-inflammation index |
| NLR | = | neutrophil-lymphocyte ratio |
| PLR | = | platelet-lymphocyte ratio |
| LCR | = | lymphocyte-to-C-reactive protein ratio |
| LMR | = | lymphocyte-monocyte ratio |
| OS | = | overall survival |
| PFS | = | progression-free survival |
| PC | = | pancreatic cancer |
| SYSUCC | = | Sun Yat-sen University Cancer Center |
| AJCC | = | American Joint Committee on Cancer |
| EDTA | = | ethylene diamine tetraacetic acid |
| CR | = | complete remission |
| PR | = | partial response |
| SD | = | stable disease |
| PD | = | progressive disease |
| CIs | = | confidence intervals |
| HR | = | Hazard ratio |
| RCC | = | renal cell carcinoma |
| ESCC | = | esophageal squamous cell carcinoma |
| NSCLC | = | non-small cell lung carcinoma |
| TNM | = | tumor-node-metastasis |
| KPS | = | Karnofsky Performance Score |
Supplemental Material
Download MS Word (274 KB)Acknowledgments
The authors thank the patients, their families and caregivers for participating in the study and all site personnel and clinical staff for clinical support in this research.
Disclosure statement
No potential conflict of interest was reported by the author(s).
Data availability statement
The data generated and analyzed is available from the corresponding author upon reasonable request. The authenticity of this article has been validated with key raw data uploaded onto the Research Data Deposit (RDD) public platform (https://www.researchdata.org.cn). The approval RDD number is RDDA2023623285.
Additional information
Funding
References
- Chen YP, Chan ATC, Le QT, et al. Nasopharyngeal carcinoma. Lancet. 2019;394(10192):1–11. doi: 10.1016/S0140-6736(19)30956-0.
- Xu T, Tang J, Gu M, et al. Recurrent nasopharyngeal carcinoma: a clinical dilemma and challenge. Curr Oncol. 2013;20(5):e406-19–e419. doi: 10.3747/co.20.1456.
- Xu JY, Wei XL, Wang YQ, et al. Current status and advances of immunotherapy in nasopharyngeal carcinoma. Ther Adv Med Oncol. 2022;14:175883592210962. doi: 10.1177/17588359221096214.
- Killock D. Camrelizumab efficacious in NPC. Nat Rev Clin Oncol. 2021;18(9):542–542. doi: 10.1038/s41571-021-00542-9.
- Liu MZ, Tang LL, Zong JF, et al. Evaluation of sixth edition of AJCC staging system for nasopharyngeal carcinoma and proposed improvement. Int J Radiat Oncol Biol Phys. 2008;70(4):1115–1123. doi: 10.1016/j.ijrobp.2007.07.2353.
- Yan C, Shen DS, Chen XB, et al. CT-based radiomics nomogram for prediction of progression-free survival in locoregionally advanced nasopharyngeal carcinoma. Cancer Manag Res. 2021;13:6911–6923. doi: 10.2147/CMAR.S325373.
- Crusz SM, Balkwill FR. Inflammation and cancer: advances and new agents. Nat Rev Clin Oncol. 2015;12(10):584–596. doi: 10.1038/nrclinonc.2015.105.
- Diakos CI, Charles KA, McMillan DC, et al. Cancer-related inflammation and treatment effectiveness. Lancet Oncol. 2014;15(11):e493–e503. doi: 10.1016/S1470-2045(14)70263-3.
- Ding P, Guo H, Sun C, et al. Combined systemic immune-inflammatory index (SII) and prognostic nutritional index (PNI) predicts chemotherapy response and prognosis in locally advanced gastric cancer patients receiving neoadjuvant chemotherapy with PD-1 antibody sintilimab and XELOX: a prospective study. BMC Gastroenterol. 2022;22(1):121. doi: 10.1186/s12876-022-02199-9.
- Qi WX, Xiang Y, Zhao S, et al. Assessment of systematic inflammatory and nutritional indexes in extensive-stage small-cell lung cancer treated with first-line chemotherapy and atezolizumab. Cancer Immunol Immunother. 2021;70(11):3199–3206. doi: 10.1007/s00262-021-02926-3.
- Fornarini G, Rebuzzi SE, Banna GL, et al. Immune-inflammatory biomarkers as prognostic factors for immunotherapy in pretreated advanced urinary tract cancer patients: an analysis of the Italian SAUL cohort. ESMO Open. 2021;6(3):100118. doi: 10.1016/j.esmoop.2021.100118.
- Shang J, Han X, Zha H, et al. Systemic immune-inflammation index and changes of neutrophil-lymphocyte ratio as prognostic biomarkers for patients with pancreatic cancer treated with immune checkpoint blockade. Front Oncol. 2021;11:585271. doi: 10.3389/fonc.2021.585271.
- Wu X, Han R, Zhong Y, et al. Post treatment NLR is a predictor of response to immune checkpoint inhibitor therapy in patients with esophageal squamous cell carcinoma. Cancer Cell Int. 2021;21(1):356. doi: 10.1186/s12935-021-02072-x.
- Bilen MA, Martini DJ, Liu Y, et al. The prognostic and predictive impact of inflammatory biomarkers in patients who have advanced-stage cancer treated with immunotherapy. Cancer. 2019;125(1):127–134. doi: 10.1002/cncr.31778.
- Chen Y, Zhang C, Peng Z, et al. Association of lymphocyte-to-monocyte ratio with survival in advanced gastric cancer patients treated with immune checkpoint inhibitor. Front Oncol. 2021;11:589022. doi: 10.3389/fonc.2021.589022.
- Zeng X, Liu G, Pan Y, et al. Development and validation of immune inflammation-based index for predicting the clinical outcome in patients with nasopharyngeal carcinoma. J Cell Mol Med. 2020;24(15):8326–8349. doi: 10.1111/jcmm.15097.
- Camp RL, Dolled-Filhart M, Rimm DL. X-tile: a new bio-informatics tool for biomarker assessment and outcome-based cut-point optimization. Clin Cancer Res. 2004;10(21):7252–7259. doi: 10.1158/1078-0432.CCR-04-0713.
- De Giorgi U, Procopio G, Giannarelli D, et al. Association of systemic inflammation index and body mass index with survival in patients with renal cell cancer treated with nivolumab. Clin Cancer Res. 2019;25(13):3839–3846. doi: 10.1158/1078-0432.CCR-18-3661.
- Stühler V, Herrmann L, Rausch S, et al. Role of the systemic immune-inflammation index in patients with metastatic renal cell carcinoma treated with first-line ipilimumab plus nivolumab. Cancers (Basel). 2022; 14(12):2972. doi: 10.3390/cancers14122972.
- Yamamoto Y, Matsuyama H, Matsumoto H, et al. Prognostic value of risk stratification using blood parameters for nivolumab in Japanese patients with metastatic renal-cell carcinoma. Jpn J Clin Oncol. 2020;50(2):214–220. doi: 10.1093/jjco/hyz168.
- Hwang M, Canzoniero JV, Rosner S, et al. Peripheral blood immune cell dynamics reflect antitumor immune responses and predict clinical response to immunotherapy. J Immunother Cancer. 2022;10(6):e004688. doi: 10.1136/jitc-2022-004688.
- Ayers KL, Ma M, Debussche G, et al. A composite biomarker of neutrophil-lymphocyte ratio and hemoglobin level correlates with clinical response to PD-1 and PD-L1 inhibitors in advanced non-small cell lung cancers. BMC Cancer. 2021;21(1):441. doi: 10.1186/s12885-021-08194-9.
- Choi WM, Kim JY, Choi J, et al. Kinetics of the neutrophil-lymphocyte ratio during PD-1 inhibition as a prognostic factor in advanced hepatocellular carcinoma. Liver Int. 2021;41(9):2189–2199. doi: 10.1111/liv.14932.
- Yamamoto Y, Yatsuda J, Shimokawa M, et al. Prognostic value of pre-treatment risk stratification and post-treatment neutrophil/lymphocyte ratio change for pembrolizumab in patients with advanced urothelial carcinoma. Int J Clin Oncol. 2021;26(1):169–177. doi: 10.1007/s10147-020-01784-w.
- Iwasa YI, Yokota Y, Kitoh R, et al. Factors affecting nivolumab therapy outcome in patients with head and neck cancer: a single-center analysis. Oncology. 2022;100(4):203–211. doi: 10.1159/000522035.
- Nakamura N, Kinami S, Fujita J, et al. Chronological changes in neutrophil/lymphocyte ratio in advanced gastric cancer patients treated with nivolumab: a report of nine cases. Asian Pac J Cancer Prev. 2020;21(10):2955–2960. doi: 10.31557/APJCP.2020.21.10.2955.
- Chen Y, Sun J, Hu D, et al. Predictive value of pretreatment lymphocyte-to-monocyte ratio and platelet-to-lymphocyte ratio in the survival of nasopharyngeal carcinoma patients. Cancer Manag Res. 2021;13:8767–8779. doi: 10.2147/CMAR.S338394.
- Yuan X, Feng H, Huang H, et al. Systemic immune-inflammation index during treatment predicts prognosis and guides clinical treatment in patients with nasopharyngeal carcinoma. J Cancer Res Clin Oncol. 2023;149(1):191–202. doi: 10.1007/s00432-022-04506-z.
- Rebuzzi SE, Buti S, Sbrana A, et al. Baseline lymphocyte to monocyte ratio (LMR) and systemic inflammation index (SII) as prognostic factors in metastatic renal cell carcinoma (mRCC) patients treated with nivolumab: preliminary results of the meet-URO 15 (I-BIO-REC) study. J Clin Oncol. 2020;38(6_suppl):751–751. doi: 10.1200/JCO.2020.38.6_suppl.751.
- Du F, Qiu Z, Ai W, et al. Blood tests predict the therapeutic prognosis of anti-PD-1 in advanced biliary tract cancer. J Leukoc Biol. 2021;110(2):327–334. doi: 10.1002/JLB.5MA1220-631R.
- Failing JJ, Yan Y, Porrata LF, et al. Lymphocyte-to-monocyte ratio is associated with survival in pembrolizumab-treated metastatic melanoma patients. Melanoma Res. 2017;27(6):596–600. doi: 10.1097/CMR.0000000000000404.
- Sekine K, Kanda S, Goto Y, et al. Change in the lymphocyte-to-monocyte ratio is an early surrogate marker of the efficacy of nivolumab monotherapy in advanced non-small-cell lung cancer. Lung Cancer. 2018;124:179–188. doi: 10.1016/j.lungcan.2018.08.012.
- Prelaj A, Rebuzzi SE, Pizzutilo P, et al. EPSILoN: a prognostic score using clinical and blood biomarkers in advanced non-small-cell lung cancer treated with immunotherapy. Clin Lung Cancer. 2020;21(4):365–377.e5. doi: 10.1016/j.cllc.2019.11.017.
- Jiang L, Luan Y, Miao X, et al. Platelet releasate promotes breast cancer growth and angiogenesis via VEGF-integrin cooperative signalling. Br J Cancer. 2017;117(5):695–703. doi: 10.1038/bjc.2017.214.
- Menter DG, Kopetz S, Hawk E, et al. Platelet “first responders” in wound response, cancer, and metastasis. Cancer Metastasis Rev. 2017;36(2):199–213. doi: 10.1007/s10555-017-9682-0.
- Mantovani A, Cassatella MA, Costantini C, et al. Neutrophils in the activation and regulation of innate and adaptive immunity. Nat Rev Immunol. 2011;11(8):519–531. doi: 10.1038/nri3024.
- Di Mitri D, Toso A, Chen JJ, et al. Tumour-infiltrating Gr-1+ myeloid cells antagonize senescence in cancer. Nature. 2014;515(7525):134–137. doi: 10.1038/nature13638.
- Goto W, Kashiwagi S, Asano Y, et al. Predictive value of lymphocyte-to-monocyte ratio in the preoperative setting for progression of patients with breast cancer. BMC Cancer. 2018;18(1):1137. doi: 10.1186/s12885-018-5051-9.
- Olingy CE, Dinh HQ, Hedrick CC. Monocyte heterogeneity and functions in cancer. J Leukoc Biol. 2019;106(2):309–322. doi: 10.1002/JLB.4RI0818-311R.