
Abstract
Background/objective
Morphometric vertebral fractures (VFs) and osteopathy are prevalent and clinically significant complications of Cushing disease (CD). However whether they represent an early occurrence in the natural progression of the disease is an ongoing debate. This study aimed to assess the prevalence and determinants of VFs in patients newly diagnosed with CD.
Patients and methods
This cross-sectional case–control study recruited 75 newly diagnosed CD patients and compared them with a control group of individuals without pituitary disorders or secondary forms of osteoporosis. Demographic, clinical and biochemical data were collected. The VFs were assessed using preoperative lateral chest radiography.
Results
We found a significantly higher prevalence of VFs in the CD group than in the control group (58.7% vs. 14.5%; P < 0.001). Among the CD patients with VFs, 27 (61.4%) showed moderate/severe VFs. The CD patients with VFs had significantly higher preoperative 8 am serum cortisol (8ASC) levels than those without VFs (P < 0.001). The preoperative 4 pm adrenocorticotropic hormone (ACTH) levels (P = 0.031), preoperative 0 am ACTH levels (P = 0.021) and systolic blood pressure were slightly higher in CD patients with VFs than in those without VFs (P = 0.028). A binary multiple logistic analysis showed that 8ASC was an independent predictor of VF risk (P = 0.003). The optimal cut-off value of the preoperative serum 8ASC level for predicting VFs was 22.18 ng/mL.
Conclusions
This is the first study reporting a high prevalence of radiologic VFs in recently diagnosed CD patients. VFs may represent an early manifestation of CD and may be related to cortisol levels. Therefore, VF assessment should be included in the workup during CD diagnosis.
Introduction
Skeletal complications are prevalent and clinically significant comorbidities of Cushing disease (CD) [Citation1]. Excess glucocorticoids are associated with alterations in bone remodelling and metabolism, including suppression of osteoblast genesis and bone formation, a relative increase in bone resorption, inhibition of osteocyte function and survival, negative calcium balance and neuroendocrine dysfunctions such as hypogonadism and growth hormone (GH) deficiency [Citation2]. Consequently, the risk of fractures is significantly elevated in patients with CD, with vertebral bodies being the most frequently affected skeletal sites [Citation2]. Notably, vertebral fractures (VFs) persist as frequently underdiagnosed or misdiagnosed comorbidities in these patients and often exhibit an asymptomatic course.
The association between bone mineral density (BMD) and fractures in CD patients using dual-energy X-ray absorptiometry (DXA) is only partially supported. A substantial proportion of VFs may still occur in individuals with slightly low or normal BMD [Citation3–6]. Similar to other types of secondary osteoporosis [Citation7], DXA measurements of BMD fail to capture specific changes in bone impairment in patients with CD [Citation8]. The radiological and morphometric approaches have emerged as the methods of choice to evaluate the true prevalence and incidence of these fractures in populations and clinical studies [Citation9,Citation10]. Moreover, the morphometric approach is crucial for the correct diagnosis and estimation of this clinically relevant event, which heavily influences CD patients’ quality of life (QoL) and prognosis [Citation1].
Prior research has reported the prevalence of VFs as approximately 76% [Citation3] in endogenous hypercortisolism. However, whether VFs are early or late events in the natural history of the disease and the strategies for preventing osteopathy in CD remain uncertain.
This cross-sectional case–control study aimed to investigate the prevalence of morphometric VFs and their determinants in patients with newly diagnosed CD undergoing transsphenoidal (TNS) surgery during hospital admission.
Patients and methods
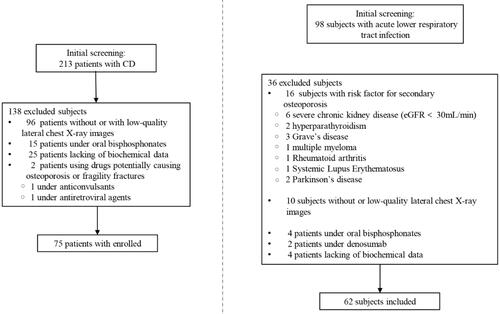
Initially, we identified 213 patients with CD as potential candidates who visited Xiangya Hospital (). The diagnosis of CD was based on typical clinical features and standard hormonal criteria [Citation1,Citation11], including increased 24-h urinary cortisol excretion, loss of the circadian rhythm of cortisol secretion and lack of cortisol suppression after a low-dose dexamethasone test (1 mg orally overnight). Adrenocorticotropic hormone (ACTH)-dependent CD was the differential diagnosis based on the analysis of plasma ACTH concentration, response to the desmopressin test, pituitary magnetic resonance imaging (MRI) and bilateral inferior petrosal sinus sampling in cases with equivocal or negative MRI findings for a pituitary lesion. The CD diagnosis was confirmed after pituitary adenomectomy, wherein the histological examination revealed adenomatous tissue with positive immunostaining for ACTH.
Figure 1. Flowchart of the screening procedure for the selection of eligible participants.
The inclusion criteria for the CD group were as follows:
Age 18–85 years
Biochemical, radiological and validated diagnostic assessments of CD
Availability of preoperative vertebral morphometry on chest x-rays (MTRx)
Availability of pituitary function and MRI data
Fasting blood samples collected to measure serum free thyroxine (FT4), free 3,5,3′-triiodothyronine (FT3), thyrotropin (TSH), GH, ACTH and cortisol levels
Availability of information regarding medical history and treatments from the medical records
The exclusion criteria were as follows:
Age <18 years; pregnant or breastfeeding women
Presence of other chronic diseases known to affect BMD, such as renal failure, rheumatoid arthritis, hyperthyroidism, primary hyperparathyroidism, alcoholism, malabsorption syndromes, hyperthyroidism, chronic liver or obstructive pulmonary disease, premature ovarian failure and prolonged immobilization
Contraindicated for MRI
Prior or current use of medications with the potential to induce osteoporosis and fragility fractures during VF assessment
Prior or current medication use of bone-active agents, excluding calcium and vitamin D, during VF assessment
Subclinical or periodic CD
Previous or current medical therapies for CD during VF assessment, such as mifepristone and mitotane
Non-suggestive histological findings of ACTH-secreting adenoma
The control group was retrospectively selected from a population of 98 consecutive patients admitted to the Emergency Department of Xiangya Hospital for non-coronavirus disease-related acute lower respiratory tract infections.
The inclusion criteria for the control group were as follows:
Age range comparable with that of the CD group patients
Availability of information concerning medical history and treatments from the medical records
The exclusion criteria were as follows:
Previous or ongoing treatment with drugs potentially causing osteoporosis and fragility fractures during VF assessment
Previous or current treatment with bone-active drugs, except for calcium and vitamin D, during VF assessment
Known pituitary disorders
History of or risk factors for secondary osteoporosis
Unavailability or low-quality lateral MTRx not suitable for VF assessment
Ongoing oral contraceptive or hormonal replacement therapy
Consuming more than four cups of coffee per day and/or two alcohol-containing beverages per day
The estimated disease duration, body mass index (BMI), systolic blood pressure (SBP), diastolic blood pressure (DBP) and creatinine, low-density lipoprotein cholesterol (LDL-C), triglyceride (TG), high-density lipoprotein cholesterol (HDL-C), total cholesterol, FT3, TSH, FT4, GH, cortisol and ACTH (at 8 am, ACTH at 4 pm, ACTH at 0 am) levels were obtained retrospectively from medical records.
Vertebral fracture assessment
All patients were evaluated for back pain and height changes based on the clinical symptoms of VFs. VF was detected using vertebral morphometry on MTRx, including quantitative and qualitative vertebral morphology assessments. Six points were defined using a translucent digitizer and cursor to describe the shape of each vertebral body. The anterior, middle and posterior vertebral heights of each vertebral body from T5 to T12 were measured, and the height ratios were calculated, specifically the ratios of the anterior to posterior and middle to posterior heights. According to the study by Genant et al. [Citation12], the VF severity was classified as mild, moderate or severe based on the reduction in the height ratio of 20–25%, 25–40% and >40%, respectively. The analyses were conducted by two skilled physicians unaware of the underlying diagnosis. The coefficients of variation for intra-observer and inter-observer agreements ranged between 2% and 5%, depending on the severity of VFs (i.e. mild vs. severe).
All participants provided written informed consent for the use of their clinical, anthropometric and biochemical data and preoperative radiographs. This study was approved by the Ethics Committee of Xiangya Hospital (Changsha, China).
Statistical analyses
Descriptive statistics were used to summarize the continuous variables, and these are reported as means and standard deviations or medians with ranges. Categorical variables are presented as counts and percentages. Categorical data were compared using the chi-square test or Fisher exact test, as appropriate and t-tests were used for continuous data analysis. The t-tests were specifically applied to parameters displaying a normal distribution. The Mann–Whitney U test was used to assess data with an uneven distribution. Binary logistic regression was used for multivariate analysis to investigate the parameters associated with the presence of VFs in the study population. The optimal cut-off point for predicting the presence of VFs was determined using receiver operating characteristic (ROC) curve analysis. The optimal cut-off value for serum cortisol was identified by determining the optimal balance between specificity and sensitivity and significant increases in the likelihood ratios. Statistical significance was set at P < 0.05. Statistical analyses were performed using Statistical Product and Service Solutions, version 25.0, for Windows (Copyright© 2013 IBM SPSS Corp).
Results
CD group vs. control group
Of the 213 patients with CD, 75 fulfilled the inclusion criteria for the CD group. Among the 98 controls, 62 fulfilled the inclusion criteria for the control group. The CD group comprised 35 men and 40 women, with a mean age of 47.22 ± 11.98 years. The control group comprised 28 men and 34 women, with a mean age of 51.65 ± 16.22 years. The CD and control groups did not differ statistically in age (P = 0.32), sex (P = 0.68) or number of menopausal women (18 [45%] vs. 16 [47%]; P = 0.55).
VFs were reported in 44/75 patients (58.7%) of the CD group and 9/62 participants (14.5%) of the control group, showing a significant difference in prevalence (P = 0.001).
CD group
shows the clinical and biochemical parameters of CD patients with and without VFs.
Table 1. Characteristics of patients affected by CD with and without VFs.
Among the CD patients with VFs, 27 (61.4%) showed moderate/severe VFs. No significant difference in VFs was observed between the sexes in the CD group. The CD group patients with morphometric VFs (n = 44) comprised 21 women (47.7%) and 23 men (52.3%; P = 0.380).
The proportion of menopausal women in the CD group did not differ significantly between those with and without VFs (11/21 [52.4%] vs. 7/14 [50%]; P = 0.542).
There were no significant differences in age, BMI and DBP between the CD patients with and without VFs (P > 0.05). However, the SBP was significantly higher in those with VFs than in those without VFs (147.21 ± 17.30 vs. 138.29 ± 16.39 mmHg; P = 0.028). We observed a similarity in the time from diagnosis to surgery between the two subgroups (P = 0.682). Furthermore, CD patients with VFs showed a slightly increased estimated disease duration compared to those without VFs (median [range]: 36 months [12–84 months] vs. 24 months [12–60 months]; P = 0.200).
Laboratory parameters, such as glucose and lipid metabolism indicators (creatinine, TG, HDL-C and LDL-C levels), were similar between the two subgroups (P > 0.05).
Although the cortisol levels at 4 pm and 0 am were higher in CD patients with VFs than in those without VFs, the differences were not statistically significant (P = 0.063 and P = 0.066, respectively). However, the preoperative 4 pm and 0 am ACTH levels were significantly higher in the CD patients with VFs than in those without VFs (P = 0.031 and P = 0.021, respectively).
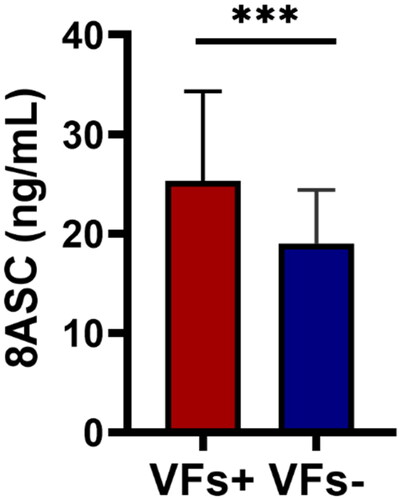
During admission, patients with VFs exhibited higher preoperative 8 am serum cortisol (8ASC) levels than those without VFs (24.87 [18.59–30.83] vs. 18.03 [15.19–22.07] ng/mL; P < 0.001; ).
Figure 2. Preoperative 8ASC levels in CD patients with and without VFs. Red: CD patients with VFs; blue: CD patients without VFs (8ASC, 8 am serum cortisol; CD, Cushing disease; VF, vertebral fracture; ***P < 0.001).
No significant differences were observed in the blood levels of FT3, FT4, TSH and GH between patients with and without VFs (P > 0.05).
In the multivariable logistic regression analysis, the independent predictor associated with VFs was the preoperative 8ASC level at diagnosis (odds ratio, 1.102; 95% confidence interval, 1.010–1.201; P = 0.028; ).
Table 2. Results of logistic regression analysis to predict VFs in patients with CD.
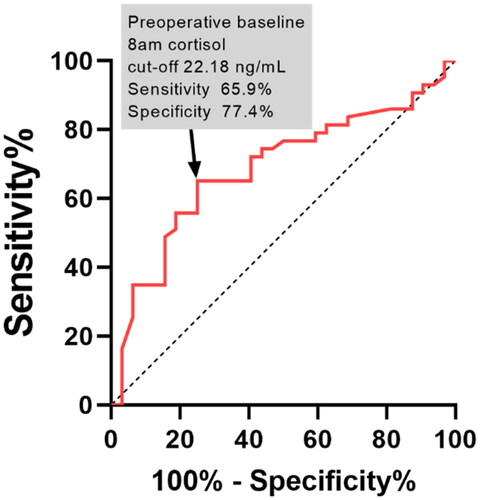
The ROC analysis evaluated the predictive capacity of preoperative 8ASC level for VFs, yielding a cut-off point of 22.18 ng/mL with 77.4% specificity and 65.9% sensitivity. The area under the ROC curve was 80.2% (P = 0.002; ).
Figure 3. ROC curve analysis of the role of preoperative baseline preoperative 8ASC levels in the prediction of VFs. The cut-off point of 22.18 ng/mL for preoperative 8ASC is obtained with 65.9% sensitivity and 77.4% specificity (P < 0.001; 8ASC, 8 am serum cortisol).
Discussion
This cross-sectional case–control study is the first to report a high prevalence of radiological thoracic VFs in a large cohort of patients recently diagnosed with CD. The patients were admitted for TNS surgery within 12 months of diagnosis. Thus, our findings reveal a significant prevalence of VF even in the early stages of the disease.
Clinically, VFs are frequently undiagnosed due to the self-limiting nature of their symptoms such as back pain [Citation13]. Hence, similar to the general population, anamnestic data alone are insufficient to assess VFs in CD patients [Citation14]. Owing to the prevalent decrease in bone quality, fragility fractures can occur in patients with CD, even when they have only a mild reduction in the BMD, regardless of it being in the normal or osteopenic range [Citation2]. Consequently, the incidence of VFs remains under- or misdiagnosed. This represents a notable selection bias that justifies, at least in part, the wide range of the reported frequencies of VFs. It is vital to emphasize that morphometric VFs are not the only radiological findings. Similar to other forms of secondary osteoporosis [Citation15,Citation16], VFs serve as indicators of skeletal fragility and overall general fragility in various clinical contexts, negatively affecting the QoL and prognosis of CD [Citation1]. In recent decades, the morphometric approach has become the gold standard method for diagnosing VFs [Citation9–10]. A recent report proposed a novel approach that combined various available tools, including vertebral morphometry and BMD assessment, to enhance the management, diagnosis and follow-up of bone complications in patients with CD [Citation17].
However, owing to the significant variation in the estimated disease duration among the enrolled patients, establishing a temporal relationship between CD diagnosis and VF occurrence was challenging. Furthermore, there is a lack of robust clinical evidence supporting strong recommendations regarding the timing of VF screening in CD [Citation1]. Therefore, the management of skeletal fragility and VFs in CD remains a significant clinical issue. The reported prevalence of osteoporotic fractures in CD is approximately 50% based on BMD alone, with the vertebrae and ribs being the most commonly affected sites [Citation9]. However, these rates may significantly underestimate the true fracture risk in CD owing to the lack of routine morphometric and radiological assessments, leading to the misdiagnosis of asymptomatic VFs [Citation9]. One study reported that the prevalence of radiological morphometric VFs was 76% in CD patients, with only half of them presenting clinical symptoms [Citation3]. In our study, 58.7% of patients with recently diagnosed CD had VFs, suggesting that VFs may represent early complications during the natural course of CD.
Cortisol induces uncoupling of bone formation (inhibition) and bone resorption (enhancement), resulting in significant skeletal damage and a rapid escalation in the risk of fractures [Citation9]. Several studies have indicated that glucocorticoid excess primarily affects bone turnover [Citation18]. Our data revealed a significant increase in serum cortisol levels, especially 8ASC levels, of CD patients with VFs. Furthermore, the 8ASC levels were predictive of VFs. This finding confirms the significant detrimental effect of excess cortisol on the bone and supports recent data showing that the resolution of postoperative hypercortisolism is associated with improved bone mineralization, reduced bone turnover markers and restoration of their correlation with bone resorption indicators [Citation19].
The diagnostic delay could be substantial, contributing to the maintenance of comorbidities, poor QoL and short life expectancy, even after long-term clearance of excess hormone levels [Citation20,Citation21]. In our study, individuals with VFs exhibited a 1.5-fold longer median presumed disease duration than those without VFs. Although not statistically significant, owing to the expected variability in this approximate estimation (based on subjective recollections), VF risk may be affected by diagnostic delays, especially in patients exhibiting elevated biochemical activity.
To predict VFs, we determined a preoperative 8ASC cut-off value of 22.18 ng/mL, with a specificity of 77.4% and a sensitivity of 65.9% at this threshold. These data further support the hypothesis that VFs are indicators of severe disease during diagnosis. Furthermore, they contribute to the refinement of CD patient profiles and facilitate the comprehensive assessment of bone health upon disease diagnosis. We used MTRx to assess VFs in our study; however, if it is not commonly accessible, morphometry on spine radiographs should be performed according to recent guidelines [Citation1].
This study has some limitations. We were unable to establish a causative relationship between CD and VFs, owing to the retrospective cross-sectional design of our study. The Fracture Risk Assessment Tool score was not calculated because of missing family history data for fragility fractures. Since the illness duration was recorded based on patient memory, we could not determine the exact disease duration. The bone health assessment was incomplete due to the unavailability of DXA scanning and biochemical analysis of bone turnover markers. Although the application of MTRx has been deemed acceptable in assessing vertebral morphometry of individual with pituitary disease [Citation22,Citation23], VFs were assessed using MTRx instead of standard spine radiographs, potentially underestimating the prevalence of VFs due to the exclusion of the lumbar vertebrae. However, several previous studies have shown that most VFs consequent to bone fragility occur at the thoracic spine level in patients with CD (prevalence of thoracic VFs, 77–100%) [Citation3,Citation24,Citation25]. Indeed, MTRx is generally used more frequently than total spine radiography in most patients at the first clinical visit. VF assessment using MTRx (when available) could avoid unnecessary radiation exposure to the patient. MTRx allows for easy, inexpensive and potentially universal screening for VFs in high-risk populations, such as those with CD.
Conclusions
Our study is the first to describe a high prevalence of radiologic VFs in patients recently diagnosed with CD. Preoperative 8ASC concentrations are predictive of VF risk on MTRx. This suggests that VFs are an early event in the natural history of CD. Screening for VFs is essential in CD patients with 8ASC levels >22.18 ng/mL at diagnosis, regardless of the presumed disease duration, age or sex. Detecting VFs during CD diagnosis enables personalized follow-up and bone-protection treatment for patients with the highest risk of subsequent bone fracture.
Author contributions
Heng Sun: conceptualization, methodology, software, visualization, investigation. Chunli Wu and Biao Hu: software. Genqing Xie: writing, review and editing.
Ethical approval
This study was conducted in compliance with the Helsinki Declaration and approved by the Xiangya Hospital Ethics Committee, Xiangya Hospital (Changsha, China).
Consent form
Informed consent was signed by all participants in this study.
Disclosure statement
All of the authors had no personal, financial, commercial or academic conflicts of interest separately.
Data availability statement
All data generated or analysed during this study are included in this published article.
Additional information
Funding
References
- Fleseriu M, Auchus R, Bancos I, et al. Consensus on diagnosis and management of Cushing’s disease: a guideline update. Lancet Diabetes Endocrinol. 2021;9(12):1–7. doi: 10.1016/S2213-8587(21)00235-7.
- Mazziotti G, Frara S, Giustina A. Pituitary diseases and bone. Endocr Rev. 2018;39(4):440–488. doi: 10.1210/er.2018-00005.
- Tauchmanovà L, Pivonello R, Di Somma C, et al. Bone demineralization and vertebral fractures in endogenous cortisol excess: role of disease etiology and gonadal status. J Clin Endocrinol Metab. 2006;91(5):1779–1784. doi: 10.1210/jc.2005-0582.
- Valassi E, Santos A, Yaneva M, et al. The European registry on Cushing’s syndrome: 2-year experience. Baseline demographic and clinical characteristics. Eur J Endocrinol. 2011;165(3):383–392. doi: 10.1530/EJE-11-0272.
- Trementino L, Appolloni G, Ceccoli L, et al. Bone complications in patients with Cushing’s syndrome: looking for clinical, biochemical, and genetic determinants. Osteoporos Int. 2014;25(3):913–921. doi: 10.1007/s00198-013-2520-5.
- Belaya ZE, Hans D, Rozhinskaya LY, et al. The risk factors for fractures and trabecular bone-score value in patients with endogenous Cushing’s syndrome. Arch Osteoporos. 2015;10(1):44. doi: 10.1007/s11657-015-0244-1.
- Mazziotti G, Lania AG, Canalis E. Skeletal disorders associated with the growth hormone-insulin-like growth factor 1 axis. Nat Rev Endocrinol. 2022;18(6):353–365. doi: 10.1038/s41574-022-00649-8.
- Graeff C, Marin F, Petto H, et al. High resolution quantitative computed tomography-based assessment of trabecular microstructure and strength estimates by finite-element analysis of the spine, but not DXA, reflects vertebral fracture status in men with glucocorticoid-induced osteoporosis. Bone. 2013;52(2):568–577. doi: 10.1016/j.bone.2012.10.036.
- Frara S, Allora A, di Filippo L, et al. Osteopathy in mild adrenal Cushing’s syndrome and Cushing disease. Best Pract Res Clin Endocrinol Metab. 2021;35(2):101515. doi: 10.1016/j.beem.2021.101515.
- Griffith JF, Genant HK. New advances in imaging osteoporosis and its complications. Endocrine. 2012;42(1):39–51. doi: 10.1007/s12020-012-9691-2.
- Nieman LK, Biller BM, Findling JW, et al. The diagnosis of Cushing’s syndrome: an endocrine society clinical practice guideline. J Clin Endocrinol Metab. 2008;93(5):1526–1540. doi: 10.1210/jc.2008-0125.
- Genant HK, Wu CY, van Kuijk C, et al. Vertebral fracture assessment using a semiquantitative technique. J Bone Miner Res. 1993;8(9):1137–1148. doi: 10.1002/jbmr.5650080915.
- Canalis E, Giustina A, Bilezikian JP. Mechanisms of anabolic therapies for osteoporosis. N Engl J Med. 2007;357(9):905–916. doi: 10.1056/NEJMra067395.
- Mancini T, Mazziotti G, Doga M, et al. Vertebral fractures in males with type 2 diabetes treated with rosiglitazone. Bone. 2009;45(4):784–788. doi: 10.1016/j.bone.2009.06.006.
- Formenti AM, Dalla Volta A, di Filippo L, et al. Effects of medical treatment of prostate cancer on bone health. Trends Endocrinol Metab. 2021;32(3):135–158. doi: 10.1016/j.tem.2020.12.004.
- di Filippo L, Formenti AM, Doga M, et al. Radiological thoracic vertebral fractures are highly prevalent in COVID-19 and predict disease outcomes. J Clin Endocrinol Metab. 2021;106(2):e602–e614. doi: 10.1210/clinem/dgaa738.
- Frara S, di Filippo L, Doga M, et al. Novel approaches to bone comorbidity in Cushing’s disease: an update. Pituitary. 2022;25(5):754–759. doi: 10.1007/s11102-022-01252-w.
- Athimulam S, Delivanis D, Thomas M, et al. The impact of mild autonomous cortisol secretion on bone turnover markers. J Clin Endocrinol Metab. 2020;105(5):1469–1477. doi: 10.1210/clinem/dgaa120.
- Szappanos A, Toke J, Lippai D, et al. Bone turnover in patients with endogenous Cushing’s syndrome before and after successful treatment. Osteoporos Int. 2010;21(4):637–645. doi: 10.1007/s00198-009-0978-y.
- Webb SM, Valassi E. Morbidity of Cushing’s syndrome and impact of treatment. Endocrinol Metab Clin North Am. 2018;47(2):299–311. doi: 10.1016/j.ecl.2018.01.001.
- Rubinstein G, Osswald A, Hoster E, et al. Time to diagnosis in Cushing’s syndrome: a meta-analysis based on 5367 patients. J Clin Endocrinol Metab. 2020;105(3):e12–e22. doi: 10.1210/clinem/dgz136.
- Frara S, Melin Uygur M, di Filippo L, et al. High prevalence of vertebral fractures associated with preoperative GH levels in patients with recent diagnosis of acromegaly. J Clin Endocrinol Metab. 2022;107(7):e2843–e2850. doi: 10.1210/clinem/dgac183.
- Frara S, Losa M, Doga M, et al. High prevalence of radiological vertebral fractures in patients with TSH-secreting pituitary adenoma [published correction appears in J Endocr Soc. 2018 Dec 28;3(2):358]. J Endocr Soc. 2018;2(9):1089–1099. doi: 10.1210/js.2018-00091.
- Vestergaard P, Lindholm J, Jørgensen JO, et al. Increased risk of osteoporotic fractures in patients with Cushing’s syndrome. Eur J Endocrinol. 2002;146(1):51–56. doi: 10.1530/eje.0.1460051.
- Apaydın T, Yavuz DG. Assessment of non-traumatic vertebral fractures in Cushing’s syndrome patients. J Endocrinol Invest. 2021;44(8):1767–1773. doi: 10.1007/s40618-020-01496-y.