
Abstract
Background
We aimed to assess differences in intestinal microflora between patients with operable hepatitis B virus-related hepatocellular carcinoma (HBV-HCC) with microvascular invasion (MVI) and those without MVI. Additionally, we investigated the potential of the microbiome as a non-invasive biomarker for patients with MVI.
Methods
We analyzed the preoperative gut microbiomes (GMs) of two groups, the MVI (n = 46) and non-MVI (n = 56) groups, using 16S ribosomal RNA gene sequencing data. At the operational taxonomic unit level, we employed random forest models to predict MVI risk and validated the results in independent validation cohorts [MVI group (n = 17) and non-MVI group (n = 15)].
Results
β diversity analysis, utilizing weighted UniFrac distances, revealed a significant difference between the MVI and non-MVI groups, as indicated by non-metric multidimensional scaling and principal coordinate analysis. We also observed a significant correlation between the characteristic intestinal microbial communities at the genus level and their main functions. Nine optimal microbial markers were identified, with an area under the curve of 79.76% between 46 MVI and 56 non-MVI samples and 79.80% in the independent verification group.
Conclusion
This pioneering analysis of the GM in patients with operable HBV-HCC with and without MVI opens new avenues for treating HBV-HCC with MVI. We successfully established a diagnostic model and independently verified microbial markers for patients with MVI. As preoperative targeted biomarkers, GM holds potential as a non-invasive tool for patients with HBV-HCC with MVI.
Introduction
Hepatocellular carcinoma (HCC) is a major health concern, ranking as the third leading cause of cancer-related deaths worldwide. Its incidence, notably in China [Citation1], has been steadily increasing. HCC primarily arises from chronic liver diseases and is closely associated with hepatitis B or C viral infections and cirrhosis, particularly hepatitis B virus (HBV) infection in China [Citation2]. Various treatment modalities, including hepatectomy, liver transplantation, transcatheter arterial chemoembolization, radiotherapy, and ablation, have been deployed to address HCC at different stages, aiming for curative or palliative care [Citation3]. Nevertheless, advanced cases often display limited responsiveness to treatments such as tyrosine kinase and immune checkpoint inhibitors [Citation4]. Despite the variety of treatment options available for liver cancer, hepatectomy remains the most commonly used and effective option [Citation5], Owing to advances in perioperative management and surgical techniques, the mortality rate and complications after post-hepatectomy liver cancer patients have greatly decreased [Citation6]. However, early postoperative recurrence and metastasis rates hamper treatment outcomes [Citation7]. Recent insights into microvascular invasion (MVI) have provided a deeper understanding of local invasion, distant metastasis, and postoperative recurrence in liver cancer. MVI is an independent risk factor for tumor recurrence following hepatectomy in patients with HCC [Citation8]. Patients exhibiting recurrent HCC with MVI at initial first resection typically experience poorer survival rates [Citation9], necessitating wider resection margins for curative surgery when MVI is present [Citation10]. MVI is conventionally identified through pathological examination of surgical specimens, occurring in 15–60% of resected HCC samples [Citation11]. Preoperatively predicting MVI could facilitate more tailored surgical strategies and reduce postoperative tumor recurrence [Citation10]. Recently, there has been increasing evidence indicating the possibility of accurate and specific preoperative prediction of MVI. Despite ongoing efforts, current clinical parameters, serological markers, and predictive models fall short of a good assessing the preoperative risk of MVI in patients with HCC [Citation12,Citation13]. However, predicting MVI to establish a precise hepatectomy range before surgery remains challenging, and new methods are needed to overcome this.
The gut microbiome (GM), often dubbed the ‘hidden organ’, plays a crucial role in human health and has garnered considerable interest in recent years [Citation14]. The GM strongly influences the metabolic, endocrine, and immune systems, both locally at the mucosal level and systemically at the host level [Citation15]. The dysregulation of GM has been implicated in various diseases, including mental illness [Citation16], type 2 diabetes [Citation17], lung cancer [Citation18], and colorectal cancer [Citation19], while GM signatures have exciting diagnostic potential [Citation18]. The liver’s role in metabolism has prompted research into the interaction between GM and liver diseases. The GM plays a significant role in liver damage initiation and progression [Citation20]. For example, the step-up abundance of Bacteroides, Prevotella, and ethanol-producing GM and their detrimental metabolites in nonalcoholic fatty liver disease (NAFLD) can induce liver inflammation by furnishing toll-like receptor ligands and changing lipid metabolic pathways [Citation21]. Chronic hepatitis B can cause advanced liver fibrosis, cirrhosis, and HCC, concurrently dysregulating the GM and reducing its diversity [Citation22]. Bacteroides, Proteus, and Sclerotinia are the characteristic GM genera at the onset of hepatitis B. With disease progression (from hepatitis B to liver fibrosis/cirrhosis), the abundance of butyrate-producing bacterial families (Lachnospiraceae and Ruminococcaceae) decreases, which facilitates the permeability of the intestinal walls and the gut-liver axis, converting some bacteria from beneficial to pathogenic [Citation23,Citation24]. These facts further confirm a close correlation between the GM and the liver. Oh et al. conducted an external validation study on a characteristic GM using a cohort of three relatives with NAFLD-cirrhosis. They employed a random forest model to predict the diagnosis of liver cirrhosis and obtained favorable results [Citation25]. Furthermore, Zheng et al. discovered that the intestinal microbiota can influence various metabolic pathways, potentially expediting the progression of the disease and serving as superior non-invasive biological diagnostic markers for HCC [Citation26]. Nonetheless, to date, there have been no reports on the gut microbial characteristics in clinical patients with HCC and MVI.
In this study, we aimed to compare the intestinal microflora of patients with operable hepatitis B virus-related hepatocellular carcinoma (HBV-HCC) with and without MVI. Additionally, we aimed to examine the characteristics and functions of the intestinal microflora and evaluate GM’s potential as a non-invasive biomarker for patients with MVI. This study involved a discovery cohort comprising 46 HCC patients with MVI and 56 without. Using 16S rRNA gene sequencing analysis, we delineated the microbial spectrum of HCC patients with MVI, constructed a prediction model, and identified a specific microbiome signature with potential as a non-invasive biomarker for HCC patients with MVI.
Materials and methods
Study design
Patients diagnosed with HBV-HCC, both with and without MVI, underwent hepatectomy at the Department of Hepatobiliary Surgery, Guangxi Medical University Cancer Hospital (Nanning, China). Pre-operative faecal stool samples were collected during two periods: from September 2020 to August 2021 for the development cohort (MVI group = 46, non-MVI group = 56) and from September 2021 to December 2021 for the validation cohort (MVI group = 17, non-MVI group = 15). The diagnosis of MVI was based on postoperative pathological sections. Our study included patients who were diagnosed with primary liver cancer for the first time and who had not received any antitumor treatment before surgery (specifically no immunosuppressive regimen, These patients were only surgically treated with their tumors before this outcome). None of the participants had a history of drug allergies, asthma, alcohol addiction, nonalcoholic fatty liver disease, chronic infectious diseases, gastrointestinal disease, inflammatory bowel diseases, diabetes, or malignant tumors other than those in the liver. Additionally, participants refrained from consuming acid suppressants, pro-gastrointestinal prokinetic agents, probiotics, or antibiotics for at least four weeks before surgery. Prophylactic antibiotics were administered after surgery for a duration of 48 h and based on the same initial timing. All aspects of the study were conducted consistently. Clinical data, including age, sex, BMI, WBC count, platelet count, total bilirubin level, albumin level, prealbumin level, alanine aminotransferase level, aspartate aminotransferase level, HbsAg status, hepatitis B virus DNA level, INR, serum AFP level, γ-glutamyl transpeptidase level, neutrophil-to-lymphocyte ratio, liver cirrhosis Child–Pugh grade, 15-min ICG retention rate (ICG-R15), China liver cancer (CNLC) stage, Barcelona Clinic Liver Cancer (BCLC) stage, CT tumor size before the operation, tumor number, presence of portal hypertension, presence of an envelope or intact envelope, and Ki67 cellular index, were collected. Fecal samples were collected 1 day before surgery and immediately stored at −80 °C.
DNA extraction and 16S rRNA gene amplicon sequencing
DNA from fecal samples was extracted utilizing cetyltrimethylammonium bromide for bacterial DNA detection and library construction. The V3-V4 region of the 16S rRNA gene of the small bacterial subunit was amplified using the primer pair 341 F (5′-CCTAYGGGRBGCASCAG-3′)/806R (5′-GACTACHVGGGTATCTAATCC-3′) and the universal sequence. The amplicon libraries were constructed using TruSeq DNA amplicon libraries (Thermo Fisher Scientific, Waltham, MA, USA) and the TruSeq DNA PCR-Free Sample Preparation kit (Illumina, San Diego, CA, USA). Library quality was assessed using a Qubit 2.0 Fluorometer (Thermo Fisher Scientific) and an Agilent Bioanalyzer 2100 system (Agilent, Santa Clara, CA, USA). Sequencing was performed using Illumina Novaseq 6000.
16S rRNA data analysis
Analysis was conducted on a quality-filtered dataset using FLASH (version 1.2.7) and QIIME (version 1.9.1) with the original FASTQ files [Citation27,Citation28]. Operational taxonomic units (OTUs) were defined at 97% sequence similarity using an algorithm and taxonomic annotation at a confidence threshold of 80% [Citation29]. Normalized abundance data of OTUs at various taxonomic levels (phylum, class, order, family, genus, and species) were used for α- and β-diversity and abundance analyses. Analysis of similarity (AMOVA) with weighted UniFrac and unweighted UniFrac formulae was used to assess differences in bacterial composition. Linear discriminant analysis effect size (LEfSe) identified differentially represented biomarkers between the MVI and non-MVI groups. PICRUSt2 was used to predict metabolic pathways based on the Kyoto Encyclopedia of Genes and Genomes database from Integrated Microbial Genome (IMG) data [Citation30].
OTU biomarker identification and model construction
In this phase, we applied a standardized procedure known as counts per million (CPM) [Citation31] to preprocess the absolute OTU matrix, akin to the approach used in single-cell expression profiling. The process involved the following steps: i) aggregating the expression levels of each OTU in the original OTU count matrix, followed by dividing 10,000 by the sum of the expression of each OTU to derive a scale factor vector for each OTU ii) employing these scaling factors to smooth the original expression spectrum using the log1p function, rendering the data more compliant with a Gaussian distribution; iii) After data preprocessing, the standardized OTU expression profiles obtained were used for subsequent feature screening. We conducted three feature screenings using the Boruta method [Citation32] and identified the feature OTUs considered effective across all three screenings. Based on the feature OTU expression profiles from the training set, we employed 10-fold cross-validation for model construction and training evaluation. We applied the SMOTE [Citation33] algorithm to address sample distribution imbalances during training. The performance of the constructed biomarkers and effectiveness of the models were evaluated using receiver operating characteristic (ROC) curves.
Statistical analysis
The preoperative routine demographic and clinical characteristics were compared between the MVI and non-MVI groups using R software version 4.1.2. Measurement data adhering to a normal distribution were presented as median (P25, P75) and compared using the Wilcoxon rank-sum test. Categorical data were presented as case numbers (percentages) and compared using the Chi-square test or Fisher’s exact probability method. Statistical significance was defined as p < 0.05 (two-sided).
α-diversity was assessed using QIIME (version 1.9), while β-diversity non-metric multidimensional scaling (NMDS) and principal coordinate analysis (PCoA) were performed using R software (version 2.15.3) with the ‘WGCNA’, ‘PCoA’, ‘stats’, ‘ggplot2’, and ‘vegan’ packages. LEfSe software was employed with an LDA score threshold of 3. The Wilcoxon rank-sum test was used to identify differences in microflora. Heat map analysis was performed to reveal correlations between differential GM and function. The area under the ROC curve (AUC) was used to represent the ROC effect. The evaluation indicators were calculated using the MLeval (v0.3) R package.
Results
Baseline clinical characteristics
To investigate the potential association between GM changes and MVI, we conducted 16S rRNA gene sequencing using samples from a Chinese cohort, serving as the ‘discovery cohort’, consisting of 46 patients with MVI and 56 non-MVI participants. For validation, we recruited an independent cohort of 17 patients with MVI and 15 patients without MVI (the ‘validation cohort’). The clinical manifestations and demographic characteristics of the discovery cohort are detailed in . Among all the parameters between the MVI and non-MVI groups, statistically significant differences were observed in albumin level, platelet-to-lymphocyte ratio, γ-glutamyltransferase level, T-helper/T-suppressor ratio, CT tumor size, and Ki67 cellular index. Except for the aspartate aminotransferase level, none of the other indices in the validation cohort showed significant differences (Table S1).
Table 1. Baseline characteristics of the discovery cohort.
OTUs and α- and β-diversity
OTUs represent different microbial taxa, with a 97% identity in rRNA sequences used as a cutoff for defining OTUs. Overall, 5,747 OTUs were identified from the discovery cohort, of which 2,024 OTUs were shared between the MVI and non-MVI groups (). Furthermore, both the Shannon and Simpson indices () and the Ace and Chao1 indices (Figure S1) were comparable between the two groups, indicating similar levels of α-diversity between the groups. Using weighted UniFrac distances and unweighted UniFrac distances, we employed β-diversity for NMDS and PCoA (). The NMDS (weighted UniFrac distance stress = 0.105 and unweighted UniFrac distance stress = 0.140) revealed significant compositional and abundance differences in the microbiomes between the MVI and non-MVI groups based on the PCoA and AMOVA tests using weighted UniFrac (p = 0.003). However, unweighted UniFrac (p = 0.219) showed no statistical differences. Our results demonstrate that the composition of GM differs between HBV-HCC patients with and without MVI.
Figure 1. Identification of gut microbe using metagenomics analysis. (A) Venn diagrams show the common OTUs among MVI Group and non-MVI Group. (B) MVI Group and non-MVI Group comparison of α-diversity using shannon and simpson. *, 0.01<p ≤ 0.05. OTUs: operational taxonomic units; MVI Group: microvascular invasion Group; non-MVI Group: non-microvascular invasion Group.
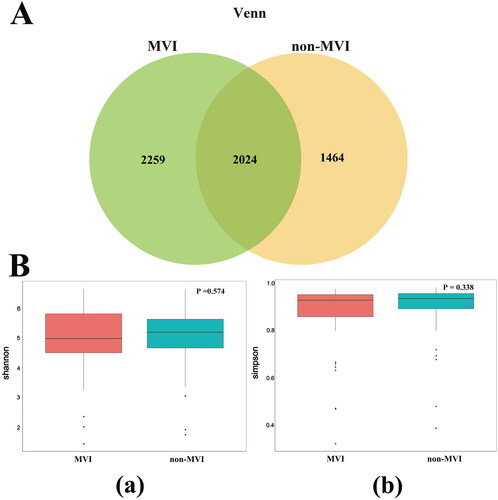
Figure 2. β-diversity analysis and relative abundance of the top 10 gut microbiome among groups MVI and non-MVI. (A) β-diversity analysis.(a)NMDS plot based on weighted UniFrac distances (b)NMDS plot based on unweighted UniFrac distances.(c)PCoA plot based on weighted UniFrac distances, (d)PCoA based on unweighted UniFrac distances. NMDS, non-metric multidimensional scaling; PCoA, primary coordinate analysis; stress values <0.2 were considered good after dimensionality reduction. p < 0.05 is statistically significant.(B)Relative abundance of the top 10 gut microbiome among groups MVI and non-MVI at genus level. MVI Group: microvascular invasion Group; non-MVI Group: non-microvascular invasion Group.

Specific gut microbiome signature in MVI and non-MVI patients
We examined the abundance of the top 10 dominant core taxa at the phylum, class, order, family, genus, and species levels in the discovery cohort between the MVI and non-MVI groups (Figure S2 and ). In terms of phylum abundance, Firmicutes (62.83% and 48.09%, respectively) was significantly less abundant in the MVI group than in the non-MVI group, while Proteobacteria (26.22%) and Bacteroidota (19.17%) were more abundant in the MVI group. At the class level, the dominant bacteria in the MVI and non-MVI groups were Clostridia (37.23% and 52.69%, respectively), Gammaproteobacteria (25.99% and 19.87%, respectively), and Bacteroidia (19.16% and 12.58%, respectively). At the order level, a downward trend was observed in the abundance of Lachnospirales (20.18%) and Oscillospirales (12.27%). In contrast, the abundance of Pseudomonadales (11.34%), Bacteroidales (19.12%), and Enterobacterales (14.26%) showed an upward trend in the MVI group. At the order and family levels, the dominant bacteria in the MVI and non-MVI groups were identical, with some proportional differences. Moreover, the 10 most abundant genera in the MVI and non-MVI groups were Pseudomonas (11.32% and 6.63%, respectively), Prevotella_9 (4.25% and 1.76%, respectively), Escherichia-Shigella (10.30% and 9.54%, respectively), Bacteroides (12.01% and 8.08%, respectively), Enterococcus (0.98% and 1.50%, respectively), Blautia (7.01% and 11.56%, respectively), Faecalibacterium (5.72% and 10.40%, respectively), Megamonas (1.25% and 0.18%, respectively), Subdoligranulum (2.78% and 2.31%, respectively), and Fusobacterium (1.60% and 0.56%, respectively). At the species level, the abundance of Faecalibacterium prausnitzii was considerably decreased; however, the levels of Bacteroides vulgatus and Fusobacterium mortiferum increased.
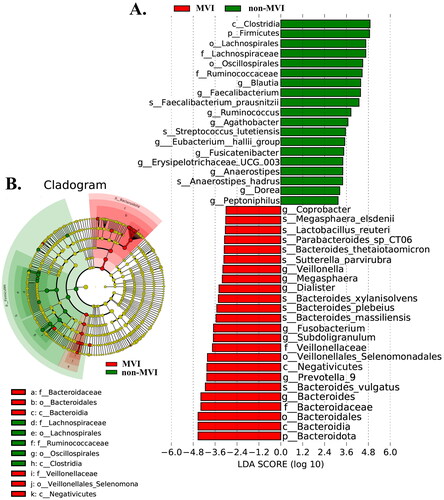
The analysis of the LEfSe data revealed a significant difference between the gut microbiota of the MVI and non-MVI groups. In total, one phylum, eight genera, and nine species were significantly enriched in patients with MVI, while one phylum, ten genera, and three species were significantly enriched in non-MVI patients. At the genus level, the relative abundance of Blautia, Faecalibacterium, Ruminococcus, Agathobacter, [Eubacterium]_hallii_group, Fusicatenibacter, Erysipelotrichaceae_UCG-003, Anaerostipes, Dorea, and Peptoniphilus was highly enriched in the non-MVI group compared with that in the MVI group. Conversely, the MVI group showed higher relative abundances of Coprobacter, Veillonella, Megasphaera, Dialister, Fusobacterium, Subdoligranulum, Prevotella_9, and Bacteroides (abundance < 0.0001) than did the non-MVI group ().
Figure 3. Bacterial taxa that best characterize the groups were identified by using LDA of effect size (LEfSe) on OTU tables among MVI Group vs. non-MVI Group. (A) The bar plot based on the LDA selection. (B) Cladogram representing the taxonomic hierarchical structure. LDA: linear discriminant analysis; OTUs: operational taxonomic units; MVI Group: microvascular invasion Group; non-MVI Group: non-microvascular invasion Group.
Gut microbiota functional signatures
We performed PICRUST2 analysis to predict and test for differences in the KEGG pathways between the MVI and non-MVI groups. Our analysis identified 142 pathways related to the differential gut microbiota at the genus level (). We observed that 65 pathways increased, while 77 decreased in the MVI group (). Branched-chain amino acid (BCAA) metabolism, essential and non-essential amino acid metabolism generally decreased in the MVI group. Additionally, several pathways such as the guanosine and adenosine deoxyribonucleotide de novo biosynthesis pathway, purine and pyrimidine deoxyribonucleoside degradation pathways, 5-aminoimidazole ribonucleoside degradation pathway, purine ribonucleoside degradation, adenosine nucleotides de novo biosynthesis, glycogen degradation pathway, rhamnose biosynthesis pathway, galactose degradation pathway, peptidoglycan biosynthesis pathway, and lactate relative pathway were the main pathways that decreased in the MVI group. However, there was mainly a negative correlation between the characteristic flora of the MVI group and these pathways and a significant positive correlation between these pathways and the characteristic flora of the non-MVI group.
Figure 4. The function of gut microbiome. (A) Functional alteration caused by gut microbiome change through PICRUST2 prediction in MVI Group versus non-MVI Group.(B)correlation between genera and functional modules in MVI Group versus non-MVI Group. The heatmap panel shows the spearman correlation coefficient between the genera and functional modules. Significance levels are expressed as follows: *, 0.01<p ≤ 0.05; **, 0.001<p ≤ 0.01; ***, p ≤ 0.001. MVI Group: microvascular invasion Group; non-MVI Group: non-microvascular invasion Group.
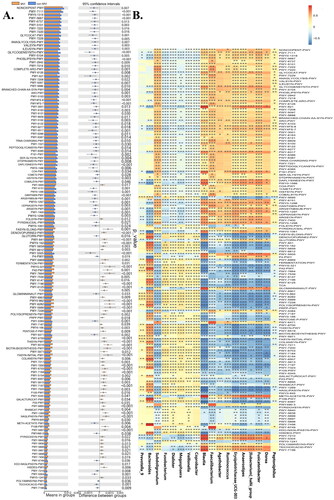
Table 2. Functional alteration caused by microbial change through PICRUSt2 analysis.
The pathways related to pyrimidine ribonucleotides and pyrimidine deoxyribonucleoside de novo synthesis and salvage, guanosine and purine nucleotides de novo biosynthesis, tetrahydrofolate biosynthesis pathway, fatty acid metabolism, oleate biosynthesis, palmitoleate biosynthesis, stearate biosynthesis, lipid biosynthesis, and L-rhamnose degradation pathways were markedly increased in the MVI group but decreased in the non-MVI group. These results showed that the significantly enriched characteristic flora of the MVI group was mostly positively linked to the pathways described above. In contrast, the characteristic flora in the non-MVI group showed a negative correlation with these pathways. The data from this study suggest that MVI development may be accompanied by potentially interesting metabolic reprogramming in GM.
Identification of GM signature for MVI prediction
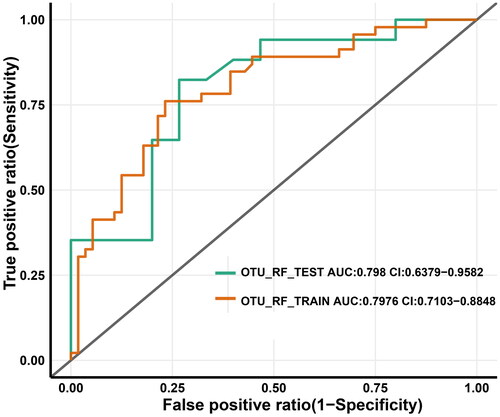
We developed an approach based on reference biomarkers to construct a clinical index for early diagnosis using either sequencing or real-time quantitative PCR. To accomplish this, we first identified the characteristic reference OTUs associated with the MVI (n = 46) and non-MVI (n = 56) groups (OTU markers shown in ). Using preprocessed data and the Boruta method, we obtained nine characteristic OTUs. Subsequently, we used 10-fold cross-validation for performance assessment and trained the optimal random forest machine (RF) model to predict the MVI status (). The consistency rate (classification accuracy) and false negative rate (FNR) were both considered during the selection process to keep error rates low for predicting diseased individuals. We emphasized the confidence interval of AUC relative minimization, which more accurately predicted the MVI status in the discovery cohort (sensitivity = 76.09%, specificity = 76.79%, consistency rate = 76.47%, FNR = 23.91%, AUC = 79.76%).
Table 3. Nine OTU-based markers.
Table 4A. Table showing the prediction performance of random forest machine models using characteristic OTUs (in columns) methods in the discovery cohort.
Table 4B. Table showing the prediction performance of random forest machine models using characteristic OTUs (in columns) methods in the validation cohort.
The validation cohort was used as an independent test to determine whether the markers of the discovery cohort were generalizable to other samples with high predictive power (sensitivity = 76.09%, specificity = 76.79%, consistency rate = 76.47%, FNR = 17.65%, and AUC = 79.80%) (). These results provide evidence that our approach can distinguish between MVI and non-MVI status in individuals with HBV-HCC.
Figure 5. OTU-based diagnostic biomarkers for HBV-HCC with MVI. Receiver operating characteristic (ROC) curves of prediction efficacy for the OTU-based predictors using RF. OTUs: operational taxonomic units; HBV-HCC: hepatitis B virus -related hepatocellular carcinoma; MVI: microvascular invasion; red line and green lines indicated the discovery (MVI Group = 46, non-MVI Group = 56) and validation (MVI Group = 17, non-MVI Group = 15) cohorts, respectively.
Discussion
The presence of MVI, a form of intrahepatic metastasis in HCC, significantly contributes to the poor prognosis of this disease [Citation34]. It is well-established that intrahepatic metastasis is closely related to postoperative recurrence after HCC resection, which is a major obstacle to long-term survival [Citation35]. While a growing body of evidence highlights the link between GM and various liver conditions, the specific differences in GM between the MVI and non-MVI patients with HCC and their implications, particularly in predicting the risk of microtumor thrombus before surgery, have remained largely unexplored.
Our study illuminates distinct GM alterations in HBV-HCC patients with and without MVI, shedding light on potential microbial candidates that may be attributed to the development of MVI. Importantly, we introduce an innovative diagnostic model for HBV-HCC complicated by MVI, leveraging microbial OTU markers, which were independently verified.
Intriguingly, our α- and β-diversity analyses revealed that the gut microbial species in HBV-HCC patients with MVI did not differ significantly from those in patients without MVI. Instead, variations in microbial abundances at different levels were pronounced, indicating an imbalance in the GM between MVI status and non-MVI status. These differences primarily impacted microbial relative abundance rather than overall community diversity. Weighted UniFrac quantitatively detected further evolved variations between samples with different lineages [Citation36]. Studies have shown that the variation in GM abundance is related to host genetic, etiological, and environmental factors [Citation37]. Additionally, due to continuous evolution, primary tumors exhibit different intra-tumor heterogeneities through different subclonal manifestations. These lineages may have differentiated many generations ago. There is evidence that the evolution of different lineages is related to tumor heterogeneity and that different subclones may lead to different outcomes [Citation38,Citation39]. Tumors are populations that have undergone continuous evolution of cellular heterogeneity and interrelated genetic factors, and GM has also experienced little-known evolutionary trees, pedigree changes, genetic factors, and other significant influences [Citation40]. Growing evidence also suggests that differences in preoperative flora abundance between the MVI and non-MVI states indicate that patients with different tumor subclones may have varying effects on flora, potentially influencing the prognosis of patients undergoing surgery.
Our study identified specific alterations among the top 10 abundant GM taxa, primarily at the genus level in pre-surgery MVI and non-MVI patients. This level of analysis provides a more precise reflection of species differences within the 16S rRNA gene [Citation41]. Employing LEFSe, our findings pinpointed 17 characteristic differences in genus abundance between MVI and non-MVI patients (including Blautia, Faecalibacterium, Ruminococcus, Agathobacter, [Eubacterium]_hallii_group, Fusicatenibacter, Erysipelotrichaceae_UCG-003, Anaerostipes, Dorea, and Peptoniphilus in non-MVI, and Coprobacter, Veillonella, Megasphaera, Dialister, Fusobacterium, Subdoligranulum, Prevotella_9, and Bacteroides in MVI).
Zhang et al. [Citation42] identified the enrichment of Prevotella_9, Bacteroides, Megasphaera, and Veillonella in lung tumor tissues, suggesting their potential as invasion indicators. The abundance of Dialister in the gastric mucosa of patients with gastric cancer is higher than that of precancerous individuals, which is related to the progression of the disease [Citation43]. Fusobacterium and Subdoligranulum promote inflammation [Citation44,Citation45]. Additionally, Coprobacter is associated with intestinal barrier and inflammation promotion [Citation46], while Blautia induces regulatory T cell proliferation, which may help limit inflammation [Citation47]. Faecalibacterium and Ruminococcus can induce the synthesis of anti-inflammatory regulatory T-cells [Citation48]. Agathobacter is more associated with lymph node metastasis in colorectal cancer [Citation49]. Microbes related to butyrate production ([Eubacterium]_hallii_group, Dorea, and Anaerostipes) are enriched in patients with rectal cancer who benefited from neoadjuvant chemotherapy and play a protective role in the host body [Citation50]. The prognosis of older patients with liver cancer is significantly better than that of young patients, while the significant enrichment of Fusicatenibacter and Erysipelotrichaceae_UCG-003 in the intestinal bacteria of older patients is negatively correlated with strong tumor proliferation and metastasis [Citation51]. The abundance of Peptoniphilus is higher in the advanced stages of endometrial carcinoma than in the early stages [Citation52]. Thus, we argue that certain characteristic bacterial genera may play key roles in the MVI and non-MVI status of HBV-HCC.
Our PICRUST2 analysis showed significant differences in the microbiome functional abundance between the MVI and non-MVI groups, particularly in core functions. The relationship between these differential functions and signature bacteria in both states underscores their potential significance. Interestingly, many metabolic function modules exhibited opposing trends in the MVI and non-MVI patients. This reciprocal regulation among metabolic reprogramming-induced cancer cell metabolism, the host immune system, and GM is vital for regulating cancer progression, including malignant progression and the proliferation change of cancer cells [Citation53,Citation54]. A previous study reported that BCAAs induce cell cycle arrest, leading to apoptosis in HCC cells [Citation55]. Furthermore, the inhibition of tumor cell proliferation can also be accomplished by inducing apoptosis in tumor cells [Citation56].
Research has shown that asparagine and aspartic acid can be interconverted, similar to glutamic acid and glutamine. Essential amino acids, including threonine, lysine, and histidine, are synthesized from aspartate. Additionally, aspartic acid-related enzymes regulate amino acid metabolism by coordinating the uptake of non-essential amino acids such as arginine and serine [Citation57]. Therefore, aspartic acid may act as a bridge in amino acid metabolism. In contrast, asparagine inhibits apoptosis and has potential anti-proliferative activity in tumor cells [Citation58]. However, our study found that the metabolism of these amino acids decreased in the MVI group and became active in the non-MVI group. The characteristic bacterial genera in the MVI group showed an almost negative correlation with the metabolism of these amino acids, whereas the non-MVI group showed the opposite trend. These findings suggest that multiple amino acids are needed for cancer cell growth and distant metastasis, and depleting certain amino acid sources may be a possible therapeutic method for preventing recurrence or metastasis [Citation57]. Deoxyribonucleotides and ribonucleotides can interconvert via a central pathway, and an increase in the de novo anabolic metabolism of pyrimidine DNA can result in significant functions of genes that promote cancer cell proliferation [Citation59]. Additionally, tumor cells rely on the pyrimidine deoxyribonucleic acid or pyrimidine ribonucleoside salvage pathway for proliferation; thus, inhibiting this pathway can reduce tumor growth [Citation60]. Tumor activation can fulfill the needs of highly proliferative cells by increasing the contribution of nucleotides to the purine biosynthesis pathway [Citation61]. Research has shown that accelerated tumor growth exhibits an increased dependency on de novo guanosine nucleotide biosynthesis [Citation62]. A study revealed that serine is the main precursor of purine nucleotide biosynthesis, and the depletion of purine deoxyribonucleotides may be the effect of serine reduction, which is negatively related to tumor proliferation to some extent. Moreover, purine deoxynucleosides have been found to inhibit tumor proliferation [Citation57,Citation63]. Similarly, most studies suggest that tumor cell proliferation is inhibited by 5-aminoimidazole ribonucleotides, which can inhibit the growth of various cancer cells (such as prostate cancer) in vitro through AMPK activation [Citation64,Citation65]. The role of adenosine in regulating human inflammation is complex and involves both pro-inflammatory and anti-inflammatory functions [Citation66]. One of the hallmarks of cancer is inflammation, which results in the exhaustion of immune cells, leading to tumor immune escape and progression [Citation67]. Under certain conditions, adenosine can protect cells against injury and inhibit inflammation [Citation68]. Based on these findings, purine and pyrimidine nucleotides can be considered critical regulators of both the direct and indirect pro-metastatic potential of tumor cells, which is consistent with the results of our study. High proliferation of tumor cells can be maintained through fat metabolism and accompanied by a hypoxic environment, which can also promote tumor progression. In hepatoma cells, disruption of the Akt/mTOR signaling pathway reduces fatty acid synthesis and upregulates peroxisome proliferator-activated receptor α, thereby increasing hepatoma cell proliferation and metastatic tumor formation in cell lines and mouse models [Citation69]. Palmitic acid causes epigenetic changes in cancer cells, leading to tumor recurrence. Palmitic acid has been shown to promote tumor metastasis in cancer studies, and it does not need to be ingested over a long period to have this adverse effect [Citation70]. Palmitic acid can be further converted to palmitoleic acid [Citation71], which can elongate into oleate acid and stearic acid [Citation72]. Our results suggest that several metabolic enhancements related to fat metabolism can promote tumor migration.
Research has indicated that the inhibition of dihydrofolate reductase results in the depletion of intracellular tetrahydrofolate, limiting thymidylate synthesis and resulting in apoptosis or autophagy of highly proliferative cells [Citation73]. The metabolic reprogramming of tumor initiation involves cancer cells absorbing glucose and storing it intracellularly as energy in the form of glycogen, which accumulates and inhibits the Hippo signaling pathway through liquid-liquid phase separation, activating downstream proto-oncoprotein YAP and driving tumor initiation and invasion [Citation74]. Zhuang et al. found that rhamnose lectins exist on the surface of some tumor cells, which can bind rhamnose specifically, and glycation modification of antitumor drugs can enhance the targeting of drugs and reduce the damage to normal cells [Citation75]. Galectins also play a key role in tumor progression and metastasis by interfering with certain mechanisms [Citation76]. An increase in lysine-synthesizing proteins leads to an overall increase in peptidoglycan synthesis, which can enhance metastasis [Citation77]. The reduction in tumor growth was accompanied by a significant increase in intratumor lactate, consistent with our observations [Citation78]. At the genus level, our study found that the tumor growth mechanism shown by the core functions of these characteristic GM may potentially impact patients with MVI (Figure S3). Therefore, it is possible to prevent ineffective interventions and improve prognosis.
In addition to characterizing the GM of patients in both groups, our study proposes preoperatively predicting MVI status based on species OTU levels. We found that OTU-level-based predictions were a good effect and successfully achieved independent validation with good reproducibility, possibly due to the use of detailed 16S rRNA gene sequences. Among the nine most promising OTU-based microbial markers, some coincide with our signature bacteria (Blautia and Veillonella), which differentiated the MVI group from the non-MVI group at the genus level and are linked to specific host functions. We suggest that the signature of MVI-associated microbial dysbiosis may be generalized in a manner similar to the characterization of GM in patients with early-stage HCC [Citation26]. These results suggest that GM-targeted biomarkers could be potential non-invasive tools for preoperative MVI diagnosis.
Our study had some limitations. While 16S rRNA gene sequencing provides valuable insights into the GM, metagenomic sequencing offers a more comprehensive genetic view. Additionally, we observed an association between the MVI and non-MVI groups and the intestinal microbiome but did not establish direct causality. Finally, our findings achieved good universality in the independent verification group; nevertheless, further confirmation in a larger cohort is needed. Future research employing metagenomic sequencing, strain isolation and culture, and animal models will enhance our understanding of the mechanisms of intestinal bacteria in the state of MVI while expanding the cohort size promises to improve predictive accuracy.
Conclusions
We have delineated the systemic alterations in GM between MVI and non-MVI states in HBV-HCC patients. We identified microbial signatures associated with each status and developed a highly accurate preoperative diagnostic tool based on OTU levels for determining MVI status. Overall, our study reveals critical insights into the role of GM in HBV-HCC, particularly in relation to MVI. These findings not only enhance our understanding of the disease but also pave the way for developing innovative diagnostic and therapeutic strategies. Harnessing the power of microbial signatures for early MVI detection holds promise for improving patient outcomes and warrants further investigation in larger clinical cohorts.
Ethical approval and consent to participate
This study was conducted in accordance with the 2013 revision of the Declaration of Helsinki. The Guangxi Medical University Cancer Hospital Research Ethics Committee approved this study (No. KY2019009), and all participants provided informed consent.
Author contributions
(I) Conception and design: Yu-Chong Peng, Lu-Nan Qi; (II) Administrative support: Lu-Nan Qi; (III) Provision of study materials or patients: Yu-Chong Peng, Jing-Xuan Xu, Xue-Mei You, Lu-Nan Qi; (IV) Collection and assembly of data: Yu-Chong Peng, Jing-Xuan Xu, Xue-Mei You, Le-Qun Li, Lu-Nan Qi; (V) Data analysis and interpretation: Yu-Chong Peng, Jing-Xuan Xu, Xue-Mei You, Yi-Yue Huang, Lu-Nan Qi; (VI) Manuscript writing: All authors; (VII) Final approval of manuscript: All authors.
Supplemental Material
Download Zip (2.4 MB)Disclosure statement
No potential conflict of interest was reported by the author(s).
Data availability statement
All data needed to evaluate the conclusions in the paper are present in the paper and/or the Supplementary Materials. Additional data related to this paper may be requested from the authors.
Additional information
Funding
References
- Guo P, He Y, Chen L, et al. Cytosolic phospholipase A2α modulates cell-matrix adhesion via the FAK/paxillin pathway in hepatocellular carcinoma. Cancer Biol Med. 2019;16(2):1–18. doi:10.20892/j.issn.2095-3941.2018.0386.
- Trierweiler C, Hockenjos B, Zatloukal K, et al. The transcription factor c-JUN/AP-1 promotes HBV-related liver tumorigenesis in mice. Cell Death Differ. 2016;23(4):576–582. doi:10.1038/cdd.2015.121.
- Xie Y, Xiang Y, Sheng J, et al. Immunotherapy for hepatocellular carcinoma: current advances and future expectations. J Immunol Res. 2018;2018:8740976–8740978. doi:10.1155/2018/8740976.
- Liu C, Miao X, Wang Y, et al. Bromo- and extraterminal domain protein inhibition improves immunotherapy efficacy in hepatocellular carcinoma. Cancer Sci. 2020;111(10):3503–3515. doi:10.1111/cas.14588.
- Cho JY, Han H-S, Choi Y, et al. Association of remnant liver ischemia with early recurrence and poor survival after liver resection in patients with hepatocellular carcinoma. JAMA Surg. 2017;152(4):386–392. doi:10.1001/jamasurg.2016.5040.
- Cloyd JM, Mizuno T, Kawaguchi Y, et al. Comprehensive complication index validates improved outcomes over time despite increased complexity in 3707 consecutive hepatectomies. Ann Surg. 2020;271(4):724–731. doi:10.1097/SLA.0000000000003043.
- Gan W, Yi Y, Fu Y, et al. Fibrinogen and C-reactive protein score is a prognostic index for patients with hepatocellular carcinoma undergoing curative resection: a prognostic nomogram study. J Cancer. 2018;9(1):148–156. doi:10.7150/jca.22246.
- Zhang H-M, Wen D-G, Wang Y, et al. Arterial spin labeling MRI for predicting microvascular invasion of T1 staging renal clear cell carcinoma preoperatively. Front Oncol. 2021;11:644975. doi:10.3389/fonc.2021.644975.
- Xiao H, Chen Z-B, Jin H-L, et al. Treatment selection of recurrent hepatocellular carcinoma with microvascular invasion at the initial hepatectomy. Am J Transl Res. 2019;11:1864–1875.
- Zhang C, Zhao R, Chen F, et al. Preoperative prediction of microvascular invasion in non-metastatic hepatocellular carcinoma based on nomogram analysis. Transl Oncol. 2021;14(1):100875. doi:10.1016/j.tranon.2020.100875.
- Zhang X-P, Wang K, Wei X-B, et al. An Eastern hepatobiliary surgery hospital microvascular invasion scoring system in predicting prognosis of patients with hepatocellular carcinoma and microvascular invasion after R0 liver resection: a Large-Scale, multicenter study. Oncologist. 2019;24(12):e1476–e88. doi:10.1634/theoncologist.2018-0868.
- Zheng J, Chakraborty J, Chapman WC, et al. Preoperative prediction of microvascular invasion in hepatocellular carcinoma using quantitative image analysis. J Am Coll Surg. 2017;225(6):778–788.e1. doi:10.1016/j.jamcollsurg.2017.09.003.
- Wang L, Jin Y-X, Ji Y-Z, et al. Development and validation of a prediction model for microvascular invasion in hepatocellular carcinoma. World J Gastroenterol. 2020;26(14):1647–1659. doi:10.3748/wjg.v26.i14.1647.
- Zhao Z-X, Fu J, Ma S-R, et al. Gut-brain axis metabolic pathway regulates antidepressant efficacy of albiflorin. Theranostics. 2018;8(21):5945–5959. doi:10.7150/thno.28068.
- Pichler MJ, Yamada C, Shuoker B, et al. Butyrate producing colonic clostridiales metabolise human milk oligosaccharides and cross feed on mucin via conserved pathways. Nat Commun. 2020;11(1):3285. doi:10.1038/s41467-020-17075-x.
- Nishiwaki H, Ito M, Hamaguchi T, et al. Short chain fatty acids-producing and mucin-degrading intestinal bacteria predict the progression of early parkinson’s disease. NPJ Parkinsons Dis. 2022;8(1):65. doi:10.1038/s41531-022-00328-5.
- Reitmeier S, Kiessling S, Clavel T, et al. Arrhythmic gut microbiome signatures predict risk of type 2 diabetes. Cell Host Microbe. 2020;28(2):258–272.e6. doi:10.1016/j.chom.2020.06.004.
- Zheng Y, Fang Z, Xue Y, et al. Specific gut microbiome signature predicts the early-stage lung cancer. Gut Microbes. 2020;11(4):1030–1042. doi:10.1080/19490976.2020.1737487.
- Yang Y, Du L, Shi D, et al. Dysbiosis of human gut microbiome in young-onset colorectal cancer. Nat Commun. 2021;12(1):6757. doi:10.1038/s41467-021-27112-y.
- Lin S-H, Chung P-H, Wu Y-Y, et al. Inhibition of nitric oxide production reverses diabetes-induced kupffer cell activation and Klebsiella pneumonia liver translocation. PLoS One. 2017;12(5):e0177269. doi:10.1371/journal.pone.0177269.
- Hu H, Lin A, Kong M, et al. Intestinal microbiome and NAFLD: molecular insights and therapeutic perspectives. J Gastroenterol. 2020;55(2):142–158. doi:10.1007/s00535-019-01649-8.
- Yuan Y, Yuan H, Yang G, et al. IFN-α confers epigenetic regulation of HBV cccDNA minichromosome by modulating GCN5-mediated succinylation of histone H3K79 to clear HBV cccDNA. Clin Epigenetics. 2020;12(1):135. doi:10.1186/s13148-020-00928-z.
- Yang X-A, Lv F, Wang R, et al. Potential role of intestinal microflora in disease progression among patients with different stages of hepatitis B. Gut Pathog. 2020;12(1):50. doi:10.1186/s13099-020-00391-4.
- Qin N, Yang F, Li A, et al. Alterations of the human gut microbiome in liver cirrhosis. Nature. 2014;513(7516):59–64. doi:10.1038/nature13568.
- Oh TG, Kim SM, Caussy C, et al. A universal Gut-Microbiome-Derived signature predicts cirrhosis. Cell Metab. 2020;32(5):878–888.e6. doi:10.1016/j.cmet.2020.06.005.
- Ren Z, Li A, Jiang J, et al. Gut microbiome analysis as a tool towards targeted non-invasive biomarkers for early hepatocellular carcinoma. Gut. 2019;68(6):1014–1023. doi:10.1136/gutjnl-2017-315084.
- Magoč T, Salzberg SL. FLASH: fast length adjustment of short reads to improve genome assemblies. Bioinformatics. 2011;27(21):2957–2963. doi:10.1093/bioinformatics/btr507.
- Caporaso JG, Kuczynski J, Stombaugh J, et al. QIIME allows analysis of high-throughput community sequencing data. Nat Methods. 2010;7(5):335–336. doi:10.1038/nmeth.f.303.
- Wang Q, Garrity GM, Tiedje JM, et al. Naive bayesian classifier for rapid assignment of rRNA sequences into the new bacterial taxonomy. Appl Environ Microbiol. 2007;73(16):5261–5267. doi:10.1128/AEM.00062-07.
- Douglas GM, Maffei VJ, Zaneveld JR, et al. PICRUSt2 for prediction of metagenome functions. Nat Biotechnol. 2020;38(6):685–688. doi:10.1038/s41587-020-0548-6.
- Bushel PR, Ferguson SS, Ramaiahgari SC, et al. Comparison of normalization methods for analysis of TempO-Seq targeted RNA sequencing data. Front Genet. 2020;11:594. doi:10.3389/fgene.2020.00594.
- Guindo ML, Kabir MH, Chen R, et al. Potential of Vis-NIR to measure heavy metals in different varieties of organic-fertilizers using boruta and deep belief network. Ecotoxicol Environ Saf. 2021;228:112996. doi:10.1016/j.ecoenv.2021.112996.
- Batista G, Prati RC, Monard M. A study of the behavior of several methods for balancing machine learning training data. SIGKDD Explor Newsl. 2004;6(1):20–29. doi:10.1145/1007730.1007735.
- Chen K, Li Z, Zhang M, et al. miR-876 inhibits EMT and liver fibrosis via POSTN to suppress metastasis in hepatocellular carcinoma. Biomed Res Int. 2020;2020:1964219–1964211. doi:10.1155/2020/1964219.
- Lin Z, Jia H, Hong L, et al. Prognostic impact of SET domain-containing protein 8 and protein arginine methyltransferase 5 in patients with hepatocellular carcinoma following curative resection. Oncol Lett. 2018;16(3):3665–3673. doi:10.3892/ol.2018.9083.
- Mazel F, Davis KM, Loudon A, et al. Is host filtering the main driver of phylosymbiosis across the tree of life? mSystems. 2018;3(5):e00097–18. doi:10.1128/mSystems.00097-18.
- Vendrik KEW, Ooijevaar RE, de Jong PRC, et al. Fecal microbiota transplantation in neurological disorders. Front Cell Infect Microbiol. 2020;10:98. doi:10.3389/fcimb.2020.00098.
- Reiter JG, Hung W-T, Lee IH, et al. Lymph node metastases develop through a wider evolutionary bottleneck than distant metastases. Nat Genet. 2020;52(7):692–700. doi:10.1038/s41588-020-0633-2.
- Davis A, Navin NE. Computing tumor trees from single cells. Genome Biol. 2016;17(1):113. doi:10.1186/s13059-016-0987-z.
- Urrutia E, Chen H, Zhou Z, et al. Integrative pipeline for profiling DNA copy number and inferring tumor phylogeny. Bioinformatics. 2018;34(12):2126–2128. doi:10.1093/bioinformatics/bty057.
- Jiang H, Chen W, Su L, et al. Impact of host intraspecies genetic variation, diet, and age on bacterial and fungal intestinal microbiota in tigers. Microbiologyopen. 2020;9(7):e1050. doi:10.1002/mbo3.1050.
- Zhang Z, Tang H, Chen P, et al. Demystifying the manipulation of host immunity, metabolism, and extraintestinal tumors by the gut microbiome. Signal Transduct Target Ther. 2019;4(1):41. doi:10.1038/s41392-019-0074-5.
- Sims TT, Colbert LE, Zheng J, et al. Gut microbial diversity and genus-level differences identified in cervical cancer patients versus healthy controls. Gynecol Oncol. 2019;155(2):237–244. doi:10.1016/j.ygyno.2019.09.002.
- Eugene SP, Reddy VS, Trinath J. Endoplasmic reticulum stress and intestinal inflammation: a perilous union. Front Immunol. 2020;11:543022. doi:10.3389/fimmu.2020.543022.
- Youssef O, Lahti L, Kokkola A, et al. Stool microbiota composition differs in patients with stomach, Colon, and rectal neoplasms. Dig Dis Sci. 2018;63(11):2950–2958. doi:10.1007/s10620-018-5190-5.
- Kong L, Wang Z, Xiao C, et al. Glycerol monolaurate ameliorated intestinal barrier and immunity in broilers by regulating intestinal inflammation, antioxidant balance, and intestinal microbiota. Front Immunol. 2021;12:713485. doi:10.3389/fimmu.2021.713485.
- Galloway-Peña JR, Smith DP, Sahasrabhojane P, et al. The role of the gastrointestinal microbiome in infectious complications during induction chemotherapy for acute myeloid leukemia. Cancer. 2016;122(14):2186–2196. doi:10.1002/cncr.30039.
- Haidmayer A, Bosch P, Lackner A, et al. Effects of probiotic strains on disease activity and enteric permeability in psoriatic Arthritis-A pilot Open-Label study. Nutrients. 2020;12(8):2337. doi:10.3390/nu12082337.
- Yinhang W, Jing Z, Jie Z, et al. Prediction model of colorectal cancer (CRC) lymph node metastasis based on intestinal bacteria. Clin Transl Oncol. 2023;25(6):1661–1672. doi:10.1007/s12094-022-03061-w.
- Yi Y, Shen L, Shi W, et al. Gut microbiome components predict response to neoadjuvant chemoradiotherapy in patients with locally advanced rectal cancer: a prospective, longitudinal study. Clin Cancer Res. 2021;27(5):1329–1340. doi:10.1158/1078-0432.CCR-20-3445.
- Peng Y-C, Xu J-X, Zeng C-F, et al. Operable hepatitis B virus-related hepatocellular carcinoma: gut microbiota profile of patients at different ages. Ann Transl Med. 2022;10(8):477–477. doi:10.21037/atm-22-1572.
- Walther-António MRS, Chen J, Multinu F, et al. Potential contribution of the uterine microbiome in the development of endometrial cancer. Genome Med. 2016;8(1):122. doi:10.1186/s13073-016-0368-y.
- Sun L, Suo C, Li S-T, et al. Metabolic reprogramming for cancer cells and their microenvironment: beyond the warburg effect. Biochim Biophys Acta Rev Cancer. 2018;1870(1):51–66. doi:10.1016/j.bbcan.2018.06.005.
- Vaupel P, Schmidberger H, Mayer A. The warburg effect: essential part of metabolic reprogramming and Central contributor to cancer progression. Int J Radiat Biol. 2019;95(7):912–919. doi:10.1080/09553002.2019.1589653.
- Lin Y-C, Wu H-C, Liao C-C, et al. Secretion of one adipokine nampt/visfatin suppresses the inflammatory stress-induced NF-κB activity and affects nampt-dependent cell viability in huh-7 cells. Mediators Inflamm. 2015;2015:392471–392479. doi:10.1155/2015/392471.
- Hong S, Cai W, Huang Z, et al. Ginsenoside Rg3 enhances the anticancer effect of 5‑FU in Colon cancer cells via the PI3K/AKT pathway. Oncol Rep. 2020;44(4):1333–1342. doi:10.3892/or.2020.7728.
- Tabe Y, Lorenzi PL, Konopleva M. Amino acid metabolism in hematologic malignancies and the era of targeted therapy. Blood. 2019;134(13):1014–1023. doi:10.1182/blood.2019001034.
- Hasenoehrl EJ, Rae Sajorda D, Berney-Meyer L, et al. Derailing the aspartate pathway of Mycobacterium tuberculosis to eradicate persistent infection. Nat Commun. 2019;10(1):4215. doi:10.1038/s41467-019-12224-3.
- Liu Y, Marks K, Cowley GS, et al. Metabolic and functional genomic studies identify deoxythymidylate kinase as a target in LKB1-mutant lung cancer. Cancer Discov. 2013;3(8):870–879. doi:10.1158/2159-8290.CD-13-0015.
- El Omari K, Bronckaers A, Liekens S, et al. Structural basis for non-competitive product inhibition in human thymidine phosphorylase: implications for drug design. Biochem J. 2006;399(2):199–204. doi:10.1042/BJ20060513.
- Lafita-Navarro MC, Venkateswaran N, Kilgore JA, et al. Inhibition of the de novo pyrimidine biosynthesis pathway limits ribosomal RNA transcription causing nucleolar stress in glioblastoma cells. PLoS Genet. 2020;16(11):e1009117. doi:10.1371/journal.pgen.1009117.
- Chalishazar MD, Wait SJ, Huang F, et al. MYC-Driven Small-Cell lung cancer is metabolically distinct and vulnerable to arginine depletion. Clin Cancer Res. 2019;25(16):5107–5121. doi:10.1158/1078-0432.CCR-18-4140.
- Zaman S, Yu X, Bencivenga AF, et al. Combinatorial therapy of zinc metallochaperones with mutant p53 reactivation and diminished copper binding. Mol Cancer Ther. 2019;18(8):1355–1365. doi:10.1158/1535-7163.MCT-18-1080.
- Shah M, Kola B, Bataveljic A, et al. AMP-activated protein kinase (AMPK) activation regulates in vitro bone formation and bone mass. Bone. 2010;47(2):309–319. doi:10.1016/j.bone.2010.04.596.
- Hinke SA, Martens GA, Cai Y, et al. Methyl succinate antagonises biguanide-induced AMPK-activation and death of pancreatic beta-cells through restoration of mitochondrial electron transfer. Br J Pharmacol. 2007;150(8):1031–1043. doi:10.1038/sj.bjp.0707189.
- Carmona-Rivera C, Khaznadar SS, Shwin KW, et al. Deficiency of adenosine deaminase 2 triggers adenosine-mediated NETosis and TNF production in patients with DADA2. Blood. 2019;134(4):395–406. doi:10.1182/blood.2018892752.
- Martin D, Rödel F, Balermpas P, et al. C-Reactive protein-to-Albumin ratio as prognostic marker for anal squamous cell carcinoma treated with chemoradiotherapy. Front Oncol. 2019;9:1200. doi:10.3389/fonc.2019.01200.
- Yang S, Sheng X, Xiang D, et al. CD150highTreg cells may attenuate graft versus host disease and intestinal cell apoptosis after hematopoietic stem cell transplantation. Am J Transl Res. 2019;11:1299–1310.
- Bergers G, Fendt S-M. The metabolism of cancer cells during metastasis. Nat Rev Cancer. 2021;21(3):162–180. doi:10.1038/s41568-020-00320-2.
- Pascual G, Domínguez D, Elosúa-Bayes M, et al. Dietary palmitic acid promotes a prometastatic memory via schwann cells. Nature. 2021;599(7885):485–490. doi:10.1038/s41586-021-04075-0.
- Kahleova H, Matoulek M, Bratova M, et al. Vegetarian diet-induced increase in linoleic acid in serum phospholipids is associated with improved insulin sensitivity in subjects with type 2 diabetes. Nutr Diabetes. 2013;3(6):e75–e75. doi:10.1038/nutd.2013.12.
- Sakran M, Selim Y, Zidan N. A new isoflavonoid from seeds of lepidium sativum L. and its protective effect on hepatotoxicity induced by paracetamol in male rats. Molecules. 2014;19(10):15440–15451. doi:10.3390/molecules191015440.
- De Bastiani MA, Klamt F. Integrated transcriptomics reveals master regulators of lung adenocarcinoma and novel repositioning of drug candidates. Cancer Med. 2019;8(15):6717–6729. doi:10.1002/cam4.2493.
- Liu Q, Li J, Zhang W, et al. Glycogen accumulation and phase separation drives liver tumor initiation. Cell. 2021;184(22):5559–5576.e19. doi:10.1016/j.cell.2021.10.001.
- Zhuang Y-W, Wu C-E, Zhou J-Y, et al. Solasodine inhibits human colorectal cancer cells through suppression of the AKT/glycogen synthase kinase-3β/β-catenin pathway. Cancer Sci. 2017;108(11):2248–2264. doi:10.1111/cas.13354.
- Seyrek K, Richter M, Lavrik IN. Decoding the sweet regulation of apoptosis: the role of glycosylation and galectins in apoptotic signaling pathways. Cell Death Differ. 2019;26(6):981–993. doi:10.1038/s41418-019-0317-6.
- Lee C-R, Lee JH, Park KS, et al. Quantitative proteomic view associated with resistance to clinically important antibiotics in gram-positive bacteria: a systematic review. Front Microbiol. 2015;6:828. doi:10.3389/fmicb.2015.00828.
- Polański R, Hodgkinson CL, Fusi A, et al. Activity of the monocarboxylate transporter 1 inhibitor AZD3965 in small cell lung cancer. Clin Cancer Res. 2014;20(4):926–937. doi:10.1158/1078-0432.CCR-13-2270.