
Abstract
Background
The use of a single abnormal finding on electrocardiography (ECG) is not recommended for stratifying the risk of cardiovascular (CV) events in low-risk general populations because of its low discriminative power. However, the value of a scoring system containing multiple abnormal ECG findings for predicting CV death has not been sufficiently evaluated.
Methods
In a prospective community-based cohort study, 8417 participants without atherosclerotic CV diseases (ASCVDs) and any related symptoms were followed for 18 years. The standard 12-lead ECGs were recorded at baseline and the ECG findings were categorized using the Minnesota code classification. CV deaths were defined as death from myocardial infarction (MI), chronic ischemic heart disease, heart failure, fatal arrhythmia, cerebrovascular event, pulmonary thromboembolism, peripheral vascular disease and sudden cardiac arrest and identified using the Korean National Statistical Office (KOSTAT) database.
Results
In a multivariate Cox proportional hazard (CPH) model, major and minor ST-T wave abnormalities, atrial fibrillation (AF), Q waves in the anterior leads, the lack of Q waves in the posterior leads, high amplitudes of the left and right precordial leads, left axis deviation and sinus tachycardia were associated with higher risks of CV deaths. The ECG score consisted of these findings showed modest predictive values represented by C-statistics that ranged from 0.632 to 760 during the follow-up and performed better in the early follow-up period. The ECG score independently predicted CV death after adjustment for relevant covariates in a multivariate model, and improved the predictive performance of the 10-year ASCVD risk estimator and a model of conventional risk factors including age, diabetes and current smoking. The combined ECG score (Harrell’s C-index: 0.852, 95% confidence interval [CI], 0.828–0.876) composed of the ECG score and the conventional risk factors outperformed the 10-year ASCVD risk estimator (Harrell’s C-index: 0.806; 95% CI, 0.780–0.833) and the model of the conventional risk factors (Harrell’s C-index: 0.841, 95% CI, 0.817–0.865) and exhibited an excellent goodness of fit between the predicted and observed probabilities of CV death.
Conclusions
The ECG score could be useful to predict CV death independently and may add value to the conventional CV risk estimators regarding the risk stratification of CV death in asymptomatic low-risk general populations.
KEY MESSAGES
The ECG score based on the Minnesota code classification can independently predict CV death and significantly improve the predictive power of the conventional CV risk estimators in asymptomatic low-risk general population.
The combined ECG score comprised the ECG score, age and the presence of diabetes and current smoking predicted CV mortality more accurately than the conventional SV risk estimators.
ECG may still be a viable CV risk stratification tool for population-based health screening projects.
Introduction
Multiple studies have reported that the presence of abnormal findings on resting electrocardiography (ECG) indicating myocardial injuries, arrhythmia and conduction system abnormalities predicted future cardiovascular (CV) events in low-risk general populations [Citation1–5]. The presence of nonspecific minor ST-T abnormalities on resting ECG was also associated with CV mortality [Citation5,Citation6]. In asymptomatic elderly patients, the presence of abnormal morphologies in resting ECG was even reported to improve the predictive power of the Framingham risk estimator [Citation7]. Most recently, the Brazilian Longitudinal Study of Adult Health (ELSA-Brasil) also reported that major morphologic abnormalities in ECG significantly improved the net reclassification index for CV mortality when added to the Systematic Coronary Risk Evaluation (SCORE) [Citation8]. However, to date, clinical practice guidelines do not recommend using resting ECG in CV risk stratification in general populations because no randomized controlled trials (RCTs) have investigated the benefits of resting ECG for health screening, and the improvement in predictive power of the models containing resting ECG was minimal [Citation9].
A prediction model typically requires a new predictor sensitive to the outcomes and independent of the other predictors in the model to improve its discriminative powers. A single abnormal finding in resting ECG may indicate a certain pathology of the myocardium or the conduction system but might not be sensitive to CV outcomes. We hypothesized that a scoring system composed of various abnormal ECG findings associated with ST-T wave abnormalities, Q wave abnormalities, arrhythmia and ventricular hypertrophy may be more predictive of CV death than a single abnormal finding or a simple composite of abnormal findings on ECG and may also provide significant additional predictive power to conventional risk estimators in low-risk populations. Therefore, we developed a scoring system predicting CV death using only abnormal findings on resting ECG and evaluated the predictive powers of the scoring systems in an asymptomatic low-risk general population.
Methods
Study population
This study was conducted with participants in the Ansan-Ansung cohort study, an ongoing longitudinal investigation, as a part of the Korean Genome Epidemiology Study (KoGES), which is a larger project funded by the South Korean government (Korean National Research Institute of Health, and Korean Centers for Disease Control and Prevention under the Ministry of Health and Welfare) to investigate the association of genetic and environmental factors with metabolic and CV diseases. Detailed information regarding the Ansan-Ansung cohort study protocols was published previously [Citation10,Citation11]. Koreans aged between 40 and 69 years who resided in two cities were enrolled in the study from June 2001 to January 2003. Comprehensive health evaluations, including demographic, social and past medical information, physical examinations, laboratory tests for urine and blood chemistries, ECG and simple chest radiology, were conducted in a tertiary hospital located in Ansan City. Eight serial follow-up evaluations completing the baseline protocol were conducted biennially through scheduled visits to the hospital until 2018. Written informed consent was obtained from all of the participants at every visit. The study protocol adhered to the principles of the Declaration of Helsinki. The Institutional Review Board of Hanyang University Guri Hospital (IRB No. GURI-2021-09-016) and the Korean National Research Institute of Health reviewed and approved the study protocols.
Information on demographic, social and past medical histories and symptoms
Participants underwent face-to-face interviews conducted by trained investigators using a questionnaire at every visit to collect information regarding the following variables: demographics; lifestyle factors, including smoking, alcohol intake and physical activity; comorbidities, including hypertension, diabetes mellitus (DM), myocardial infarction (MI), coronary artery disease (CAD), cerebrovascular event, heart failure and peripheral vascular diseases (PVDs); and related medications. Angina-related symptoms were defined as dyspnea during exertion ≥ New York Heart Association classification 2; chest pain that was pressure-like, squeezing, burning or fullness in both arms, substernal area, anterior chest wall or jaw; and chest pain during exercise, emotional stress or cold exposure. Comprehensive physical examinations were conducted for anthropometric measurements, blood pressure and pulse rate (PR). Laboratory tests were conducted after at least an 8-h fast. Serum creatinine, lipid profiles, fasting glucose and hemoglobin A1c (HbA1c) were measured using an automated analyzer (Hitachi Automatic Analyzer 7600, Hitachi, Nittobo, Tokyo, Japan).
Hypertension was defined as a previous diagnosis of hypertension or administration of antihypertensive medications. DM was defined as a previous diagnosis of DM, administration of either insulin or oral hypoglycemic agents or HbA1c ≥6.5%. The estimated glomerular filtration rate (eGFR) was calculated using the Chronic Kidney Disease Epidemiology Collaboration Study equation. The 10-year atherosclerotic CV disease (ASCVD) risk was calculated using a modified equation as previously described in the Korean Heart Study [Citation12].
Measurement and classification of ECG
Standard 12-lead ECG was obtained using a GE Marquette MAC 5000® (GE Marquette Inc., Milwaukee, WI) at baseline evaluation. ECG was recorded at a 25 mm/s paper speed and 0.1 mV/mm amplitude and classified according to the Minnesota codes by one experienced cardiologist from the tertiary hospital.
Abnormal ECG findings were defined as described in Supplementary Table S1. Abnormal ECG findings prevalent in 5 or fewer participants in the entire study population, including advanced AV block (Minnesota code 6-1/6-2-1/6-2-2), sinus node dysfunction (Minnesota code 8-5-1/8-5-2), intraventricular conduction delay (Minnesota code 7-4), and left bundle branch block (Minnesota code 7-1-1/7-1-2), were not included in the prediction model as predictors of CV death.
Identification and definition of CV death
CV death was identified through the causes of death recorded in the death certificate as an International Disease Classification-10 (ICD-10) code and registered in the database from the Korean National Statistical Office (KOSTAT). CV death was defined as death from MI (I21–I23), chronic ischemic heart disease (I24–I25), heart failure (I34–I37, I42–I45 and I50), fatal arrhythmia (I46–I47), cerebrovascular event (I60–I69), pulmonary thromboembolism (I26–I28), PVD (I70–I75) and sudden cardiac arrest (R96).
Participant selection
To conduct the study only with an asymptomatic low-risk population, participants who had prior histories of CV diseases, including MI, non-MI CAD, heart failure and ischemic/hemorrhagic stroke, were excluded. Self-reported previous diagnoses made by physicians were used as the definitions of these CV diseases. Non-MI CADs were defined as physician-diagnosed angina pectoris without MI. Participants with any angina-related symptoms or those with missing data required to calculate ASCVD risk were also excluded from the analyses (Figure S1).
Statistical analysis
Baseline characteristics and abnormal ECG findings were compared between participants who had experienced CV death and those who had not, to identify the differences in the variables by the outcome. The comparisons were performed using a Chi-square test for categorical variables and Student’s t test for continuous variables. For variables with a skewed distribution or limited numbers of observations in categories, Mann–Whitney’s U test or Fisher’s exact test was used.
The crude association between each abnormal ECG finding and CV death was evaluated using a Cox proportional hazard (CPH) model. A multivariate CPH model was produced only with abnormal ECG findings to identify strong independent predictors of CV death among the various abnormal ECG findings. To minimize overfitting bias and optimize model complexity, the full models with abnormal ECG findings were reduced using a backward variable selection procedure. The cutoff criterion for the variable selection procedure was set to p ≥ 0.10. Variables with similar traits excluded each other from the full models to avoid multicollinearity, and the variable inflation factor for each variable was set to remain <2. The ECG score was produced using the coefficients of the best-fit model.
The ECG score was defined as the sum of points produced from the nomogram of coefficients of the best-fit model, in which each point was rounded to an integer and the maximum point score was set to 100. Detailed methods to produce the ECG score from the nomogram and an example of the ECG score calculation are described in Figure S2. The proportional hazard assumption of the ECG score was evaluated using the scaled Schoenfeld residual test. Participants were divided into 3 groups by the ECG score at 30 and 60 points, and then the cumulative incidence of CV death was compared among groups using the Kaplan–Meier survival curve and a log-rank test. The risk of CV death was compared among the 3 groups using a univariate CPH model. Apparent goodness of fit of the ECG model was evaluated using the intraclass correlation coefficient (ICC) and Hosmer–Lemeshow test between observed and predicted rates of CV death.
The non-linear relationships of continuous variables including age, BMI, low-density lipoprotein (LDL) cholesterol levels and PR with the risk of CV death were evaluated using univariate CPH models with a restrictive cubic spline fit. In cases where a significant non-linear relationship was identified, the continuous variable was transformed based on the fitting curve (Figure S3). As a result, BMI was categorized into 3 groups (<23 kg/m2, 23–24.9 kg/m2 and ≥25 kg/m2) and PR was transformed into PR −70 (or 0, if PR < 70 bpm), reflecting their non-linear relationship with the risk of CV death.
A multivariate CPH model was used to evaluate the independent association between the ECG score and CV death in the presence of covariates including age, sex, hypertension, DM, BMI, central obesity, current smoking, current alcohol consumption and LDL cholesterol levels. The model was reduced using a backward variable selection procedure to minimize the overfitting bias and to identify the most significant predictors for CV death. Using the best-fit model from the variable selection procedure, we produced the combined ECG score to predict CV death. The coefficients of the best-fit model were normalized and summed to produce the combined ECG score.
CPH models were compared using the C-statistics from the receiver-operating characteristic (ROC) curves, Harrell’s C-indices and Bayesian information criterion (BIC) to evaluate whether adding the ECG score improved a conventional risk factor model and the 10-year ASCVD risk model. The conventional risk factor model included the same covariates as the combined ECG model minus the ECG score. C-statistics of the ROC curves were compared between models in a 24-month interval using Delong’s test. The other indices were used to compare the overall performance of the models. Harrell’s C-indices were compared using Student’s t-test proposed by Schrȍder et al. [Citation13], and a difference between 2 BICs ≥ 10 was considered significant.
Validation and calibration
CPH models were validated using 1000 bootstrap resamples. For multivariate CPH models, the original full models with all covariates included were validated under the same backward variable selection conditions. Calibrations between the observed and predicted survival rates were also performed using another set of 1000 bootstrap resamples. For the multivariate CPH models, the original full models were also calibrated under the same variable selection conditions. Optimism was estimated using the discriminative power from the model training and testing. The calibrations were performed at 48, 96, 144 and 192 months of follow-up.
All statistical analyses were conducted using statistical software R version 4.2.2 (R Core Team, R Foundation for Statistical Computing, Vienna, Austria) and RStudio-2022.12.0 (Build 353; RStudio Team, BPC, Boston, MA). R packages including ‘dplyr’, ‘ResourceSelection’, ‘descr’, ‘survival’, ‘rms’, ‘timeROC’, ‘pROC’, ‘irr’, ‘BiocManager’, ‘survcomp’ and ‘tableone’ were used for the analyses. The entire R script used to perform the analyses is described in Supplementary Data S1. A p value < 0.05 was considered significant.
Results
Among 10,030 participants enrolled at the baseline evaluation, 8419 participants who had no prior CV diseases or angina-related symptoms and had available baseline ECG and 10-year ASCVD risk were observed for a median of 17.4 years (interquartile range [IQR], 15.8–18.0 years) of follow-up (121,120.8 person-years). The mean age was 52.1 ± 8.9 years, and 4278 participants (50.8%) were males. CV death occurred in 192 participants (2.3%). Baseline characteristics and their comparisons between the participants who had CV death and those who did not are described in . The mean age was older, and waist circumference, PR, HbA1c and the frequencies of the lower-income class, central obesity, alcohol intake, DM and hypertension were greater in those who had CV death; BMI, physical activity, lipid profiles and the frequencies of male sex and smokers were not different between the 2 groups. Abnormal ECG findings were more frequent in those who had CV death than in those who did not. The frequencies of abnormal ECG findings are described in Table S2. T-wave flattening, any ST-T wave abnormality, major and minor ST-T wave abnormalities, Q waves in the anterior precordial leads, atrial fibrillation (AF), high amplitudes of QRS in the right and left precordial leads and tachycardia (HR ≥100 bpm) were more frequent in those who had CV death.
Table 1. Baseline characteristics of the study population.
Univariate CPH models showed that ST-segment depression, T-wave flattening, any T-wave abnormality, any ST-T wave abnormality, major and minor ST-T wave abnormality, AF, high amplitude of QRS complex in the left and right precordial leads, left axis deviation, left anterior fascicular block and tachycardia were significantly associated with a higher risk of CV death (). A multivariate CPH model showed that major and minor ST-T abnormalities, AF, Q-waves in the anterior and posterior precordial leads, high amplitudes in the left and right precordial leads, left axis deviation and tachycardia were significantly associated with a higher risk of CV death in the best-fit model (). Harrell’s C-index for the best-fit model was 0.631 (95% CI 0.593–0.668).
Figure 1. Associations between ECG findings and the risk of CV death in univariate models. ST depression, T-wave flattening, major and minor ST-T wave abnormalities, atrial fibrillation and high amplitude in the left and right precordial leads, left axis deviation, left anterior fascicular block, tachycardia and PR ≥ 70 bpm are associated with an increased risk of CV death. HR: hazard ratio; CI: confidence interval; PR: pulse rate
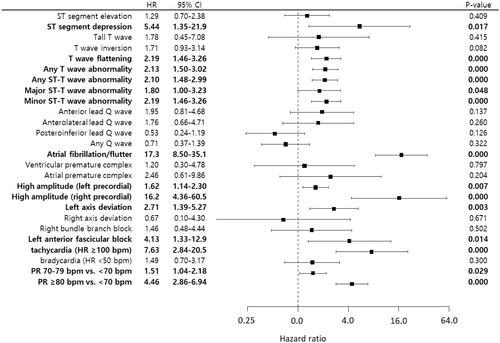
Table 2. Multivariate Cox proportional hazard model of ECG findings for CV deaths.
The internal validation using 1000 bootstrap resamples showed that the optimism of the model C-index was 0.015 (95% CI, 0.014–0.017), and the optimism-corrected C-index was 0.616 (95% CI, 0.583–0.649). The calibration results showed that the predicted survival rate agreed well with the observed rate, and the 0.9 quantile absolute errors between the observed and predicted survival rates at 72, 120, 168 and 216 months were all <1%, but the optimism-corrected biases between the observed and predicted survival rates increased as the predicted survival decreased (Figure S4).
The ECG scores produced using the nomogram of coefficients from the multivariate CPH model ranged from 0 to 167. The C-statistics of the ECG score ranged from 0.650 (95% CI, 0.611–0.689) to 0.760 (95% CI, 0.633–0.887) and peaked at 24 months of follow-up and gradually decreased over time (). A Kaplan–Meier survival curve showed that the cumulative incidence of CV death was greater in the groups with higher ECG scores (). A univariate CPH model showed that the risk of CV death increased two or more times for every additional 30 points in the ECG score. The observed and predicted event rates highly agreed, but the agreement level decreased in the highest score group (≥60 points) or as the follow-up duration increased ().
Figure 2. Nomogram of the multivariate Cox proportional hazard model and the C-statistics of the prediction scores. A) The maximum value of the nomogram was set to 100. The numbers on the scales of individual predictors indicate the normalized coefficient of the predictors. The points were rounded to the closest integers. B) The scores ranged between 0 and 167. The survival ROC curve analysis showed a gradual decrease in the C-statistics over time during the follow-up.
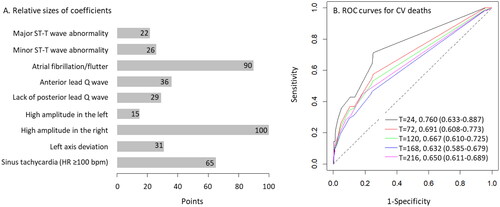
Figure 3. Goodness of fit of the ECG score model for predicting CV death. A) Participants were divided into groups based on their ECG scores (Group 1 [black], <30 points; Group 2 [red], 30–59 points; Group 3 [blue], ≥60 points). The cumulative incidence of CV death increased with the ECG scores. The solid lines represent the observed cumulative incidence of CV death, and the broken lines represent the cumulative incidence of CV death predicted using the ECG score. The HRs for CV death were 2.00 and 5.58 in Group 2 and 3, compared with that in Group 1. B) The predicted incidences of CV deaths agreed well with the observed incidences of CV deaths throughout the follow-up period. The intraclass correlation coefficient (ICC) between the predicted and observed incidences of CV deaths was 0.989 (95% CI, 0.978–0.995). The agreement level was lower in Group 3 than in the other groups. C) Hosmer–Lemeshow tests showed that the observed incidences agreed well with the predicted incidences throughout the follow-up duration.
![Figure 3. Goodness of fit of the ECG score model for predicting CV death. A) Participants were divided into groups based on their ECG scores (Group 1 [black], <30 points; Group 2 [red], 30–59 points; Group 3 [blue], ≥60 points). The cumulative incidence of CV death increased with the ECG scores. The solid lines represent the observed cumulative incidence of CV death, and the broken lines represent the cumulative incidence of CV death predicted using the ECG score. The HRs for CV death were 2.00 and 5.58 in Group 2 and 3, compared with that in Group 1. B) The predicted incidences of CV deaths agreed well with the observed incidences of CV deaths throughout the follow-up period. The intraclass correlation coefficient (ICC) between the predicted and observed incidences of CV deaths was 0.989 (95% CI, 0.978–0.995). The agreement level was lower in Group 3 than in the other groups. C) Hosmer–Lemeshow tests showed that the observed incidences agreed well with the predicted incidences throughout the follow-up duration.](/cms/asset/40dfca32-be71-4cfb-ae2a-690fe9c31947/iann_a_2288306_f0003_c.jpg)
The ECG score was associated with a higher risk of CV death independently of conventional CV risk factors (Model 2 in ). The predictive power represented by Harrell’s C-index was significantly improved when the ECG score was added to the prediction model for CV death consisting of the conventional CV risk factors (Model 1 vs. Model 2 in ). The ECG score also significantly improved the predictive power when added to the 10-year ASCVD risk (Model 3 vs. Model 4 in ). The model with the ECG score and the conventional CV risk factors including age, diabetes and current smoking (Model 2) showed the strongest predictive power among the models (). The ECG score improved the C-statistics of the 10-year ASCVD risk equation model in the early follow-up period (24, 48, 72 and 120 months), but not in the late follow-up period (Model 3). In contrast, the combined model with the ECG score (Model 2) exhibited C-statistics comparable to those of the 10-year ASCVD risk equation in the early follow-up period, while it demonstrated significantly higher C-statistics than the 10-year ASCVD risk equation in the late follow-up period (Figure S5 and Table S3). The combined ECG score produced from Model 2 showed C-statistics >0.82 throughout the follow-up period and an excellent goodness of fit (). Calibration using bootstrap resamples showed only a small amount of absolute errors in the survival probability predicted using the combined ECG score (Figure S6).
Figure 4. Predictive performances of the combined ECG score. A) The combined ECG score comprised the ECG score, age, the presence of diabetes and current smoking. B) The C-statistics of the combined ECG score gradually increased while remain >0.820 throughout the follow-up period. T = N indicates the time of the observation (Months) and the numbers indicate C-statistics and the 95% confidence intervals of the C-statistics. C) The risk of CV death markedly diverged with the groups divided based on the combined ECG score (Group 1 [black], <50 points; Group 2 [red], 50–99 points; Group 3 [blue], ≥100 points). The observed rates (solid lines) and predicted rates (broken lines) of CV deaths appeared to be closely approximated. D) The combined ECG score showed an excellent goodness of fit between the observed and predicted cumulative incidences of CV deaths. The intraclass correlation coefficient (ICC) was approaching 1 between the observed and predicted incidences of CV deaths.
![Figure 4. Predictive performances of the combined ECG score. A) The combined ECG score comprised the ECG score, age, the presence of diabetes and current smoking. B) The C-statistics of the combined ECG score gradually increased while remain >0.820 throughout the follow-up period. T = N indicates the time of the observation (Months) and the numbers indicate C-statistics and the 95% confidence intervals of the C-statistics. C) The risk of CV death markedly diverged with the groups divided based on the combined ECG score (Group 1 [black], <50 points; Group 2 [red], 50–99 points; Group 3 [blue], ≥100 points). The observed rates (solid lines) and predicted rates (broken lines) of CV deaths appeared to be closely approximated. D) The combined ECG score showed an excellent goodness of fit between the observed and predicted cumulative incidences of CV deaths. The intraclass correlation coefficient (ICC) was approaching 1 between the observed and predicted incidences of CV deaths.](/cms/asset/286bde77-03aa-45f7-b603-46006dc576ae/iann_a_2288306_f0004_c.jpg)
Table 3. Comparisons of the ECG score with conventional risk estimators for CV deaths.
We performed a sensitivity analysis for the prediction model after replacing the variable tachycardia (HR ≥100 bpm) with actual PR (range 45–128 bpm) (Table S4). The PR was not recorded from the baseline ECG but was recorded during the physical examinations. This ECG-PR score model had a higher Harrell’s C-index than the ECG score (0.665 [95% CI, 0.626–0.704] vs. 0.631 [95% CI, 0.594–0.668], Table S4 and ) and significantly improved the model with the conventional risk factors (Model 1 vs. Model 2b in Table S5) and the 10-year ASCVD risk (Model 3 vs. Model 4b in Table S5). The improvements attributed by the ECG-PR score were greater than those attributed by the ECG score (0.852 for Model 2 vs. 0.857 for Model 2b; 0.820 for Model 4 vs. 0.826 for Model 4b).
Discussion
In the results, we found that the major and minor ST-T wave abnormality, AF, Q waves in the anterior leads, lack of Q waves in the posterior leads, high amplitude of QRS complex in the left and right precordial leads, left axis deviation and sinus tachycardia were significantly associated with a higher risk of CV deaths. The ECG score, although it had a modest predictive value for CV death, showed additive value to the predictive power of the 10-year ASCVD risk and a model with conventional risk factors for CV deaths.
Abnormal findings in resting ECG are not uncommon. The ELSA-Brasil reported that the prevalence of major ECG abnormalities was 11.3% in men and 7.9% in women [Citation14]. Our previous report showed that the prevalence of abnormal ECG findings related to myocardial injury was 17.3% [Citation5]. Our current results also showed that any types of abnormal ECG findings were found in 37.8% of the study population, and abnormal ECG findings significantly associated with the risk of CV death were found in 30.4% of the study population.
Abnormal resting ECG findings, including ST-T wave changes and Q waves, were found to be predictive of future CV events in low-risk populations [Citation1,Citation3–7,Citation15]. Most recently, Pinto-Filho et al. also reported in the ELSA-Brasil cohort study that the presence of major ECG abnormalities independently predicted CV death and all-cause death and significantly improved the net reclassification index of the European SCORE [Citation14]. However, ECG has not been recommended for CV risk stratification in low-risk populations, mainly because no RCTs have reported beneficial effects of health screening programmes, including resting ECG, on CV outcomes and the improvement in the prediction models for CV events by abnormal resting ECG findings was minimal [Citation5,Citation9]. Individual abnormal ECG findings, such as ST-segment depression, T-wave inversion and pathologic Q waves in standard 12-lead resting ECG typically have high specificities but low sensitivities to CV diseases in low-risk general populations [Citation5]. The proposed ECG score, composed of several abnormal ECG findings based on the Minnesota code classification system, has better performance (Harrell’s C-index of 0.538 [0.519–0.557] vs. 0.631 [0.594–0.668]) with a higher sensitivity in predicting CV death than single abnormal ECG findings. Moreover, the ECG score improved the predictive power of conventional CV risk estimators when added to the prediction models, and the combined ECG score model containing the ECG score and a few conventional CV risk factors performed better than the 10-year ASCVD risk in predicting CV death.
Several previous studies proposed CV risk stratification methods using ECG findings. Tan et al. reported in a study on 29,320 male veterans that the risk of death increased progressively as the number of ECG abnormalities increased and proposed a simple ECG score summing up the numbers of ECG abnormalities to predict CV mortality [Citation16]. Lu et al. also proposed, in a prospective community-based cohort study on elderly Taiwanese individuals, an ECG abnormality score including left ventricular hypertrophy (LVH), prolonged corrected QT duration (>450 ms) and PR interval (>220 ms) and others and reported that the score improved a model of conventional CV risk factors for CV mortality [Citation17]. More recently, Shah et al. reported, in a community-based cohort study, that T-wave axes, heart rate and corrected QT interval were associated with a higher risk of major adverse CV disease [Citation18]. They developed the National Health and Nutrition Examination Survey (NHANES) ECG risk equation consisting of these ECG abnormalities plus age and sex, and the equation showed similar predictive powers for CV death and all-cause death to the Framingham risk score and the pooled cohort equation. The NHANES ECG risk equation also improved the predictive power of the Framingham risk score and the pooled cohort equation when added to the models. Our results are consistent with those of the above studies, showing that the ECG score independently predicted CV death and the proposed combined ECG score showed better predictive performance for CV death than the model with conventional CV risk factors and the 10-year ASCVD risk equation. These results suggest a potential role of resting ECG in the risk stratification for CV death in asymptomatic low-risk general populations.
In the results, most major ECG abnormalities were associated with a higher risk of CV deaths; however, the Q wave/QS patterns in the posteroinferior leads were associated with a lower risk of CV death. This is an unexpected result, since the presence of posterior wall Q-waves was reported to impact the composite events of death and hospitalization for ischemic heart disease as negatively as the presence of anterior wall Q-waves [Citation4]. In our data, the presence of the posteroinferior Q waves was much more numerous than the presence of the anterior Q waves (510 vs. 127; Table S2), and the most posteroinferior Q waves were small Q waves in lead III and aVF (70.7% for codes 1-3-4, [Q wave duration of 30–39 ms in lead III and amplitude ≥1.0 mm in aVF]), while the most anterior Q waves were major Q waves (61.4% for codes 1-1-X). These differences in the components between the anterior and posteroinferior Q waves may provide some explanation for the result, given that small Q-waves in the inferior leads are often considered benign in a low-risk population.
Although PR was not derived from ECG, a higher PR was significantly associated with a higher risk of CV death, as did the presence of the sinus tachycardia code in ECG. These results align with many published epidemiological studies that highlighted the association between resting heart rate and CV mortality in both general populations and patients with established CV diseases [Citation19,Citation20]. Since heart rate is such a fundamental feature achievable from all ECG, the ECG-PR score incorporating PR, instead of sinus tachycardia, may be a better tool to predict CV death than the ECG score, if PR could be validated as a representative measure of heart rate in ECG.
The strengths of this study included, first, a large number of participants, which allowed the investigation of various ECG findings not included in previous studies for prediction ECG models. Second, we strictly included low-risk participants without underlying CV diseases or any related symptoms to produce a prediction model truly applicable for risk stratification during health screening examinations. Third, we used the Minnesota codes classified and recorded in the dataset by an experienced cardiologist during the baseline period. Since the original ECG images were no longer accessible, we were unable to verify the ECG findings. Consequently, we cannot dismiss the possibility of misclassification in the recorded ECG findings. Nevertheless, it is important to note that we intentionally designed the ECG score solely based on the Minnesota code classification, which can be automatically obtained and archived using software, therefore, applied to large population health survey plans. The NHANES ECG risk equation proposed by Shah et al. [Citation18] included T-wave axes, heart rate and corrected QT interval as ECG variables, which is quite an unfamiliar approach to most physicians, and the model also included age and male sex, the two most prominent predictors for CV diseases, which may explain most variances in the prediction model. Fourth, we developed the ECG score and the combined ECG score using multivariate CPH models. Unlike our study, the ECG scores proposed by Lu et al. [Citation17] and Tan et al. [Citation16] were produced simply by summing the numbers of abnormal ECG findings without using statistical models for survival data. This approach ignores the differences in effect sizes among ECG variables, which were greater than double in the score proposed by Tan et al. [Citation16]. The score model proposed by Lu et al. [Citation17] even included ECG variables not associated with death in the model. These may cause significant biases in calibrations of new datasets.
Limitations
Our study also has several limitations. First, the only outcome included in the model development was CV death, and other related CV outcomes, such as MI, stroke and heart failure admission, were not included. Because in the Ansan-Ansung cohort, information regarding clinical outcomes except the time and cause of death was reported by participants themselves in onsite interviews, clinical outcomes may have contained recall bias and survivor bias; thus, we did not include those outcomes. Second, the 10-year ASCVD risk equation was developed to estimate the risk of major CV events rather than CV death; therefore, its predictive values may not be as sufficiently validated for CV death as the European SCORE, which was designed to predict 10-year fatal CV events. However, the predictive value of the 10-year ASCVD risk equation for CV death has been demonstrated in multiple studies [Citation18,Citation21]. Moreover, unlike other conventional CV disease risk estimators, including the Framingham risk score and the European SCORE, the modified version of the 10-year ASCVD risk equation is optimized for the Korean population [Citation12]. Third, although we demonstrated the predictive values of the ECG score and the combined ECG score for CV death in the results, this should not be interpreted as sufficient evidence for resting ECG to be utilized in health screening surveys for general populations. ECG should still demonstrate the benefit of its utilization on clinical outcomes before it is applied to actual health screening survey programmes. Finally, we validated and calibrated the ECG score and the combined ECG score internally using bootstrap resamples. This internal validation and calibration using bootstrapping is a well-established successful method to evaluate bias in prediction models and estimate the performances of the models with new data, and it is more effective than split-sample model validation [Citation22,Citation23]. External validation in independent population-based cohorts with participants of various ethnic backgrounds is often considered the more desired approach, but Steyerberg EW and Harrell FE stated that external validation by temporal or spatial data splitting would yield poorer model performances and unstable validation findings [Citation23,Citation24]. Therefore, internal validation using bootstrapping, a resampling technique, would be the most reasonable approach for the given data.
In conclusion, the ECG score based on the Minnesota code classification, including major and minor ST-T wave changes, AF, Q waves in the anterior leads, lack of Q waves in the posteroinferior leads, high amplitude of QRS complex in the left and right precordial leads, left axis deviation and sinus tachycardia, independently predicted CV death and significantly improved the predictive power of the model with conventional CV risk factors and the 10-year ASCVD risk equation for CV death in the asymptomatic low-risk general population. The combined ECG model comprising age, the presence of diabetes, current smoking and the ECG score showed sufficient predictive performance with an excellent goodness of fit for CV death. These findings suggest a potential usage of resting ECG in health screening survey programmes for general populations, although further studies for external validation of the ECG score and the clinical impacts of the ECG score are desired.
Authors’ contributions
Conceptualization by Yonggu Lee and Jin-Kyu Park; Data curation by Yonggu Lee and Byung Sik Kim; Formal analysis by Yonggu Lee and Wook-Dong Kim; Investigation by Yonggu Lee, Hyun-Jin Kim and Byung Sik Kim; Methodology by Yonggu Lee; Project administration by Jinho Shin and Jeong-Hun Shin; Software by Yonggu Lee and Byung Sik Kim; Supervision by Jeong-Hun Shin and Young-Hyo Lim; Validation by Byung Sik Kim and Yonggu Lee; Visualization by Wook-Dong Kim and Yonggu Lee; Writing original draft by Wook-Dong Kim and Yonggu Lee; Editing by Hyun-Jin Kim, Jeong-Hun Shin, Young-Hyo Lim, Jinho Shin, Hwan-Cheol Park and Jin-Kyu Park. All authors reviewed and approved the final submitted version of the manuscript.
Supplemental Material
Download Zip (1.3 MB)Acknowledgments
The authors would like to thank all study participants and the research staff of the Institute of Human Genomic Study at Ansan Hospital of Korea University. We would also like to thank the Biostatistical Consulting and Research Lab, Hanyang University, for assistance with statistical analyses.
Disclosure statement
The authors declare that there are no conflicts of interest.
Data availability statement
The KoGES data are available on reasonable request from the Korea Center for Disease Control and Prevention website after proper review procedures (http://nih.go.kr/contents.es?mid=a40504060100).
Additional information
Funding
References
- Auer R, Bauer DC, Marques-Vidal P, et al. Association of major and minor ECG abnormalities with coronary heart disease events. JAMA. 2012;307(14):1–12. doi: 10.1001/jama.2012.434.
- Ishikawa J, Hirose H, Schwartz JE, et al. Minor electrocardiographic ST-T change and risk of stroke in the general Japanese population. Circ J. 2018;82(7):1797–1804. doi: 10.1253/circj.CJ-17-1084.
- Greenland P, Xie X, Liu K, et al. Impact of minor electrocardiographic ST-segment and/or T-wave abnormalities on cardiovascular mortality during long-term follow-up. Am J Cardiol. 2003;91(9):1068–1074. doi: 10.1016/s0002-9149(03)00150-4.
- Godsk P, Jensen JS, Abildstrom SZ, et al. Prognostic significance of electrocardiographic Q-waves in a low-risk population. Europace. 2012;14(7):1012–1017. doi: 10.1093/europace/eur409.
- Shin J, Lee Y, Park JK, et al. Prognostic value of myocardial injury-related findings on resting electrocardiography for cardiovascular risk in the asymptomatic general population: the 12-year follow-up report from the Ansan-Ansung cohort. Ann Med. 2020;52(5):215–224. doi: 10.1080/07853890.2020.1755052.
- Daviglus ML, Liao Y, Greenland P, et al. Association of nonspecific minor ST-T abnormalities with cardiovascular mortality: the Chicago Western electric study. JAMA. 1999;281(6):530–536. doi: 10.1001/jama.281.6.530.
- Jorgensen PG, Jensen JS, Marott JL, et al. Electrocardiographic changes improve risk prediction in asymptomatic persons age 65 years or above without cardiovascular disease. J Am Coll Cardiol. 2014;64(9):898–906. doi: 10.1016/j.jacc.2014.05.050.
- Pinto-Filho MM, Brant LC, Dos Reis RP, et al. Prognostic value of electrocardiographic abnormalities in adults from the Brazilian longitudinal study of adults’ health. Heart. 2021;107(19):1560–1566. doi: 10.1136/heartjnl-2020-318097.
- Jonas DE, Reddy S, Middleton JC, et al. Screening for cardiovascular disease risk with resting or exercise electrocardiography: evidence report and systematic review for the US preventive services task force. JAMA. 2018;319(22):2315–2328. doi: 10.1001/jama.2018.6897.
- Kim Y, Han BG, Ko G, et al. Cohort profile: the Korean genome and epidemiology study (KoGES) consortium. Int J Epidemiol. 2017;46(4):1350–1350. doi: 10.1093/ije/dyx105.
- Kim BS, Lee Y, Kim HJ, et al. Influence of changes in body fat on clinical outcomes in a general population: a 12-year follow-up report on the Ansan-Ansung cohort in the Korean genome environment study. Ann Med. 2021;53(1):1646–1658. doi: 10.1080/07853890.2021.1976416.
- Jung KJ, Jang Y, Oh DJ, et al. The ACC/AHA 2013 pooled cohort equations compared to a Korean risk prediction model for atherosclerotic cardiovascular disease. Atherosclerosis. 2015;242(1):367–375. doi: 10.1016/j.atherosclerosis.2015.07.033.
- Schröder MS, Culhane AC, Quackenbush J, et al. Survcomp: an R/bioconductor package for performance assessment and comparison of survival models. Bioinformatics. 2011;27(22):3206–3208. doi: 10.1093/bioinformatics/btr511.
- Pinto-Filho MM, Brant LCC, Foppa M, et al. Major electrocardiographic abnormalities according to the Minnesota coding system among Brazilian adults (from the ELSA-Brasil cohort study). Am J Cardiol. 2017;119(12):2081–2087. doi: 10.1016/j.amjcard.2017.03.043.
- Ohira T, Iso H, Imano H, et al. Prospective study of major and minor ST-T abnormalities and risk of stroke among Japanese. Stroke. 2003;34(12):e250-3–e253. doi: 10.1161/01.STR.0000103742.83117.FB.
- Tan SY, Sungar GW, Myers J, et al. A simplified clinical electrocardiogram score for the prediction of cardiovascular mortality. Clin Cardiol. 2009;32(2):82–86. doi: 10.1002/clc.20288.
- Lu TP, Chattopadhyay A, Lu KC, et al. Develop and apply Electrocardiography-Based risk score to identify community-based elderly individuals at high-risk of mortality. Front Cardiovasc Med. 2021;8:738061. doi: 10.3389/fcvm.2021.738061.
- Shah AJ, Vaccarino V, Janssens AC, et al. An Electrocardiogram-Based risk equation for incident cardiovascular disease from the national health and nutrition examination survey. JAMA Cardiol. 2016;1(7):779–786. doi: 10.1001/jamacardio.2016.2173.
- Kolloch R, Legler UF, Champion A, et al. Impact of resting heart rate on outcomes in hypertensive patients with coronary artery disease: findings from the International VErapamil-SR/trandolapril STudy (INVEST). Eur Heart J. 2008;29(10):1327–1334. doi: 10.1093/eurheartj/ehn123.
- Cooney MT, Vartiainen E, Laatikainen T, et al. Elevated resting heart rate is an independent risk factor for cardiovascular disease in healthy men and women. Am Heart J. 2010;159(4):612–619 e3. doi: 10.1016/j.ahj.2009.12.029.
- Zhang Z, Gillespie C, Bowman B, et al. Prediction of atherosclerotic cardiovascular disease mortality in a nationally representative cohort using a set of risk factors from pooled cohort risk equations. PLoS One. 2017;12(4):e0175822. doi: 10.1371/journal.pone.0175822.
- Harrell FE. Regression modeling strategies: with applications to linear models, logistic regression, and survival analysis. New York (NY): Springer; 2001. p. 568.
- Steyerberg EW, Harrell FE.Jr. Prediction models need appropriate internal, internal-external, and external validation. J Clin Epidemiol. 2016;69:245–247. doi: 10.1016/j.jclinepi.2015.04.005.
- Steyerberg EW, Harrell FE, Jr., Borsboom GJ, et al. Internal validation of predictive models: efficiency of some procedures for logistic regression analysis. J Clin Epidemiol. 2001;54(8):774–781. doi: 10.1016/s0895-4356(01)00341-9.