
Abstract
Background
The heterogeneity of oral glucose tolerance test (OGTT) patterns during pregnancy remains unclear. This study aims to identify latent OGTT patterns in pregnant women and investigate the high-risk population for late-onset gestational diabetes mellitus (GDM).
Methods
This study including 17,723 participants was conducted from 2018 to 2021. Latent mixture modeling was used to identify subgroups. Modified Poisson regression was performed to explore the relationship between OGTT patterns and late-onset GDM or adverse perinatal outcomes.
Results
Three distinct glucose patterns, high, medium, and low glucose levels (HG, MG, and LG patterns) were identified. The HG pattern represented 28.5% of the participants and 5.5% of them developed late-onset GDM. A five-fold higher risk of late-onset GDM was found in HG pattern than in LG pattern (relative risk [RR]: 5.17, 95% confidence interval [CI]: 3.38-7.92) after adjustment. Participants in HG pattern were more likely to have macrosomia, large for gestational age, preterm birth, and cesarean deliveries, with RRs of 1.59 (1.31-1.93), 1.55 (1.33-1.82), 1.30 (1.02-1.64) and 1.15 (1.08-1.23), respectively.
Conclusion
Three distinct OGTT patterns presented different risks of late-onset GDM and adverse perinatal outcomes, indicating that timely monitoring of glucose levels after OGTT should be performed in pregnant women with HG pattern.
1. Introduction
Gestational diabetes mellitus (GDM) is one of the most common metabolic diseases during pregnancy, causing a variety of perinatal complications, such as macrosomia, shoulder dystocia, caesarean section and neonatal hypoglycaemia [Citation1,Citation2]. In long-term GDM sequelae, GDM is significantly associated with a disorder of maternal glucose metabolism after delivery and childhood adiposity [Citation3].
The most widely used criteria are the International Association of Diabetes and Pregnancy Study Groups (IADPSG) guidelines based on the Hyperglycemia and Adverse Pregnancy Outcome study [Citation4]. The Chinese guidelines for GDM diagnosis are also based on the IADPSG criteria, recommending that an oral glucose tolerance test (OGTT) with 75 g glucose be performed for all pregnant women without pre-gestational diabetes mellitus (PGDM) at 24–28 weeks of gestation or at first visit at 28 weeks during pregnancy [Citation5]. Pregnant women with a normal OGTT will not continue to monitor their glucose levels in the third trimester after the OGTT.
Previous studies reported that 13.5–18.3% of pregnant women with negative screening for GDM before 28 weeks of pregnancy, developed GDM in the third trimester (late-onset GDM), who may lose the opportunity for management and intervention due to the delayed diagnosis and are more likely to cause post-term induction of labour and caesarean delivery [Citation6,Citation7]. Thus, timely identification of high-risk populations for late-onset GDM can help improve maternal and neonatal outcomes. However, little concern has been raised regarding the identity of high-risk pregnant women with late-onset GDM and their pregnancy outcomes.
Furthermore, different features of OGTT-derived glucose patterns, such as time to peak and time to nadir, may predict the risk of future diabetes incidence in the general population [Citation8–11]. However, the glucose pattern of OGTT during pregnancy, the relationship between different OGTT patterns and pregnancy outcomes, and whether the high-risk population can be identified are unclear.
Therefore, the aims of this study were (1) to identify latent distinct glucose patterns of OGTT for pregnant women using a data-driven statistical approach and (2) to explore the high-risk population of late-onset GDM using the heterogeneity of the OGTT pattern, and evaluate the risk of adverse pregnancy outcomes. This may offer the opportunity to prevent late-onset GDM and provide new clinical evidence.
2. Method
2.1. Research design
This was a prospective cohort study based on the China Birth Cohort Study (CBCS), which is a multi-centre prospective longitudinal cohort study in China. Pregnant women at 6–13+6 gestational weeks were enrolled in the CBCS and followed-up until delivery [Citation12]. The participants included in this study were pregnant women who had a singleton foetus and participated in CBCS at the study centre of Beijing Obstetrics and Gynecology Hospital, Capital Medical University between 1 January 2018 and 10 February 2021, and who completed antenatal visits regularly until delivery in this centre. Among 21,822 women who met these criteria, 266 pregnant women with pre-diabetes mellitus (DM) before pregnancy and 2958 pregnant women diagnosed with GDM according to the results of OGTT during 24–28 gestational weeks [Citation5] were excluded. In addition, 875 pregnant women who did not undergo assessment for fasting blood glucose (FBG) during 32–36 gestational weeks and were unable to diagnose late-onset GDM were also excluded. Finally, 17,723 pregnant women were included in the study.
2.2. Measurement
A standardized questionnaire was used to collect baseline characteristics during 6–13+6 gestational weeks, including age, ethnicity, employment status, family annual income, lifestyles including maternal smoking and alcohol consumption, pre-pregnancy height and weight, fertilization method, parity, personal medical history and last menstrual period. The pre-pregnancy body mass index (BMI) was calculated as weight in kilograms divided by height in metres squared and categorized as overweight (24 ≤ BMI < 28 kg/m2) or obesity (BMI ≥ 28 kg/m2) [Citation13]. The last menstrual period was confirmed by ultrasound at baseline.
The OGTT was performed during gestational weeks 24–28 after overnight fasting for at least 8 h. Blood glucose levels were measured at fasting, 1 and 2 h after giving 75 g of glucose. Maternal fasting total cholesterol (TC), triglyceride (TG), high-density lipoprotein-cholesterol (HDL-C) and low-density lipoprotein-cholesterol (LDL-C) levels were also measured simultaneously with OGTT. In addition, FBG was performed during 32–36 gestational weeks after overnight fasting for at least 8 h. All measurements were performed on an automated chemistry/immunology analyzer (Abbott Park, IL, USA) following the standard operating procedure recommended by the manufacturer.
Perinatal outcomes of all participants were collected on the day of delivery, including pregnancy hypertension, gestational age at delivery, delivery mode, blood loss 24 h after delivery, birth weight and Apgar score at 1, 5 and 10 min.
2.3. Definitions
GDM is considered if any of the following values is abnormal: the FBG ≤ 92 mg/dL (5.1 mmol/L), 1 h after glucose load ≤180 mg/dL (10.0 mmol/L) or 2 h after glucose load ≤153 mg/dL (8.5 mmol/L), using 75 g glucose OGTT of IADPSG [Citation5].
Late-onset GDM in this study was defined as pregnant women with negative screening for GDM before 28 weeks of pregnancy, developed GDM in the third trimester if FBG ≥ 5.1 mmol/L at 32–36 gestational weeks [Citation14–16].
Postpartum haemorrhage: average blood loss of more than 500 mL for vaginal delivery and more than 1000 mL for caesarean delivery [Citation17].
Preterm birth: gestational age of less than 37 weeks at delivery.
Macrosomia: neonatal birth weight ≥4000 g, regardless of the gestational week.
Large for gestational age (LGA): neonatal birth weight above the sex-specific 90th percentile for gestational age [Citation18].
A low Apgar score was defined as <7 at 1, 5 or 10 min after birth [Citation19].
2.4. Statistical analyses
Continuous variables with normal distributions were expressed as mean ± standard deviation and compared using one-way analysis of variance. The other continuous variables with skewed distributions were expressed as medians (interquartile ranges) and compared using the Kruskal–Wallis test. Categorical variables were expressed as proportions (%) and compared using the χ2 test.
Latent mixture modelling was used to identify subgroups that shared similar underlying glucose patterns during the OGTT at 24–28 gestational weeks. Initially, a model with one glucose pattern was used, and then, up to three glucose patterns were added. The optimal number of glucose patterns was selected according to the model’s Bayesian Information Criterion (BIC) as well as the size of the smallest identified class. The participants were assigned to the glucose pattern with the highest probability. This statistical analysis can investigate the changes in data over time and can identify the heterogeneous patterns based on three time points of the OGTT and thereafter provide a more complete correlation analysis.
Modified Poisson regression [Citation20] was performed to investigate the relationship between glucose patterns during the OGTT at 24–28 gestational weeks and late-onset GDM or other adverse perinatal outcomes. Potential confounding variables were adjusted in the models, including maternal age, maternal unemployment (yes or no), family annual income (<50,000, 50,000–200,000 and >200,000 Yuan), pre-pregnant overweight or obesity, LDL-C, HDL-C and TG in the second trimester. The statistically significant differences were presented as p < 0.05 with two-tailed tests. All analyses were conducted using SAS, version 9.3 (SAS Institute, Inc., North Carolina).
2.5. Ethical approval
This study followed the Declaration of Helsinki on medical protocol and ethics. Written informed consent was obtained from all the participants. The study protocol was approved by the Ethics Committee of the Beijing Obstetrics and Gynecology Hospital, Capital Medical University (2018-KY-003-02).
3. Result
3.1. Features of three OGTT patterns
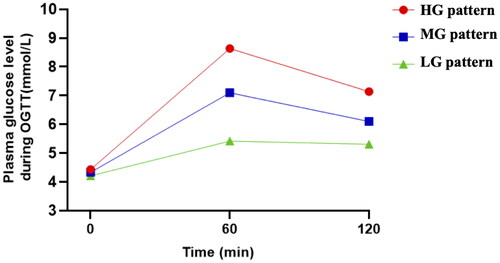
Three distinct glucose patterns of OGTT, including high, medium and low glucose levels (HG, MG and LG patterns), were identified among 17,723 participants with normal OGTT during 24–28 gestational weeks by latent mixture modelling (). HG pattern, representing 28.5% of participants, was characterized by the highest level of FBG (4.44 ± 0.32 mmol/L), 1-h (8.70 ± 0.63 mmol/L) and 2-h blood glucose (7.17 ± 0.71 mmol/L). However, 23.1% of participants (LG pattern) had lower blood glucose levels at the three time points (FBG: 4.21 ± 0.30, 1 h: 5.35 ± 0.71 and 2 h: 5.28 ± 0.79 mmol/L).
Figure 1. Glucose patterns of OGTT during 24–28 gestational weeks. HG, MG and LG patterns represent three distinct patterns of OGTT including high, medium and low glucose levels of OGTT.
3.2. Maternal characteristics of three OGTT patterns
The maternal ages of the three patterns from HG to LG pattern were 32.46 ± 3.81, 31.61 ± 3.68 and 30.68 ± 3.65 years, respectively, with significant differences among groups (p < 0.001). Overweight and obesity occurred more frequently in the HG pattern, as well as in vitro fertilization and embryo transfer and artificial insemination pregnancies. In addition, there were more parous participants in the HG pattern (53.6%) and more nulliparous participants in the LG pattern (56.3%). The proportion of alcohol drinking was the largest in the LG pattern (p < 0.001). There were no differences in maternal working status, family income or maternal smoking among the three patterns ().
Table 1. Maternal and neonatal characteristics of different glucose patterns of OGTT during 24–28 gestational weeks.
3.3. Laboratory measurements of three OGTT patterns
A significantly higher level of FBG, 1-h glucose and 2-h glucose in the OGTT during 24–28 gestational weeks was found in the HG pattern, as well as FBG at 32–36 gestational weeks, while the LG pattern had the lowest level (p < 0.001; ). Interestingly, the TG level in the second trimester decreased from the HG to LG pattern, but the HDL-C level increased significantly in turn (p < 0.001). No significant differences were identified in TC and LDL-C levels among the groups. The mean difference with 95% confidence interval (CI) of glucose and lipid levels within HG and MG patterns compared to LG pattern were demonstrated in Supplementary Table S1. More importantly, 2.8% of 17,723 participants developed late-onset GDM. As expected, the proportion of participants diagnosed with late-onset gestational diabetes among the three patterns decreased from the HG to the LG pattern (5.5%, 2.2% and 0.9%, respectively), with a statistically significant difference of p < 0.001 (). Compared to LG pattern, the unadjusted relative risk (RR) of late-onset GDM in the HG and MG patterns were 6.06 (95% CI 4.31–8.52) and 2.44 (95% CI 1.72–3.46; Supplementary Table S1).
Table 2. Laboratory data of different glucose patterns of OGTT during 24–28 gestational weeks.
3.4. Maternal delivery and neonatal outcomes of different OGTT patterns
Both caesarean delivery and preterm birth were more frequent in the HG pattern (p < 0.001), and their proportion among the three patterns significantly decreased from the HG to LG pattern, whereas the gestational age at delivery increased (p < 0.001; ). The unadjusted RR of caesarean delivery and preterm birth were significantly higher in HG and MG patterns than in LG pattern. The gestational age of HG and MG patterns were significantly changed by −0.22 (−0.27, −0.16) and 0.12 (−0.17, −0.07) weeks (Supplementary Table S2). Moreover, birth weight of HG and MG patterns increased significantly by 84.34 (66.53, 102.10) and 47.28 (31.77, 62.79) gram compared to LG pattern (p < 0.001, and Supplementary Table S2). Furthermore, the prevalence of macrosomia and LGA were highest in the HG group (p < 0.001) and the risk of macrosomia and LGA were higher in HG and MG patterns than in LG pattern ( and Supplementary Table S2). No significant differences in postpartum haemorrhage and neonatal low Apgar scores were observed among the three patterns ( and Supplementary Table S2).
Table 3. Pregnancy delivery and neonatal outcomes of different glucose patterns of OGTT during 24–28 gestational weeks.
3.5. RRs of late-onset GDM and adverse pregnant outcomes with three OGTT patterns
The incidence risk of late-onset GDM in the HG and MG patterns was 5.17 (95% CI 3.38–7.92) and 2.60 (95% CI 1.670–3.97) times higher than that of the LG pattern, respectively, after adjustment for confounding variables ( and ). Participants with HG and MG patterns had a significantly higher risk of macrosomia (RR: 1.59, 95% CI 1.31–1.93 and RR: 1.24, 95% CI 1.03–1.49, respectively) and LGA (RR: 1.55, 95% CI 1.33–1.82 and RR: 1.25, 95% CI 1.07–1.45, respectively) than those with the LG pattern in adjusted model 2. Similarly, the RRs for caesarean deliveries in the HG and MG patterns were 1.15 (95% CI 1.08–1.23) and 1.11 (95% CI 1.04–1.18) in adjusted model 2. Significantly higher risks of preterm birth were found in the HG and MG patterns (RR: 1.69, 95% CI 1.37–2.09 and RR: 1.29, 95% CI 1.05–1.58, respectively) compared with the LG pattern in the crude model, but a significant difference was only observed in the HG pattern after adjusting for confounding variables in models 1 and 2 ( and ).
Figure 2. The plot of RRs and 95% CIs for late-onset gestational diabetes and adverse pregnant outcomes associated with different glucose patterns of OGTT. GMD: gestational diabetes mellitus. LGA: large for gestational age. HG, MG and LG patterns represent three distinct patterns of OGTT including high, medium and low glucose levels of OGTT.
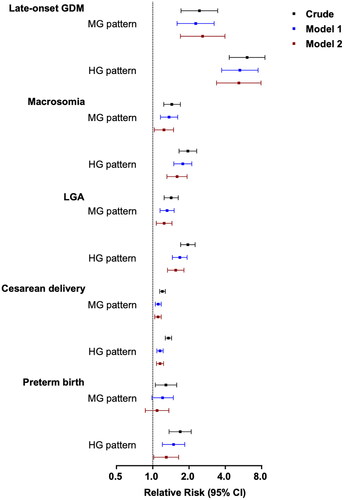
Table 4. RRs and 95% CIs for late-onset gestational diabetes and adverse pregnant outcomes associated with glucose patterns of OGTT during 24–28 gestational weeks.
4. Discussion
Many previous studies have focused on pregnant women with abnormal OGTT results and their pregnancy and postpartum outcomes; however, little attention has been paid to blood glucose levels in the third trimester of pregnancy and postpartum glucose metabolism in pregnant women with normal OGTT during 24–28 gestational weeks, but who still had the possibility to develop late-onset GDM. To our knowledge, this is the first study to investigate the high-risk population for late-onset GDM using the glucose pattern of OGTT in pregnant women and to evaluate the risk of adverse pregnancy outcomes. According to the results of the current study, three distinct glucose patterns (high-, medium- and low-glucose level patterns: HG, MG and LG patterns) of normal OGTT at 24–28 gestational weeks were identified by latent mixture modelling, with statistically significant differences in demographic and obstetric characteristics (p < 0.001). The HG pattern was observed in 28.5% of the participants, 5.5% of whom were diagnosed with late-onset GDM. More importantly, a five-fold higher risk of late-onset GDM was found in the HG pattern (RR: 5.174, 95% CI 3.379–7.921). Furthermore, participants with the HG pattern were more likely to have adverse maternal and neonatal outcomes.
The OGTT is a useful tool for examining human blood glucose regulatory functions. The current focus of OGTT during pregnancy is on the individual glucose value at each time point, and previous studies have reported that abnormal OGTT values are associated with adverse pregnancy outcomes and postpartum adverse effects [Citation21–23]. Although some pregnant women with normal OGTT values, they may also develop late-onset GDM during the third trimester of pregnancy [Citation6,Citation7]. Therefore, it is difficult to identify high-risk populations only according to individual glucose values at a single time point in the OGTT. A previous report showed that OGTT heterogeneity in the general population could reflect the risk of future diabetes [Citation8–10]. However, little attention has been paid to the glucose pattern of OGTT with normal values during pregnancy. The display of the OGTT pattern and the type of pattern that is more prone to developing late-onset GDM have not been studied. Our study provided evidence, showing that there were three kinds of glucose patterns of normal OGTT during 24–28 gestational weeks, and we also found that the HG pattern, characterized by relatively higher levels of FBG and 1- and 2-h blood glucose in normal OGTT, has a significantly higher risk of late-onset GDM (5.174 times) compared to LG pattern with lower glucose level at all time points of OGTT. Additionally, the blood glucose values at each point of the OGTT within the MG pattern were lower than those in the HG pattern but higher than those in the LG pattern, while the risk of late-onset GDM in the MG pattern had the same trend. This is similar to the study conducted by Landon et al., which showed a significant relationship between increased maternal glycaemia and adverse pregnancy outcomes [Citation24].
Moreover, our findings also showed that participants with an HG pattern of normal OGTT during 24–28 gestational weeks were not only more likely to develop late-onset GDM, but also had a significantly increased risk of other adverse pregnancy outcomes, such as caesarean delivery, macrosomia, preterm birth and LGA. Two prior studies with a small sample size also reported a similar trend, demonstrating that the rate of elective caesarean delivery was significantly higher in the late-onset GDM group than in the non-GDM group, and macrosomia was more frequent without a significant difference [Citation6,Citation7]. Therefore, although special attention, as well as diet, exercise and even insulin intervention, is paid to pregnant women with GDM diagnosed when any indicator of OGTT is above the cut-off value according to the current IADPSG diagnostic criteria and guidelines [Citation5], our findings imply that special attention should be paid to pregnant women with HG and MG patterns who have relatively high glucose levels at all time points of normal OGTT results. These pregnant women should monitor glucose levels in a timely manner after OGTT during 24–28 gestational weeks and then adjust diet and exercise to avoid the occurrence of late-onset GDM and adverse pregnancy outcomes.
Furthermore, the OGTT can assess glucose tolerance and evaluate β-cell dysfunction and insulin secretion in obesity, pre-diabetes and type 2 diabetes [Citation25]. FBG in the OGTT could reflect glucose metabolism in the basal state, whereas 1- and 2-h glucose levels could measure glucose metabolism after glucose load. According to a previous study, a high level of fasting glucose is associated with stationary β-cell dysfunction and chronic low β-cell mass, resulting in low sensitivity to hepatic insulin. Abnormal glucose tolerance may cause low sensitivity to peripheral insulin, which is more likely to be associated with environmental factors, including diet and physical exercise [Citation26–28]. In our study, significant differences were observed in all FBG and 1- and 2-h glucose levels among the three patterns, implying that stationary β-cell function, basal insulin secretion and peripheral insulin sensitivity may be different among distinct patterns. In addition, a previous study demonstrated that an abnormal FBG level plays the strongest independent association with type 2 diabetes mellitus compared to 1 and 2 h [Citation23]. Unfortunately, it is difficult to determine which time point of OGTT glucose level contributes most to the development of late-onset GDM in each pattern in our study, and it seems that all three time points may be involved in the occurrence of late-onset GDM, which might be partially avoided by proper diet and exercise. Therefore, further studies are needed to explore which time point of the OGTT has the greatest impact on late-onset GDM.
The present study has several limitations. Although this study included a large sample size, it was a single-centre study, and selection bias might have existed. Additionally, long-term postpartum follow-up of all women with different risk classifications of late-onset GDM was not performed in the current study. Many studies have reported that pregnant women with GDM are at high risk for chronic diseases, including type 2 diabetes [Citation29] and cardiovascular disease [Citation30]. In this study, we found that pregnant women with a high risk for late-onset GDM were more likely to have adverse pregnancy outcomes. Thus, we assumed that women with a high risk of late-onset GDM might be at risk for chronic diseases during the postpartum period. Postpartum follow-up would be very interesting to explore the association of OGTT glucose patterns during pregnancy with the long-term health of postpartum women.
5. Conclusion
In conclusion, the heterogeneity of the OGTT pattern during 24–28 gestational weeks could reflect different risks of late-onset GDM as well as other adverse pregnancy outcomes. Pregnant women with relatively high glucose levels at all points of the normal OGTT should also be considered, and timely monitoring of glucose levels after the OGTT should be performed. Further multi-centre prospective studies are needed to confirm and validate our findings, and effective interventions such as diet and exercise should be designed to prevent late-onset GDM and improve pregnancy outcomes.
Authors contributions
CY, RL and WY designed the study and interpreted the results. EZ and SS conducted analyses and drafted the manuscript. SG, YZ, JL and SX collected data and contributed to revising the manuscript. All authors reviewed and approved the final version of the manuscript.
Supplemental Material
Download MS Word (19.3 KB)Disclosure statement
The authors have no conflicts of interest.
Data availability statement
Anonymized data are available upon reasonable request.
Additional information
Funding
References
- Metzger BE, Coustan DR, Trimble ER. Hyperglycemia and adverse pregnancy outcomes. Clin Chem. 2019;65(7):1–8. doi: 10.1373/clinchem.2019.303990.
- Mitanchez D. [Fetal and neonatal complications of gestational diabetes: perinatal mortality, congenital malformations, macrosomia, shoulder dystocia, birth injuries, neonatal outcomes]. J Gynecol Obstet Biol Reprod. 2010;39(8 Suppl 2):S281–S288. doi: 10.1016/S0368-2315(10)70054-5.
- Lowe WLJr, Scholtens DM, Lowe LP, et al. Association of gestational diabetes with maternal disorders of glucose metabolism and childhood adiposity. JAMA. 2018;320(10):1005–1016. doi: 10.1001/jama.2018.11628.
- Metzger BE, Lowe LP, Dyer AR, et al. Hyperglycemia and adverse pregnancy outcomes. N Engl J Med. 2008;358(19):1991–2002. doi: 10.1056/NEJMoa0707943.
- International Association of Diabetes and Pregnancy Study Groups Consensus Panel, Metzger BE, Gabbe SG, et al. International Association of Diabetes and Pregnancy Study Groups recommendations on the diagnosis and classification of hyperglycemia in pregnancy. Diabetes Care. 2010;33(3):676–682.
- Fonseca A, Lopes J, Clode N. Glucose intolerance in the third trimester is not predictive of adverse outcomes. Int J Gynaecol Obstet. 2019;147(1):108–114. doi: 10.1002/ijgo.12923.
- Shindo R, Aoki S, Nakanishi S, et al. Impact of gestational diabetes mellitus diagnosed during the third trimester on pregnancy outcomes: a case-control study. BMC Pregnancy Childbirth. 2021;21(1):246. doi: 10.1186/s12884-021-03730-8.
- Abdul-Ghani MA, Lyssenko V, Tuomi T, et al. The shape of plasma glucose concentration curve during OGTT predicts future risk of type 2 diabetes. Diabetes Metab Res Rev. 2010;26(4):280–286. doi: 10.1002/dmrr.1084.
- Alyass A, Almgren P, Akerlund M, et al. Modelling of OGTT curve identifies 1 h plasma glucose level as a strong predictor of incident type 2 diabetes: results from two prospective cohorts. Diabetologia. 2015;58(1):87–97. doi: 10.1007/s00125-014-3390-x.
- Hulman A, Gujral UP, Narayan KMV, et al. Glucose patterns during the OGTT and risk of future diabetes in an urban indian population: the CARRS study. Diabetes Res Clin Pract. 2017;126:192–197. doi: 10.1016/j.diabres.2017.01.009.
- Hulman A, Vistisen D, Glümer C, et al. Glucose patterns during an oral glucose tolerance test and associations with future diabetes, cardiovascular disease and all-cause mortality rate. Diabetologia. 2018;61(1):101–107. doi: 10.1007/s00125-017-4468-z.
- Yue W, Zhang E, Liu R, et al. The China Birth Cohort Study (CBCS). Eur J Epidemiol. 2022;37(3):295–304. doi: 10.1007/s10654-021-00831-8.
- Zhou B, Coorperative Meta-Analysis Group of China Obesity Task Force: [Predictive values of body mass index and waist circumference to risk factors of related diseases in chinese adult population]. Zhonghua Liu Xing Bing Xue Za Zhi. 2002;23(1):5–10.
- Choi J, Shultz L, Brazee J, et al. Diagnosis of late-onset gestational diabetes in the third trimester [34A]. Obstet Gynecol. 2020;135(1):17S. doi: 10.1097/01.AOG.0000663072.46331.5b.
- Cauldwell M, Chmielewska B, Kaur K, et al. Screening for late-onset gestational diabetes: are there any clinical benefits? BJOG. 2022;129(13):2176–2183. doi: 10.1111/1471-0528.17154.
- Sgayer I, Odeh M, Wolf MF, et al. The impact on pregnancy outcomes of late-onset gestational diabetes mellitus diagnosed during the third trimester: a systematic review and meta-analysis. Int J Gynaecol Obstet. 2023. doi: 10.1002/ijgo.15254.
- Lalonde A, International Federation of Gynecology and Obstetrics. Prevention and treatment of postpartum hemorrhage in low-resource settings. Int J Gynaecol Obstet. 2012;117(2):108–118. doi: 10.1016/j.ijgo.2012.03.001.
- Zhu L, Zhang R, Zhang S, et al. [Chinese neonatal birth weight curve for different gestational age]. Zhonghua Er Ke Za Zhi. 2015;53(2):97–103.
- Simon LV, Hashmi MF, Bragg BN. APGAR score. Treasure Island (FL): statPearls; 2023.
- Zou G. A modified poisson regression approach to prospective studies with binary data. Am J Epidemiol. 2004;159(7):702–706. doi: 10.1093/aje/kwh090.
- Kugishima Y, Yasuhi I, Yamashita H, et al. Risk factors associated with the development of postpartum diabetes in japanese women with gestational diabetes. BMC Pregnancy Childbirth. 2018;18(1):19. doi: 10.1186/s12884-017-1654-4.
- Liu H, Zhang S, Wang L, et al. Fasting and 2-hour plasma glucose, and HbA1c in pregnancy and the postpartum risk of diabetes among chinese women with gestational diabetes. Diabetes Res Clin Pract. 2016;112:30–36. doi: 10.1016/j.diabres.2015.11.007.
- Hiersch L, Shah BR, Berger H, et al. Oral glucose tolerance test results in pregnancy can be used to individualize the risk of future maternal type 2 diabetes mellitus in women with gestational diabetes mellitus. Diabetes Care. 2021;44(8):1860–1867. doi: 10.2337/dc21-0659.
- Landon MB, Mele L, Spong CY, et al. The relationship between maternal glycemia and perinatal outcome. Obstet Gynecol. 2011;117(2 Pt 1):218–224. doi: 10.1097/AOG.0b013e318203ebe0.
- American diabetes A: 2. Classification and diagnosis of diabetes: standards of medical care in diabetes-2021. Diabetes Care. 2021;44(Suppl 1):S15–S33.
- Anastasiou E, Vasileiou V, Athanasiadou A, et al. Phenotypic and metabolic characteristics of women with isolated hyperglycemia in pregnancy-is the time-point important? Diabetes Res Clin Pract. 2010;90(3):333–338. doi: 10.1016/j.diabres.2010.08.024.
- Faerch K, Borch-Johnsen K, Holst JJ, et al. Pathophysiology and aetiology of impaired fasting glycaemia and impaired glucose tolerance: does it matter for prevention and treatment of type 2 diabetes? Diabetologia. 2009;52(9):1714–1723. doi: 10.1007/s00125-009-1443-3.
- Rizza RA. Pathogenesis of fasting and postprandial hyperglycemia in type 2 diabetes: implications for therapy. Diabetes. 2010;59(11):2697–2707. doi: 10.2337/db10-1032.
- Bellamy L, Casas JP, Hingorani AD, et al. Type 2 diabetes mellitus after gestational diabetes: a systematic review and meta-analysis. Lancet. 2009;373(9677):1773–1779. doi: 10.1016/S0140-6736(09)60731-5.
- Retnakaran R, Shah BR. Mild glucose intolerance in pregnancy and risk of cardiovascular disease: a population-based cohort study. CMAJ. 2009;181(6–7):371–376. doi: 10.1503/cmaj.090569.