
Abstract
Introduction
Establishing reference ranges for central airway parameters and exploring their influencing factors in Han Chinese non-smoking adults.
Methods
This prospective cross-sectional study was conducted on Han Chinese non-smoking adults who underwent chest CT scans at the Tongzhou Campus of Dongzhimen Hospital Affiliated with the Beijing University of Chinese Medicine between September 2022 and November 2022. The SYNAPSE 3D image analysis software was utilized, enabling the extraction of critical parameters such as central airway length, airway wall thickness (AWT), airway lumen area (ALA), and subcarinal angle (SCA). Pearson’s correlation coefficient analysis and multiple linear regression analysis methods were employed to evaluate the relationship between central airway parameters and age, sex, weight, and height.
Results
The study encompassed 888 Han Chinese non-smoking adults, comprising 456 females and 432 males. Significant sex differences were noted in central airway length, AWT, and ALA, with measurements in males exceeding those in females (p < 0.01) with no significant difference in SCA. Correlation analyses unveiled relationships between central airway parameters and age, sex, weight, and height. During multiple linear regression analyses, no conclusive evidence emerged to demonstrate the independent or combined explanatory or predictive capacity of the aforementioned variables for central airway length and SCA. Although sex has a significant impact on AWT and ALA, its capability in explanation or prediction remains limited. The conclusions drawn from the primary analysis receive reinforcement from the outcomes of sensitivity analyses.
Conclusion
Establishing the distribution range of central airway parameters in non-smoking Han Chinese adults. It observed significant sex differences in these parameters, except for the SCA. However, the study found that the predictive or explanatory power of age, sex, weight, and height for central airway parameters was either limited or non-significant.
1. Introduction
The structure and function of the central airway are critical to maintaining respiratory health [Citation1]. Three-dimensional (3D) imaging is an accurate and non-invasive assessment tool to effectively evaluate the dimensions of the central airway. For central airway disorders such as tracheal stenosis, trauma, or tumors [Citation2, Citation3], accurate anatomical information is not only crucial for the optimization of therapeutic options such as tracheal resection and reconstruction, bronchial ablation therapy [Citation4, Citation5] but also beneficial for the improvement of the design of medical devices like tracheal stents and double-lumen tubes [Citation6, Citation7]. In addition, reference values for the normal dimensions of the central airway are of great significance to radiologists, anaesthesiologists, and otolaryngologists.
Several studies have examined parameters in the central airways of adults, including the length of the trachea and main bronchus, the inner diameter of the lumen, and the subcarinal angle (SCA) [Citation8–11]. However, to our knowledge, central airway parameters in Han Chinese non-smoking adults have not been fully assessed using 3D imaging technology, especially in terms of central airway lumen area(ALA) and airway wall thickness(AWT). Additionally, past assessments of these parameters were limited to a few points of the central airway and did not provide a comprehensive description. Lastly, previous measurements of central airway parameters were based on autopsy, two-dimensional computed tomography (CT) imaging, or bronchoscopy [Citation12–14]. Compared to these methods, 3D imaging technology offers a more objective display of the structure of the tracheobronchial tree, potentially yielding more accurate measurements.
Here, we utilized a 3D imaging workstation to reconstruct and measure the tracheal tree in Han Chinese non-smoking adults. We aimed to document normal measurements of central airway length, AWT, ALA, and SCA, by the rule of eight zones of the central airway [Citation15]. Furthermore, we sought to investigate the relationships between these central airway parameters and factors such as sex, age, height, and weight, using correlation and multiple linear regression analyses.
2. Population and methods
2.1. Study population
From September to November 2022, we collected imaging data from 1,037 individuals who underwent chest CT scans as part of the preventative measures against novel coronavirus pneumonia. Upon applying the exclusion criteria detailed (Figure S1), we ultimately included 888 cases in the study. Baseline information, including age, sex, height, and weight, was collected for all examinees. Notably, while all examinees self-reported as non-smokers, we could not verify their exposure to secondhand smoke. Data from these examinees were only included in the study after obtaining explicit written consent, in strict adherence to the ethical principles set forth in the Declaration of Helsinki.
2.2. Image acquisition
All examinees performed standardized breathing exercises before the chest CT scan. The protocol included three deep breaths followed by a 10-second breath-hold during image acquisition. Positioned supine, with arms raised above their heads, they were coached by a technician to ensure uniformity in the procedure. The CT scan was performed using a UNITED IMAGING uCT 528 machine (United Imaging Healthcare Technology Co., Ltd, Shanghai, China) with the following parameters: collimation − 40 × 0.625 mm, pitch − 1.1750 mm, digital matrix − 512 × 512 pixels, tube voltage − 120 kV with automatic tube current technology, and rotation time − 0.75 s. The resulting CT images were stored in the hospital’s image database in DICOM format.
2.3. Parameter measurement
This study aims to measure three parameters of the airways: airway length(in mm), AWT(in mm), and ALA(in mm2). Specifically, we assessed the length of seven major airway sites, which include the trachea, right main bronchus(RMB), right superior lobe bronchus(RSLB), right middle lobe bronchus(RMLB), left main bronchus(LMB), left superior lobe bronchus(LSLB), and left inferior lobe bronchus(LILB). Following our established guidelines for dividing the central airway (Figure S2) [Citation15], we measured the AWT and ALA at seven specific locations, including zones I to III and V to VIII (midpoint position of each zone) within the central airway. Additionally, we quantified the SCA (in degrees).
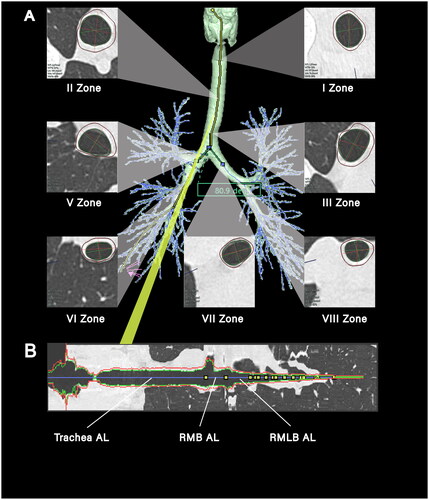
Airway parameters were measured in the study through 3D reconstruction of the airway tree from CT images using SYNAPSE 3D, an image analysis software developed by Fujifilm Medical Co., Ltd, Tokyo, Japan () [Citation16, Citation17]. The airway centreline was constructed using the minimum spanning tree generated by SYNAPSE 3D. The airway length was measured directly or indirectly (, Table S1). Additionally, the inner and outer contours of the seven selected airway locations were extracted using the graph cut method to calculate AWT and ALA (). The SCA was determined by measuring the airway centreline angles of the right and left main bronchus ().
Figure 1. Diagram of central airway measurement. (A) A three-dimensional reconstruction of the tracheobronchial tree from a 25-year-old female, presenting cross-sectional views of zones I-III and V-VIII. Annotations in the lower left corner of each section provide the mean airway wall thickness (AWT in mm) and airway luminal area (ALA in mm2). Subcarinal angle (SCA in degrees) is denoted in the green box, measured at 80.9 degrees; (B) a longitudinal cross-section matched to the yellow line in (a), with the blue line marking the measurement path along the airway’s length. Progressing from the left, the first yellow marker on the blue trajectory signifies the division into the right and left main bronchi, the second marker signals the entry to the right lung’s upper lobe, and the third marker delineates the convergence points to the right lung’s middle and lower lobes. ‘AL’ refers to airway length, ‘RMB’ is an abbreviation for the right main bronchus, and ‘RMLB’ represents the right middle lobar bronchus.
2.4. Statistical analysis
The data are presented in the format of mean ± standard deviation. Unpaired Student’s t-tests were utilized to compare differences between sexes. Following sex-based grouping, dispersion bar charts were employed to display the distribution of age, height, and weight. Box plots were utilized to demonstrate airway parameter distribution and reference ranges. Outliers were excluded and substituted with means. Pearson’s correlation coefficients were employed to analyze the associations between airway parameters and age, sex, weight, and height, with the results presented in heat maps. Multiple linear regression analyses were conducted to evaluate the independent predictive capability of the aforementioned variables for airway parameters. The level of statistical significance was defined at p < 0.05.
In correlation and multiple linear regression analyses, we replaced outliers with mean values to address the issue of outliers. We utilized the akaike information criterion (AIC) to guide model selection. Subsequently, we conducted sensitivity analyses by performing two sets of correlation and multiple linear regression analyses. The first set was completed without replacing the outliers, while the second set involved replacing the outliers with medians.
Statistical analyses and graphical representations were performed using R-studio version 2022.12.0 + 353 (https://posit.co/downloads/) of R4.2.2 (https://www.r-project.org/). The following packages were utilized for the study: ‘reshape2’, ‘ggbeeswarm’,’ggplot2’,’dplyr’, ‘car’, and ‘writexl’.
3. Results
A total of 888 examinees (456 female and 432 male) were included in the study (Figure S1). The baseline information of the examinees, including age, height, and weight, are shown in . The examinees had an age range of 19 to 92 years, height range of 140 cm to 189 cm, and weight range of 40 kg to 129 kg. There was no significant difference in age between female and male examinees (55.87 ± 15.00 years vs. 57.19 ± 15.55 years, p = 0.199). However, there were significant differences in height (female vs. male, 160.30 ± 5.31 cm vs. 171.59 ± 6.05 cm, p < 0.001) and weight (female vs. male, 62.38 ± 10.35 kg vs. 74.63 ± 12.55 kg, p < 0.001).
Figure 2. The demographics of the entire study Population and a comparison of males and females. (A) (B) (C) are divergent bar charts displaying the distribution of age, height, and weight, respectively, among the 888 examinees included in the study, categorized by sex. The inset tables in the lower left corner of each chart detail the mean, median, and standard deviation (SD) and the range [minimum, maximum] for each examinee. Additionally, the tables provide P-values for assessing statistical differences in age, height, and weight between male and female examinees.
![Figure 2. The demographics of the entire study Population and a comparison of males and females. (A) (B) (C) are divergent bar charts displaying the distribution of age, height, and weight, respectively, among the 888 examinees included in the study, categorized by sex. The inset tables in the lower left corner of each chart detail the mean, median, and standard deviation (SD) and the range [minimum, maximum] for each examinee. Additionally, the tables provide P-values for assessing statistical differences in age, height, and weight between male and female examinees.](/cms/asset/9b26fb9a-649b-4a14-a69a-843e4f010a4d/iann_a_2316258_f0002_c.jpg)
3.1. Airway structural parameters
present the range of variation in the airway parameters of the examinees. These variations are visually represented through box plots. Except for the SCA, there was no significant difference between the sexes. However, the values of airway parameters, including airway length, AWT, and ALA, were significantly higher in males compared to females. (all p < 0.001). Furthermore, the study cohort had relatively small coefficients of variation (CV = standard deviation/mean*100%) for tracheal length, LMB length, and SCA, whereas the other parameters had rather significant coefficients of variation (Table S2).
Figure 3. Comparative airway lengths and SCA by sex. The figure presents a series of box-and-whisker plots with superimposed individual data points, delineating the distribution of airway lengths in millimeters (mm) across various segments: trachea, right main bronchus (RMB), right superior lobar bronchus (RSLB), right middle lobar bronchus (RMLB), left main bronchus (LMB), left superior lobar bronchus (LSLB), and left inferior lobar bronchus (LILB). Additionally, the subcarinal angle (SCA) is depicted in degrees (deg). Data are stratified by sex, with each plot detailing the mean ± standard deviation (SD) and the median along with the range [minimum, maximum] for females (N = 456, in red) and males (N = 432, in blue). Levels of statistical significance are marked by asterisks (*** for p < 0.001); ‘NS’ indicates a lack of significant difference.
![Figure 3. Comparative airway lengths and SCA by sex. The figure presents a series of box-and-whisker plots with superimposed individual data points, delineating the distribution of airway lengths in millimeters (mm) across various segments: trachea, right main bronchus (RMB), right superior lobar bronchus (RSLB), right middle lobar bronchus (RMLB), left main bronchus (LMB), left superior lobar bronchus (LSLB), and left inferior lobar bronchus (LILB). Additionally, the subcarinal angle (SCA) is depicted in degrees (deg). Data are stratified by sex, with each plot detailing the mean ± standard deviation (SD) and the median along with the range [minimum, maximum] for females (N = 456, in red) and males (N = 432, in blue). Levels of statistical significance are marked by asterisks (*** for p < 0.001); ‘NS’ indicates a lack of significant difference.](/cms/asset/43679a5c-2ff0-4bd7-a680-da1dbd64254d/iann_a_2316258_f0003_c.jpg)
Figure 4. Comparative AWT by sex. This figure features a series of box-and-whisker plots with superimposed individual data points, displaying the distribution of airway wall thickness (AWT) in millimeters (mm) for seven zones: I zone, II zone, III zone, V zone, VI zone, VII zone, and VIII zone. The plots are color-coded to differentiate between female (N = 456, in red) and male (N = 432, in blue) examinees, with each plot providing detailed statistics including mean ± standard deviation (SD), median, and the range [minimum, maximum]. Significant differences between sexes are indicated by asterisks (*** for p < 0.001).
![Figure 4. Comparative AWT by sex. This figure features a series of box-and-whisker plots with superimposed individual data points, displaying the distribution of airway wall thickness (AWT) in millimeters (mm) for seven zones: I zone, II zone, III zone, V zone, VI zone, VII zone, and VIII zone. The plots are color-coded to differentiate between female (N = 456, in red) and male (N = 432, in blue) examinees, with each plot providing detailed statistics including mean ± standard deviation (SD), median, and the range [minimum, maximum]. Significant differences between sexes are indicated by asterisks (*** for p < 0.001).](/cms/asset/cc06a37c-2d71-4b2f-88aa-371ee12878fa/iann_a_2316258_f0004_c.jpg)
Figure 5. Comparative ALA by sex. This figure features a series of box-and-whisker plots with superimposed individual data points, displaying the distribution of airway lumen area (ALA) in square millimeters (mm2) for seven zones: I zone, II zone, III zone, V zone, VI zone, VII zone, and VIII zone. The plots are color-coded to differentiate between female (N = 456, in red) and male (N = 432, in blue) examinees, with each plot providing detailed statistics including mean ± standard deviation (SD), median, and the range [minimum, maximum]. Significant differences between sexes are indicated by asterisks (*** for p < 0.001).
![Figure 5. Comparative ALA by sex. This figure features a series of box-and-whisker plots with superimposed individual data points, displaying the distribution of airway lumen area (ALA) in square millimeters (mm2) for seven zones: I zone, II zone, III zone, V zone, VI zone, VII zone, and VIII zone. The plots are color-coded to differentiate between female (N = 456, in red) and male (N = 432, in blue) examinees, with each plot providing detailed statistics including mean ± standard deviation (SD), median, and the range [minimum, maximum]. Significant differences between sexes are indicated by asterisks (*** for p < 0.001).](/cms/asset/c10cdad0-2918-4e5f-a849-209344aa3eab/iann_a_2316258_f0005_c.jpg)
3.2. Correlation analysis
Correlation analyses were conducted after replacing all airway parameters’ outliers () with mean values. The results of the correlation analysis between age, sex, weight, height, and airway parameters are presented in . A correlation coefficient (r) with an absolute value greater than 0.2 indicated a correlation.
Figure 6. Correlation analysis of airway structural parameters and influencing factors (mean values). This heatmap depicts the correlation coefficients reflecting the strength and direction of associations between comprehensive airway structural parameters—airway lumen area (ALA) and airway wall thickness (AWT) across seven zones (I, II, III, V, VI, VII, VIII), the subcarinal angle (SCA), and the airway lengths(AL) (trachea, right main bronchus (RMB), right superior lobar bronchus (RSLB), right middle lobar bronchus (RMLB), left main bronchus (LMB), left superior lobar bronchus (LSLB), and left inferior lobar bronchus (LILB))—and influencing factors (age, height, weight) in both female and males. The color gradient encodes the correlation’s nature and strength: reds indicate positive correlations, with darker hues signifying stronger positive relationships, and blues represent negative correlations, with deeper blues denoting stronger negative relationships. Each cell specifies the correlation coefficient and asterisks (*) mark statistical significance at p < 0.05. The color scale on the side provides a reference from -1.0, indicative of a strong negative correlation, to +1.0, indicative of a strong positive correlation.
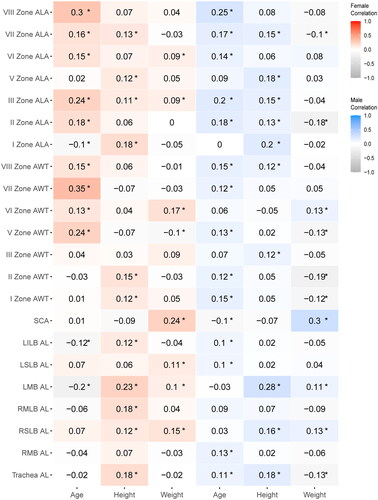
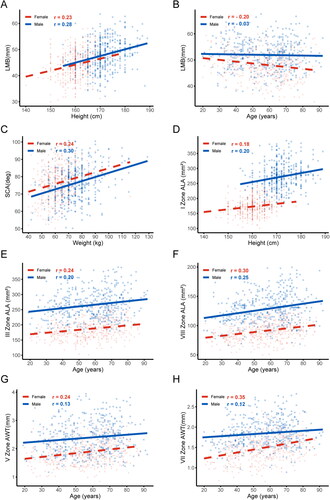
Regarding airway length, there was a positive correlation between height and LMB length in both males and females (female, r = 0.23, p < 0.05; male, r = 0.28, p < 0.05) (). However, age negatively correlated with LMB length in females (r = −0.2, p < 0.05) (). Regarding the SCA, both weight were positively associated with the SCA in both males and females (female, weight r = 0.24, p < 0.05; male, weight r = 0.3, p < 0.05) (). As for ALA, male height positively correlated with ALA in airway zone I (r = 0.2, p < 0.05) (). Age exhibited a positive correlation with ALA in airway zones III and VIII for both sexes (female, r = −0.24 in zone III and r = −0.3 in zone VIII, both p < 0.05; male, r = −0.2 in zone III and r = −0.25 in zone VIII, both p < 0.05) (). In females, age showed a positive correlation with AWT in zones V and VII of the airway (r = 0.24 for zone V and r = 0.35 for zone VII, both p < 0.05) ().
Figure 7. Relationships with absolute values of correlation coefficients greater than 0.2. (A) The relationship between LMB length and height; (B) The relationship between LMB length and age; (C) The relationship between SCA and weight; (D) The relationship between ALA in Zone I and height; (E) The relationship between ALA in Zone III and age; (F) The relationship between ALA in Zone VIII and age; (G) The relationship between AWT in Zone V and age; (H) The relationship between AWT in Zone VII and age. Data for females (red triangles) and males (blue circles) are indicated separately. Abbreviations: left main bronchus (LMB), the subcarinal angle (SCA), airway lumen area (ALA), airway wall thickness (AWT), and correlation coefficient (r).
3.3. Multiple linear regression analysis
Following the variance inflation factor (VIF) test on the independent variables, which include age, sex, height, and weight (Table S3), present the outcomes of multivariate linear regression analyses conducted on airway parameters such as airway length, SCA, AWT, and ALA using the aforementioned variables.
Table 1. Multiple linear regression analysis of AL and SCA.
Table 2. Multiple linear regression analysis of AWT.
Table 3. Multiple linear regression analysis ALA.
Although specific variables showed statistical significance in the multiple linear regression analysis, they did not sufficiently predict or explain the variations in airway length and the SCA. This was evident from a comprehensive analysis of the R2 and β values (). Regarding AWT and ALA, thicker AWT and more significant ALA were significantly associated with males, whereas thinner airway WT and smaller ALA were significantly associated with females ( and ). Notably, weight did not demonstrate a positive association with ALA ().
3.4. Akaike information criterion
In our rigorous evaluation of the influence of age, sex, weight, and height on AWT and ALA, we applied the AIC to guide model selection. Lower AIC values indicate a preferable model due to a better balance between explanatory power and model simplicity. presents the AIC values for age, sex, weight, and height as independent predictors across each subclass of AWT and ALA. Notably, sex consistently demonstrated the lowest AIC values across the subclasses.
Table 4. AIC values from univariable models for subcategories of AWT and ALA.
3.5. Sensitivity analysis
In Figures S3–S4 and Tables S4–S5, we present the results of our sensitivity analyses using two sets of correlations and multiple linear regression analyses. The findings from our sensitivity analyses align closely with the results obtained from the primary analyses.
4. Discussion
This study establishes the reference range for airway parameters in Han Chinese non-smoking adults, including the length of the trachea and six major bronchi, the angle of the SCA, and measurements of AWT and ALA at seven specific sites (), as dictated by the ‘rule of eight zones of the central airway’(Figure S2). Furthermore, this study investigates the correlations between the examinees’ age, sex, weight, and height, and the aforementioned airway parameters (). It was found that age, sex, weight, and height were not significant predictors for variations in airway length and SCA (). Regarding AWT and ALA, although sex showed a notable influence, its predictive power was relatively limited ( and ).
In previous studies, Mi et al. [Citation11, Citation13] measured the lengths of the central airways in Chinese adults using chest CT scans. Our comparison revealed that the lengths of the trachea, RMB, and RSLB were longer than those reported in Mi et al.’s study. However, the RMLB was shorter, and the length of the LMB was similar. These differences could be attributed to variations in measurement methods. Unlike Mi et al. who measured directly from coronal CT images, we employed 3D reconstruction technology to assess the central axis length of the tracheobronchial tree airways (), minimizing random errors from different starting points and coronal image positions, and reducing systematic errors related to airway curvature and the angles between the trachea and the coronal plane [Citation4]. In contrast to Ge et al.’s study [Citation14], which used bronchoscopy to measure central airway lengths in Chinese adults, our study found a shorter tracheal length but a longer main bronchus length. This discrepancy can be explained by two factors: (1) Ge et al. defined the tracheal length from the vocal cords to the carina, which may have led to longer measurements; (2) their method of estimating the length of central airways indirectly by measuring between two markers on the bronchoscope made it difficult to accurately locate the carina, potentially leading to underestimations of the main bronchi lengths. Significant differences in central airway lengths between males and females were observed (), and height and age appeared to be related to some central airway segment lengths (), yet multivariate linear regression analysis showed that age, sex, height, and weight did not explain these variations (). This finding aligns with Mi et al.’s conclusions, suggesting significant individual differences in tracheobronchial lengths (Table S2). Additionally, our study is the first to report the lengths of the LSLB and LILB in Han Chinese non-smoking adults.
In terms of SCA, this study found no significant sex differences (), which contradicts the conclusions of previous studies that used direct chest CT measurements. Mi et al. [Citation13] measured the right bronchial angle (RA) and left bronchial angle (LA) in Chinese adults and found that females had a significantly greater SCA (sum of RA and LA) than males (female vs. male, 36.0 ± 8.1 vs. 34.0 ± 7.8 for RA and 44.1 ± 8.6 vs. 41.2 ± 8.9 for LA, p < 0.001). Similarly, Kahraman et al. [Citation18] conducted measurements in Turkish adults and supported this conclusion (female vs. male SCA: 75.8 ± 14.7 vs. 71.9 ± 12.9, p < 0.001). In our study, we utilized 3D reconstruction technology to model the tracheobronchial tree and determined SCA by measuring the angle between the midlines of the main bronchial lumens (). This method not only significantly reduces measurement errors inherent in 2D chest CT imaging but also provides more accurate results that reflect clinical realities, such as the actual pathways during the use of airway devices, intubation, or other airway-related surgeries [Citation4, Citation6, Citation7]. However, our study did not independently measure RA and LA, which may limit a comprehensive analysis of sex differences. Additionally, we considered the factor of weight, which was not accounted for in previous research [Citation19], and found a positive correlation between SCA and weight (). Despite this correlation, multivariate linear regression analysis indicated that weight does not significantly predict changes in SCA ().
Previous studies have not extensively reported on the measurements of the central airway’s ALA and AWT in adults. Regarding ALA, past research typically relied on chest X-rays or CT images to measure the anteroposterior and transverse diameters of the central airways [Citation11, Citation13, Citation20–22]. Ulusoy et al. [Citation23], for instance, measured these diameters in the trachea of Turkish adults (10 mm above the carina) using chest CT images and calculated the trachea’s ALA based on these measurements. In contrast, our study directly measured and recorded the ALA at three distinct positions in the trachea (Zones I-III) and the ALA of the RMB, LMB, and RMLB (Zones V-VIII) (Figure S2). This approach provides a more comprehensive understanding of the central airway’s ALA. As for AWT, previous research has primarily been concerned with specific respiratory diseases, focusing on changes in small and medium airway AWT in patients with chronic obstructive pulmonary disease, asthma, or chronic cough [Citation24–28]. Some studies have also explored the impact of smoking, occupational, and allergen exposures on AWT [Citation29–31]. Nonetheless, there is limited research on the AWT of the central airway in adults. To our knowledge, our study is the first to report on the ALA and AWT of the central airway in Han Chinese non-smoking adults. We also observed correlations between sex, age, and height with ALA and AWT in certain areas of the central airway ( and ). Sex was found to have the most significant impact on ALA and AWT (). However, it is important to note that sex alone does not fully predict the variations in ALA and AWT ( and ).
Our study provides valuable insights to enhance several clinical practices. Firstly, we recommend the preference for left-sided double-lumen tubes due to the differences in length between the right and left main bronchi. This choice can offer an additional safety advantage. Secondly, our data support the precision of assessing the degree of central airway stenosis and help customize individualized stents suitable for patients. Lastly, our findings can serve as a reference for precise guidance during interventions in the central airway, such as cryotherapy, laser therapy, and photodynamic therapy. This guidance can aid in selecting the appropriate operation depth and position, ultimately reducing the risk of complications like airway fistula [Citation5, Citation32]. However, our study has several limitations that should be considered. Firstly, the data was collected from a single institution. Therefore, future multicenter studies are needed to confirm the applicability and reliability of our findings in more diverse populations. Secondly, although trained observers conducted the measurements, we still need to formally assess the reliability between observers, which could affect the reproducibility of our results. Thirdly, it is essential to acknowledge that second-hand smoke and occupational exposure may have influenced the airway parameters.
5. Conclusions
This study conducted a comprehensive investigation of central airway parameters in non-smoking Han Chinese adults using 3D image reconstruction. Although multivariate regression analysis indicated that age, sex, weight, and height have limited or non-significant predictive capability for central airway parameters, the determination of central airway measurements still holds significant clinical importance and practical value in the diagnosis and treatment of pulmonary diseases, optimization of medical imaging technologies, and airway interventional treatments.
Authors contributions
Liu Yan: Acquisition of data, design of the study, drafting the article, critical revision, and approval of the final version. Teng Jun: Analysis of data, conceived and design of the study, drafting of the article, critical revision, and approval of the final version. Mei Jian: Acquisition of data, read and approved the manuscript. Chen Chao: Collection of data, critical revision, and approval of the final version. Xu Qian-qian: Collection of data and approval of the final version. Zhou Cui: Critical revision and approval of the final version. Deng Kang-li: Critical revision and approved the manuscript. Wang Hong-wu: Design of the study, agreement to be accountable for all aspects of the manuscript in ensuring that questions related to the accuracy or integrity of any part of the manuscript are appropriately investigated and resolved, read, and approved.
Consent for publication
All authors agree to the publication of this article.
Institutional review board statement
The Ethics Committee of Dongzhimen Hospital is Affiliated with the Beijing University of Chinese Medicine (Project ID: 2022DZMEC-316-03).
Informed consent statement
All examinees were fully informed of the study and gave their informed written consent before participation. The Declaration of Helsinki conducted this study.
Supplemental Material
Download Zip (3.8 MB)Acknowledgements
We also thank OpenAI for granting us access to their language model, ChatGPT, which assisted us in improving the language quality of this paper.
Disclosure statement
The authors declare no conflict of interest.
Data availability statement
The data that support the findings of this study are available from the corresponding author upon reasonable request.
Additional information
Funding
References
- Murgu SD, Egressy K, Laxmanan B, et al. Central airway obstruction: benign strictures, tracheobronchomalacia, and malignancy-related obstruction. Chest. 2016;150(2):1–14. doi: 10.1016/j.chest.2016.02.001.
- Oberg CL, Holden VK, Channick CL. Benign central airway obstruction. Semin Respir Crit Care Med. 2018;39(6):731–746. doi: 10.1055/s-0038-1676574.
- Mudambi L, Miller R, Eapen GA. Malignant central airway obstruction. J Thorac Dis. 2017;9(Suppl 10):S1087–S1110. doi: 10.21037/jtd.2017.07.27.
- Matsuoka S, Shimizu K, Koike S, et al. Significance of the evaluation of tracheal length using a three-dimensional imaging workstation. J Thorac Dis. 2022;14(11):4276–4284. doi: 10.21037/jtd-22-595.
- Bilaçeroğlu S. Endobronchial ablative therapies. Clin Chest Med. 2018;39(1):139–148. doi: 10.1016/j.ccm.2017.11.008.
- Li L, Zhang X, Shi J, et al. Airway stents from now to the future: a narrative review. Respiration. 2023;102(6):439–448. doi: 10.1159/000530421.
- Marchant BE, Morris BN, Royster RL. The video double-lumen tube: does it have a future? J Thorac Dis. 2023;15(5):2385–2388. doi: 10.21037/jtd-23-309.
- Chalwadi UK, Swamy N, Agarwal A, et al. Determining normal values for lower trachea and bronchi size in children by computed tomography (CT). Pediatr Pulmonol. 2021;56(9):2940–2948. doi: 10.1002/ppul.25536.
- Kuo W, Ciet P, Andrinopoulou ER, et al. Reference values for central airway dimensions on CT images of children and adolescents. AJR Am J Roentgenol. 2018;210(2):423–430. doi: 10.2214/AJR.17.18597.
- Liu Z, Liu M, Zhao L, et al. Comparison of the accuracy of three methods measured the length of the right main stem bronchus by chest computed tomography as a guide to the use of right sided double-lumen tube. BMC Anesthesiol. 2022;22(1):264. doi: 10.1186/s12871-022-01744-z.
- Chen Y, Guo Y, Mi W, et al. Anatomy of the right upper lobe revisited and clinical considerations in Chinese population. Lin J, ed. PLoS One. 2020;15(11):e0242178. doi: 10.1371/journal.pone.0242178.
- Martín-Ruiz S, Gutiérrez-Collar C, Forcén Vicente De Vera E, et al. The bronchial segmentation and its anatomical variations. A clinical-anatomic and bronchoscopy study. Ann Anat. 2021;235:151677. doi: 10.1016/j.aanat.2021.151677.
- Mi W, Zhang C, Wang H, et al. Measurement and analysis of the tracheobronchial tree in Chinese population using computed tomography. Wei H, ed. PLoS One. 2015;10(4):e0123177. doi: 10.1371/journal.pone.0123177.
- Ge X, Huang H, Bai C, et al. The lengths of trachea and main bronchus in Chinese shanghai population. Sci Rep. 2021;11(1):2168. doi: 10.1038/s41598-021-81744-0.
- Wang H, Li W, Wang Z, et al. Chinese expert consensus on interventional diagnosis and management of acquired digestive‐respiratory tract fistulas (second edition). Clin Respir J. 2023;17(5):343–356. doi: 10.1111/crj.13607.
- Nishimoto K, Karayama M, Inui N, et al. Relationship between fraction of exhaled nitric oxide and airway morphology assessed by three-dimensional CT analysis in asthma. Sci Rep. 2017;7(1):10187. doi: 10.1038/s41598-017-10504-w.
- Karayama M, Inui N, Mori K, et al. Respiratory impedance is correlated with morphological changes in the lungs on three-dimensional CT in patients with COPD. Sci Rep. 2017;7(1):41709. doi: 10.1038/srep41709.
- Kahraman Ş, Yazar MF, Aydemir H, et al. Detection of tracheal branching with computerized tomography: the relationship between the angles and age-gender. World J Radiol. 2023;15(4):118–126. doi: 10.4329/wjr.v15.i4.118.
- Coşkun ZK, Atalar K, Akar B. Systematic literature study of trachea and bronchus morphology in children and adults. Folia Morphol (Warsz). 2022;82(3):457–466. doi: 10.5603/FM.a2022.0073.
- Breatnach E, Abbott G, Fraser R. Dimensions of the normal human trachea. AJR Am J Roentgenol. 1984;142(5):903–906. doi: 10.2214/ajr.142.5.903.
- Lee JW, Son JS, Choi JW, et al. The comparison of the lengths and diameters of main bronchi measured from two-dimensional and three-dimensional images in the same patients. Korean J Anesthesiol. 2014;66(3):189–194. doi: 10.4097/kjae.2014.66.3.189.
- Kim D, Son JS, Ko S, et al. Measurements of the length and diameter of main bronchi on three-dimensional images in Asian adult patients in comparison with the height of patients. J Cardiothorac Vasc Anesth. 2014;28(4):890–895. doi: 10.1053/j.jvca.2013.05.029.
- Ulusoy M, Uysal II, Kıvrak AS, et al. Age and gender related changes in bronchial tree: a morphometric study with multidedector CT. Eur Rev Med Pharmacol Sci. 2016;20(16):3351–3357.
- Weikert T, Friebe L, Wilder-Smith A, et al. Automated quantification of airway wall thickness on chest CT using retina U-Nets – performance evaluation and application to a large cohort of chest CTs of COPD patients. Eur J Radiol. 2022;155:110460. doi: 10.1016/j.ejrad.2022.110460.
- Choi S, Hoffman EA, Wenzel SE, et al. Quantitative assessment of multiscale structural and functional alterations in asthmatic populations. J Appl Physiol (1985). 2015;118(10):1286–1298. doi: 10.1152/japplphysiol.01094.2014.
- Matsumoto H, Niimi A, Tabuena RP, et al. Airway wall thickening in patients with cough variant asthma and nonasthmatic chronic cough. Chest. 2007;131(4):1042–1049. doi: 10.1378/chest.06-1025.
- Hoshino M, Ohtawa J. Effects of tiotropium and salmeterol/fluticasone propionate on airway wall thickness in chronic obstructive pulmonary disease. Respiration. 2013;86(4):280–287. doi: 10.1159/000351116.
- Sadeghdoust M, Mirsadraee M, Aligolighasemabadi F, et al. Effect of azithromycin on bronchial wall thickness in severe persistent asthma: a double-blind placebo-controlled randomized clinical trial. Respir Med. 2021;185:106494. doi: 10.1016/j.rmed.2021.106494.
- Washko GR, Diaz AA, Kim V, et al. Computed tomographic measures of airway morphology in smokers and never-smoking normals. J Appl Physiol (1985). 2014;116(6):668–673. doi: 10.1152/japplphysiol.00004.2013.
- Safak AA, Arbak P, Yazici B, et al. Bronchial wall thickness in toll collectors. Ind Health. 2010;48(3):317–323. doi: 10.2486/indhealth.48.317.
- Liu L, Li G, Sun Y, et al. Airway wall thickness of allergic asthma caused by weed pollen or house dust mite assessed by computed tomography. Respir Med. 2015;109(3):339–346. doi: 10.1016/j.rmed.2014.11.011.
- Madariaga MLL, Gaissert HA. Overview of malignant tracheal tumors. Ann Cardiothorac Surg. 2018;7(2):244–254. doi: 10.21037/acs.2018.03.04.