
Abstract
Background
We aimed to investigate the associations between thyroid hormone sensitivity indices and diabetes in euthyroid adults in the United States and China.
Methods
2296 euthyroid adults from the NHANES in the United States and 8319 euthyroid adults from the SPEED-Shunde in China were involved. The thyroid sensitivity indices, namely TFQIFT4 and TFQIFT3, were calculated. Multivariable logistic regression, restricted cubic spline analysis, and general ordinal logit regression were utilized.
Results
In the NHANES, compared with participants in quartile 1st (Q1), those in Q4 of TFQIFT3 (OR 2.12, 95% CI (1.18, 3.81)) and those in Q3 of TFQIFT4 (OR 2.31, 95% CI (1.18, 4.53)) (both P for trend < 0.05) were associated with a greater prevalence of diabetes. In the SPEED-Shunde, compared with participants in Q1, those in Q4 of TFQIFT3 had a greater prevalence of diabetes (OR 1.36, 95% CI (1.11, 1.66) (P for trend < 0.05), while no significant associations between TFQIFT4 and diabetes were found.
Conclusions
TFQIFT3 was associated with a higher prevalence of diabetes both in the United States and China. However, TFQIFT4 was only associated with a higher prevalence of diabetes in the United States, not in China. Further prospective cohort studies are necessary to validate these findings.
Introduction
Diabetes has become a critical global health problem due to its high prevalence and associated disability and mortality. The prevalence of diabetes in China, the USA, and worldwide was 11.7%, 11.6% and 6.1% [Citation1,Citation2], respectively, resulting in global health expenditure of US$966 billion globally, forecast to reach more than $1054 billion by 2045 [Citation2]. Thyroid hormones (THs) and thyroid-stimulating hormone (TSH) have been widely recognized as significant endocrine regulators of glucose metabolism [Citation3,Citation4]. The presence of both hypothyroidism and hyperthyroidism has been proposed to be linked to the development of diabetes [Citation5,Citation6]. Significant associations were also found between subclinical hypothyroidism or hyperthyroidism with metabolic health [Citation7,Citation8]. However, the metabolic mechanisms previously elucidated in clinical or subclinical thyroid diseases may not comprehensively explain the observed associations within the normothyroid range.
Recent findings indicate a prevalent occurrence of relatively elevated levels of both TSH and THs in euthyroid adults, suggesting impaired central sensitivity to THs [Citation9,Citation10], although there is a physiologically inverse correlation between FT4 and FT3 with TSH due to a negative feedback loop [Citation11]. Laclaustra et al. have proposed a novel thyroid feedback quantile-based index (TFQI) that explicitly targets deviations from normal thyroid hormone values (rather than extreme ranges) to identify impaired central sensitivity to THs within the general population [Citation12]. However, the relationships between TFQI and diabetes or abnormal glucose metabolism displayed inconsistency across various populations of different race/ethnicity. A positive correlation between TFQI and the prevalence of diabetes was observed in a sample size of 5,129 individuals, with Asians constituting less than 4.5% of the total population [Citation12]. In contrast, a comprehensive multicentre retrospective study involving 30,244 Chinese participants revealed a significant inverse association between TFQI and the prevalence of elevated blood glucose levels, encompassing both prediabetes and diabetes [Citation13]. Additionally, an earlier study with a sample size of 4378 individuals also indicated that higher TFQI was associated with a lower risk of prediabetes [Citation14]. Indeed, the influence of race/ethnicity on the parameters of TSH and thyroid hormones has been firmly established [Citation15–17]. Consequently, it is imperative to assess the stability of the correlation between TFQI and diabetes across diverse racial populations, employing identical exclusion criteria and outcome definitions.
TFQI, commonly called impaired central sensitivity to FT4 (TFQIFT4), is determined by assessing FT4 and TSH levels [Citation12]. Since the inhibitory effect of FT3 on TSH has been established [Citation18], we previously substituted FT4 with FT3 in the TFQIFT4 formulas and revealed that TFQIFT3, rather than TFQIFT4, exhibited a positive association with the prevalence of metabolic dysfunction-associated fatty liver disease (MAFLD) in euthyroid Chinese adults [Citation19]. However, the studies on the associations between TFQIFT3 and diabetes were limited, especially in diverse racial populations. Furthermore, the impact of peripheral sensitivity to thyroid hormones, expressed by the FT3/FT4 ratio, has gained significant attention concerning diabetes [Citation4,Citation20,Citation21].
Taken together, the objective of this study was to investigate the associations of thyroid hormone sensitivity indices, specifically TFQIFT4, TFQIFT3 and FT3/FT4 ratio, with diabetes in euthyroid adults in the United States and China through two cross-sectional community-based surveys.
Method
Study design and population enrolment
Our current cross-sectional study used two databases from the USA and China. Euthyroid individuals from the National Health and Nutrition Examination Survey (NHANES) during the period from 2007 to 2012 were enrolled. The NHANES is a complex, multi-stage probability sampling survey that contains abundant data on demographics, physical examinations, laboratory samples, lifestyle and self-report health status, conducted by the National Center for Health Statistics, part of the Centers for Disease Control and Prevention [Citation22,Citation23]. NHANES data files are released publicly every two years. We combined three NHANES cycles (i.e. 2007–2008, 2009–2010 and 2011-2012) following the NHANES guidelines. In the present study, we analysed NHANES data, including adults aged ≥18 years (n = 15197). We excluded participants whose thyroid function data were not available (n = 7058), those who with thyroid dysfunction (n = 1127) or a history of thyroid disease (n = 498), whose fasting plasma glucose (FPG) data were missing (n = 3367), whose HbA1c data were missing (n = 6), whose 2-h postprandial plasma glucose (PPG) data were missing (n = 844) and those who with the history of diabetes medication (n = 1). Finally, 2296 participants were included in this analysis ().
Figure 1. Flowchart of the study participants. (a) The NHANES. (b) The SPEED-Shunde.
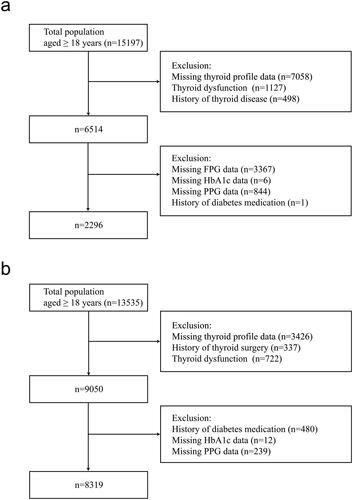
The Prevalence of Metabolic Diseases and Risk Factors in Shunde (SPEED-Shunde) is a community-based study on the prevalence of metabolic diseases and risk factors in Shunde District, Foshan City, Guangdong Province, South China. It was conducted between November 2021 and September 2022 in persons ≥18 years old and who had lived in Shunde for at least six months from ten study sites using a stratified cluster sampling method. The registration number is ChiCTR2100054130 (www.chictr.org). The specific method is as described before [Citation19]. 13535 subjects aged 18 years or older were invited to participate during the recruiting phase. We excluded participants with the missing values of thyroid profiles (n = 3426), with a history of thyroid surgery (n = 337), with thyroid dysfunction (n = 722), with a history of diabetes medication (n = 480), with the missing value of HbA1c data (n = 12) and with the missing value of PPG data (n = 239). Finally, 8319 subjects were eligible for inclusion in the present study ().
Demographic, behavioural and anthropometric assessment
Participants self-reported the following covariates: age, sex, race/ethnicity, medication information, education level and health behaviours, including smoking and alcohol consumption. The body mass index (BMI) of the subjects was calculated as weight (kilograms) divided by height (meters) squared (kg/m2).
Laboratory tests
The NHANES study provided detailed information on laboratory methods used to measure various biomarkers, including FPG, glycated haemoglobin (HbA1c), PPG, FT3, FT4, TSH, thyroid peroxidase antibody (TPOAb), thyroglobulin antibody (TgAb), creatinine, total cholesterol (TC), triglyceride (TG), high-density lipoprotein cholesterol (HDL-C), low-density lipoprotein cholesterol (LDL-C), were reported as previously documented [Citation24]. Serum TSH was measured by microparticle enzyme immunoassay, serum FT4 by two-step enzyme immunoassay and serum FT3 by competitive binding immunoassay [Citation25,Citation26].
In the SPEED-Shunde study, blood samples were collected between 7:00 am and 10:00 am from participants who had fasted for 10 h. The levels of FT3, FT4, TSH, TPOAb and TgAb in the serum were measured using the Microparticle Enzyme Immunoassay (MEIA) technique on the UniCel Dxi 800 Access instrument from Beckman Coulter, USA. FPG, PPG, creatinine, TC, TG, HDL-C and LDL-C were analysed using the automatic biochemical analyser AU5831 from Beckman Coulter, USA. HbA1c levels were determined using high-performance liquid chromatography (HLC-723G8, TOSOH, Japan), while fasting insulin was assessed by an automatic chemiluminescence immunoassay analyser, CL-6000i (Mindray, China). All samples were shipped under cold chain management to the central laboratory in Shunde Hospital, centrifuged and frozen at −20 °C within 2 h.
Definition of serum thyroid function
The normal reference ranges for TSH, FT4 and FT3 are 0.39–4.60 mIU/L, 0.6–1.6 ng/dL (7.8–20.8 pmol/L) and 2.5–3.9 pg/mL (3.85–6.006 pmol/L), respectively [Citation26] in the NHANES and 0.56-5.91 mIU/L, 7.98-16.02 pmol/L and 3.53-7.37 pmol/L, respectively in the SPEED-Shunde study [Citation19]. Euthyroid was defined as TSH, FT4 and FT3 were all within the normal range. TFQIFT4 was obtained by the algorithm TFQIFT4 = cumulative distribution function (cdfFT4) − (1 − cdfTSH) and TFQIFT3 was obtained by TFQIFT3 = cumulative distribution function (cdfFT3) − (1 − cdfTSH). The value of TFQI ranged from −1 to 1. Negative values indicate greater sensitivity to thyroid hormones, and positive values indicate less sensitivity.
Definitions of diabetes and other covariates
Baseline hypertension was defined as systolic blood pressure (SBP) ≥140 mmHg, diastolic blood pressure (DBP) ≥90 mmHg, or self-reported use of antihypertensive medication. The definition of diabetes was FPG level ≥7.0 mmol/L, PPG ≥11.1 mmol/L, HbA1c ≥6.5% and/or having a self-reported diagnosis of diabetes as in the previous study [Citation1]. Glucose status was defined as a three-level categorical variable as diabetes, prediabetes (i.e. FPG levels 5.6 to 6.9 mmol/L, or 2-h PPG levels 7.8 to 11.0 mmol/L or HbA1c 5.7% to 6.4%) and normoglycemia (i.e. FPG levels <5.6 mmol/L, 2-h PPG levels <7.8 mmol/L and HbA1c <5.7%) in the final included participants. Thyroiditis was defined as TPOAb or TGAb positive (TPOAb > 9.0 IU/mL or TGAb > 115.0 IU/mL in the NHANES and TPOAb > 9.0 IU/mL or TGAb > 4.9 IU/mL in the SPEED-Shunde) according to their reference ranges [Citation27]. Dyslipidemia was identified in individuals whose TC ≥ 6.22 mmol/L, TG ≥ 2.26 mmol/L, LDL ≥ 4.14 mmol/L, or HDL < 1.04 mmol/L, or self-reported diagnosis of dyslipidemia as the previous study [Citation28,Citation29]. Alcohol consumption was reported as standard drinks and converted to grams by multiplying by 14. Abusive drink was defined as >30 g/day for men and >20 g/day for women [Citation30]. Smoking status was classified as never (smoked <100 cigarettes in their lifetime), former (smoked >100 cigarettes in their lifetime but currently did not smoke at all) and current smokers (smoked >100 cigarettes in their lifetime and currently smoked some days or every day) [Citation31]. Education was categorized into three levels: less than high school, completed high school and beyond high school [Citation32]. The eGFR was computed through the Chronic Kidney Disease Epidemiology Collaboration (CKD-EPI) equation and estimated glomerular filtration rate (eGFR) = 141 × min (SCr/κ, 1)α × max (SCr/κ, 1)−1.209 × 0.993Age × 1.018 if female × 1.159 if black [Citation33]. HOMA-IR was assessed by the formula: HOMA-IR = FBG (mmol/L) x fasting insulin (μU/mL)/22.5 [Citation34].
Statistical analysis
The baseline characteristics of study participants were summarized as mean (standard deviation) or median (interquartile range) depending on the variable distribution for continuous variables, and categorical variables were presented as proportion (%).
In the SPEED-Shunde study, multivariable logistic regression was used to identify the associations of the thyroid sensitivity indices with diabetes. The full model was adjusted for sex, age, BMI, eGFR, hypertension, thyroiditis, dyslipidemia, abused drink, education, smoking status and HOMA-IR. In the NHANES study, the associations of the thyroid sensitivity indices with diabetes were investigated using the survey-weighted generalized linear model, further adjusting for race/ethnicity. No collinearity among the confounders was found (variance inflation factor < 5) [Citation35]. A restricted cubic spline (RCS) analysis was conducted using a three-knot restricted cubic spline function (with knots at the 10th, 50th and 90th percentiles) to further validate the potential non-linear relationships of the thyroid sensitivity indices with diabetes using the fully adjusted model. Ordinal logistic regression was not suitable for the current study as detailed specification tests revealed that some variables violated the parallel regression assumption (p < 0.05) [Citation36]. Therefore, a general ordinal logit regression was constructed to assess the associations of thyroid sensitivity indices with the normal/prediabetes/diabetes category using the fully adjusted model. Finally, stratified analyses by sex (men, women), age groups (<60, ≥60 years), BMI (in the NHANES study: <25, 30 > BMI ≥ 25, ≥30 kg/m2; in the SPEED-Shunde: <24, 28 > BMI ≥ 24, ≥28 kg/m2) were also performed. Interactions between thyroid sensitivity indices and subgroups on diabetes events were also tested in the models. P values below 0.05 were considered statistically significant. The missing values were handled using multiple imputations by mice R-package. Appropriate sampling weights were used in the NHANES (except the RCS analysis), as suggested by the NCHS. An unweighted RCS analysis was conducted, considering the R package for the weighted RCS analysis was unavailable. All statistical analyses were conducted using R (version 4.2.1).
Results
General characteristics of the participants
The baseline characteristics of participants from the NHANES and the SPEED-Shunde are presented in . Among the 2296 participants from the NHANES, the weighted prevalence of participants with diabetes, men, non-Hispanic whites, and non-smokers were 6.62%, 51.44%, 68.78% and 55.20%, respectively. Mean FPG, HbA1c, PPG, FT3 and FT4 in the NHANES were 5.56 mmol/L, 5.41%, 6.37 mmol/L, 4.97 pmol/L and 10.23 pmol/L, respectively, and median TSH was 1.67 mIU/L.
Table 1. General characteristics of participants in the study.
The SPEED-Shunde study included 8319 participants with a mean age of 46 (SD 12, max 88, min 18). Among these participants, 12.30% were found to have diabetes, 38.19% were men, and 85.88% were non-smokers, with a mean FPG, HbA1c, PPG, FT3 and FT4 of 4.79 mmol/L, 5.68%, 7.77 mmol/L, 5.35 pmol/L and 11.26 pmol/L, respectively, and a medium TSH of 1.74 mIU/L.
Associations of thyroid sensitivity indices with the prevalence of diabetes
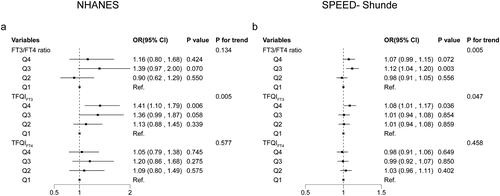
shows associations between quantiles of thyroid sensitivity indices and diabetes. In the NHANES, compared with participants in quartile 1st (Q1), those in quartile 4th (Q4) of TFQIFT3 (OR 2.12, 95% CI (1.18, 3.81)) (p < 0.05) and those in quartile 3rd (Q3) of TFQIFT4 (OR 2.31, 95% CI (1.18, 4.53)) (p < 0.05) were respectively associated with a greater prevalence of diabetes after adjusting for sex, age, BMI, eGFR, race/ethnicity, hypertension, thyroiditis, dyslipidemia, abused drink, education, smoking status and HOMA-IR. No associations between the FT3/FT4 ratio and the prevalence of diabetes were found.
Table 2. Logistic regression analysis for the association between thyroid sensitivity indices and diabetes in the euthyroid population.
In the SPEED-Shunde, compared with participants in Q1, those in Q4 of TFQIFT3 had a greater prevalence of diabetes (OR 1.36, 95% CI (1.11, 1.66) (p < 0.05) after adjusting for sex, age, BMI, eGFR, hypertension, thyroiditis, dyslipidemia, abused drink, education, smoking status and HOMA-IR. However, no significant associations of TFQIFT4 and FT3/FT4 ratio with the prevalence of diabetes were found.
Non-linear relationships of thyroid sensitivity indices with diabetes
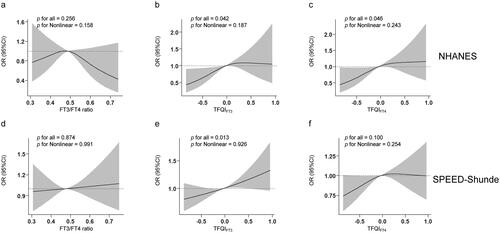
In , we conducted an RCS analysis to examine the non-linear relationships between thyroid sensitivity indices and diabetes in both populations. We found that TFQIFT3 were linearly and positively associated with diabetes after adjusting for sex, age, BMI, eGFR, education, smoking status, abused drink, thyroiditis, hypertension, dyslipidemia and HOMA-IR (and further for race/ethnicity in the NHANES) in two populations (P for overall <0.05, P for non-linearity >0.05) (). Additionally, in the NHANES but not in the SPEED-Shunde, a linear relationship between TFQIFT4 and diabetes was found (). No associations between FT3/FT4 ratio and diabetes were found in either population ().
Figure 2. Non-linear relationships of thyroid sensitivity indices with diabetes. Restricted cubic spline (RCS) analysis was conducted. (a) FT3/FT4 ratio and diabetes in the NHANES (b) TFQIFT3 and diabetes in the NHANES (c) TFQIFT4 and diabetes in the NHANES (d) FT3/FT4 ratio and diabetes in the SPEED-Shunde (e) TFQIFT3 and diabetes in the SPEED-Shunde (f) TFQIFT4 and diabetes in the SPEED-Shunde. The model was adjusted for sex, age, BMI, eGFR, hypertension, thyroiditis, dyslipidemia, abused drink, education, smoking status and HOMA-IR in the SPEED-Shunde (further adjusted for race/ethnicity in the NHANES).
Associations of thyroid sensitivity indices with diabetes stages
In the general ordinal logit regression model, compared with the first quartile of TFQIFT3, the fourth quartile of TFQIFT3 was associated with a 41% (OR 1.41, 95% CI (1.10, 1.79)) (p < 0.05) higher odds of a higher glucose status (diabetes vs. prediabetes and prediabetes vs. normoglycemia) in the NHANES and an 8% higher odds of a higher glucose category (OR 1.08, 95% CI (1.01, 1.17)) (p < 0.05) in the SPEED-Shunde (). The model was adjusted with sex, age, BMI, eGFR, hypertension, thyroiditis, dyslipidemia, abused drink, education, smoking status and HOMA-IR in the SPEED-Shunde and further adjusted for race/ethnicity in the NHANES. However, no associations of TFQIFT4 and FT3/FT4 ratio with the odds of the higher glucose status (diabetes vs. prediabetes and prediabetes vs. normoglycemia) were found (both p > 0.05).
Figure 3. Associations of thyroid sensitivity indices with diabetes stages using general ordinal logit regression. Thyroid sensitivity indices quartiles and diabetes (a) in the NHANES and (b) in the SPEED-Shunde. The model was adjusted for sex, age, BMI, eGFR, hypertension, thyroiditis, dyslipidemia, abused drink, education, smoking status and HOMA-IR in the SPEED-Shunde (further adjusted for race/ethnicity in the NHANES).
Stratification analysis
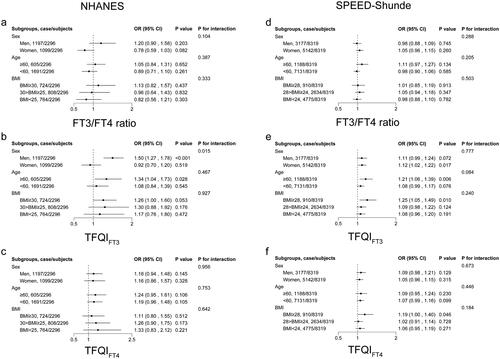
shows the results of the stratification analysis. In the NHANES, participants with higher TFQIFT3 had a higher prevalence of diabetes, especially among men (OR 1.50, 95% CI (1.27, 1.78)) (p < 0.05), those with age ≥ 60 years (OR 1.34, 95% CI (1.04, 1.73)) (p < 0.05) and those BMI ≥30 kg/m2 (OR 1.26, 95% CI (0.997, 1.60)) (p = 0.053). The associations remained consistent in the SPEED-Shunde.
Figure 4. Stratification analysis stratified by sex, age and BMI. Associations of (a) FT3/FT4 ratio, (b) TFQIFT3 and (c) TFQIFT4 with diabetes in the NHANES. Associations of (d) FT3/FT4 ratio, (e) TFQIFT3 and (f) TFQIFT4 with diabetes in the SPEED-Shunde. The model was adjusted for sex, age, BMI, eGFR, hypertension, thyroiditis, dyslipidemia, abused drink, education, smoking status and HOMA-IR in the SPEED-Shunde (further adjusted for races in the NHANES).
Discussion
To the best of our knowledge, this is the first study to evaluate the association of TFQIFT3 with the prevalence of diabetes in a large sample of euthyroid adults in the United States and China. We found the consistently positive associations of TFQIFT3 levels with the prevalence of diabetes and the proportional odds of the higher glucose status both in the euthyroid adults in the United States and China, particularly in the elderly or obese participants, while TFQIFT4 was positively associated with the prevalence of diabetes in the euthyroid adults in the United States, but not in China. Our findings implied the importance of TFQIFT3, an indicator of impaired central sensitivity to FT3, for predicting diabetes.
Prior studies have presented contradictory findings regarding the relationship between diabetes and the single hormones of FT3, FT4 and TSH [Citation4,Citation20]. For example, one early study suggested that decreased FT3 and increased FT4 levels are independently related to a higher prevalence of diabetes in both males and females, and TSH is inversely related to T2DM in males only [Citation20,Citation37]. However, one recent study found that high TSH and low FT4 levels in the reference range were significantly associated with the prevalence of diabetes [Citation4]. These contradictory findings can be attributed to the interconnectedness of these hormones. As a result, the investigation of composite indices, such as TFQIFT3 or TFQIFT4, has been deemed necessary to offer a comprehensive understanding of the regulation of thyroid hormone homeostasis, surpassing the limitations of relying solely on a single hormone [Citation10,Citation38].
Laclaustra et al. [Citation12] proposed a positive association between higher TFQIFT4 levels and the prevalence of diabetes in a cross-sectional study conducted in the United States. However, a recent study involving 3573 Chinese participants did not observe a significant association between TFQIFT4 and diabetes [Citation39]. These findings were similar to our results that TFQIFT4 was positively associated with the prevalence of diabetes in euthyroid adults in the United States rather than in China. In addition, previous studies have reported significant associations of TFQIFT3, but not TFQIFT4, with MAFLD and NAFLD [Citation19,Citation40–42]. However, investigations into the associations between TFQIFT3 and diabetes were limited. This study presents novel findings indicating a positive association between TFQIFT3 levels and the prevalence of diabetes in euthyroid adults from both the United States and China. These consistent associations indicated that TFQIFT3 may have a more reliable predictive ability for diabetes than TFQIFT4.
Notably, our study revealed that the associations between TFQIFT3 and diabetes prevalence remained significant only among participants aged over 60 or obese in the United States and China. This observation may be attributed to the higher likelihood of elevated FT3 and TSH levels in elderly and obese individuals. A study demonstrated a negative association between age and levels of TSH and FT3, indicating a potentially significant alteration in the feedback regulation of thyroid function in older people [Citation43]. Furthermore, another study revealed that a genetically predisposed higher BMI is associated with elevated FT3 levels, while no significant correlation was observed with FT4 levels [Citation44]. Collectively, these studies suggest that TFQIFT3 may hold greater importance than TFQIFT4 in elderly and obese populations.
Possible explanations for the relatively consistent associations between TFQIFT3 and diabetes primarily encompass the compensatory rise in serum FT3 levels and the physiological impacts of FT3 and TSH. Firstly, the heightened levels of serum FT3, predominantly derived from serum FT4 through deiodinase conversion, can be perceived as a compensatory and adaptive mechanism to augment energy expenditure in metabolic disorders, such as obesity [Citation45]. This hypothesis was supported by a previous study where FT3 levels decreased after weight loss [Citation46]. Furthermore, a previous study demonstrated a significant elevation in TSH levels among mice subjected to a high-fat diet, potentially attributed to a reduction in the central sensitivity to thyroid hormones [Citation47]. Secondly, it has been suggested that FT3 may contribute to augmented hepatic glucose production and intestinal glucose absorption, diminished muscle glycogen storage, upregulated glycogenolysis and intensified lipolysis, ultimately resulting in heightened insulin resistance [Citation48]. Thirdly, it has been observed that TSH could induce leptin secretion in human adipose tissue, which reduced insulin secretion and synthesis in pancreatic β-cells [Citation49]. Consequently, the composite index TFQIFT3, which incorporates both TSH and FT3, may provide a more accurate indication of the likelihood of developing diabetes compared to the individual index in individuals with normal TSH, FT3 and FT4 levels.
The present study possesses notable strengths, primarily from its relatively substantial sample size and the evidence obtained from two distinct cohorts recruited from the United States and China. Nonetheless, certain limitations persist. Firstly, despite the utilization of electrochemiluminescence immunoassays in quality-driven laboratory settings in both cohorts, it is imperative to acknowledge the possibility of an inherent influence on the outcomes due to variations in laboratory assays for the quantification of TSH, FT3, FT4 and glucose. Secondly, despite our efforts to control for various confounding factors, it is important to acknowledge the possibility of residual and recall bias influencing the effect estimation. Thirdly, the study’s cross-sectional design limits its ability to establish causal relationships between thyroid hormone sensitivity and diabetes. Therefore, it is essential to consider the reverse link from diabetes and glucose metabolism to thyroid hormone resistance and to conduct further prospective cohort investigations or Mendelian randomization research to explore the potential causal inferences.
In summary, our study revealed a significantly and consistently positive association between TFQIFT3 and diabetes in euthyroid adults from the United States and China, particularly in elderly and obese populations. Conversely, we observed a positive association between TFQIFT4 and diabetes solely in euthyroid adults from the United States, with no such association found in China. These findings provide evidence that the association between TFQIFT3 and diabetes may have broader applicability to different race/ethnicity, which warrants further prospective cohort studies.
Ethics approval
The NHANES was approved by the National Center for Health Statistics Ethics Review Board. The SPEED-Shunde study protocol (20211103) was approved by the Ethics Committee of the Shunde Hospital of Southern Medical University.
Consent form
All participants in the two cohorts provided informed and written consent.
Authors’ contributions
Heng Wan, Lan Liu and Jie Shen performed the conceptualization; Heng Wan and Genfeng Yu conducted the data analysis; Siyang Liu, Xingying Chen, Yuqi Jiang, Hualin Duan and Xu Lin conducted the data acquisition; Heng Wan and Genfeng Yu drafted the manuscript; Yajun He, Lan Liu and Jie Shen revised the manuscript.
Acknowledgments
The authors thank all team members and participants in the study.
Disclosure statement
No potential conflict of interest was reported by the author(s).
Data availability statement
The data supporting the study findings are available from the corresponding authors upon reasonable request.
Additional information
Funding
References
- Li Y, Teng D, Shi X, et al. Prevalence of diabetes recorded in mainland China using 2018 diagnostic criteria from the American Diabetes Association: national cross sectional study. BMJ. 2020;369:1. doi: 10.1136/bmj.m997.
- Collaborators GBDD. Global, regional, and national burden of diabetes from 1990 to 2021, with projections of prevalence to 2050: a systematic analysis for the global burden of disease study 2021. Lancet. 2023;402:203–11.
- Biondi B, Kahaly GJ, Robertson RP. Thyroid dysfunction and diabetes mellitus: two closely associated disorders. Endocr Rev. 2019;40(3):789–824. doi: 10.1210/er.2018-00163.
- Roa Dueñas OH, Van der Burgh AC, Ittermann T, et al. Thyroid function and the risk of prediabetes and type 2 diabetes. J Clin Endocrinol Metab. 2022;107(6):1789–1798. doi: 10.1210/clinem/dgac006.
- Gronich N, Deftereos SN, Lavi I, et al. Hypothyroidism is a risk factor for new-onset diabetes: a cohort study. Diabetes Care. 2015;38(9):1657–1664. doi: 10.2337/dc14-2515.
- Ittermann T, Schipf S, Dörr M, et al. Hyperthyroxinemia is positively associated with prevalent and incident type 2 diabetes mellitus in two population-based samples from northeast Germany and Denmark. Nutr Metab Cardiovasc Dis. 2018;28(2):173–179. doi: 10.1016/j.numecd.2017.10.016.
- Wu Z, Jiang Y, Zhou D, et al. Sex-specific association of subclinical hypothyroidism with incident metabolic syndrome: a population-based cohort study. J Clin Endocrinol Metab. 2022;107(6):e2365–e2372. doi: 10.1210/clinem/dgac110.
- Lee YJ, Kim MH, Lim DJ, et al. Exploring the association between thyroid function and frailty: insights from representative Korean data. Endocrinol Metab. 2023;38(6):729–738. doi: 10.3803/EnM.2023.1769.
- Wu Z, Jiang Y, Li P, et al. Association of impaired sensitivity to thyroid hormones with hyperuricemia through obesity in the euthyroid population. J Transl Med. 2023;21(1):436. doi: 10.1186/s12967-023-04276-3.
- Sun H, Zhu W, Liu J, et al. Reduced sensitivity to thyroid hormones is associated with high remnant cholesterol levels in Chinese euthyroid adults. J Clin Endocrinol Metab. 2022;108(1):166–174. doi: 10.1210/clinem/dgac523.
- Tjørve E, Tjørve KMC, Olsen JO, et al. On commonness and rarity of thyroid hormone resistance: a discussion based on mechanisms of reduced sensitivity in peripheral tissues. Med Hypotheses. 2007;69(4):913–921. doi: 10.1016/j.mehy.2006.12.056.
- Laclaustra M, Moreno-Franco B, Lou-Bonafonte JM, et al. Impaired sensitivity to thyroid hormones is associated with diabetes and metabolic syndrome. Diabetes Care. 2019;42(2):303–310. doi: 10.2337/dc18-1410.
- Yu L, Li Z, Yang R, et al. Impaired sensitivity to thyroid hormones is associated with elevated blood glucose in coronary heart disease. Front Endocrinol. 2022;13:895843. doi: 10.3389/fendo.2022.895843.
- Liu B, Wang Z, Fu J, et al. Sensitivity to thyroid hormones and risk of prediabetes: a cross-sectional study. Front Endocrinol. 2021;12:657114. doi: 10.3389/fendo.2021.657114.
- Surks MI, Boucai L. Age- and race-based serum thyrotropin reference limits. J Clin Endocrinol Metab. 2010;95(2):496–502. doi: 10.1210/jc.2009-1845.
- Boucai L, Surks MI. Reference limits of serum TSH and free T4 are significantly influenced by race and age in an urban outpatient medical practice. Clin Endocrinol. 2009;70(5):788–793. doi: 10.1111/j.1365-2265.2008.03390.x.
- La’ulu SL, Roberts WL. Second-trimester reference intervals for thyroid tests: the role of ethnicity. Clin Chem. 2007;53(9):1658–1664. doi: 10.1373/clinchem.2007.089680.
- Hamidi S, Aliesky H, Chen CR, et al. Variable suppression of serum thyroxine in female mice of different inbred strains by triiodothyronine administered in drinking water. Thyroid. 2010;20(10):1157–1162. doi: 10.1089/thy.2010.0117.
- Wan H, Yu G, Xu S, et al. Central sensitivity to free triiodothyronine with MAFLD and its progression to liver fibrosis in euthyroid adults. J Clin Endocrinol Metab. 2023;108(9):e687–e697. doi: 10.1210/clinem/dgad186.
- Gu Y, Li H, Bao X, et al. The relationship between thyroid function and the prevalence of type 2 diabetes mellitus in euthyroid subjects. J Clin Endocrinol Metab. 2017;102(2):434–442. doi: 10.1210/jc.2016-2965.
- Alonso-Ventura V, Civeira F, Alvarado-Rosas A, et al. A cross-sectional study examining the parametric thyroid feedback quantile index and its relationship with metabolic and cardiovascular diseases. Thyroid. 2022;32(12):1488–1499. doi: 10.1089/thy.2022.0025.
- Titcomb TJ, Liu B, Lehmler HJ, et al. Environmental nickel exposure and diabetes in a nationally representative sample of US adults. Expo Health. 2021;13(4):697–704. doi: 10.1007/s12403-021-00413-9.
- Yu G, Liu L, Qin T, et al. Associations of serum iron status with MAFLD and liver fibrosis in the USA: a nationwide cross-section study. Biol Trace Elem Res. 2023;202(1):87–98. doi: 10.1007/s12011-023-03666-4.
- Gyawali P, Martin SA, Heilbronn LK, et al. The role of sex hormone-binding globulin (SHBG), testosterone, and other sex steroids, on the development of type 2 diabetes in a cohort of community-dwelling middle-aged to elderly men. Acta Diabetol. 2018;55(8):861–872. doi: 10.1007/s00592-018-1163-6.
- Webster GM, Rauch SA, Marie NS, et al. Cross-Sectional associations of serum perfluoroalkyl acids and thyroid hormones in U.S. adults: variation according to TPOAb and iodine status (NHANES 2007-2008). Environ Health Perspect. 2016;124(7):935–942. doi: 10.1289/ehp.1409589.
- Inoue K, Ritz B, Brent GA, et al. Association of subclinical hypothyroidism and cardiovascular disease with mortality. JAMA Netw Open. 2020;3(2):e1920745. doi: 10.1001/jamanetworkopen.2019.20745.
- Zheng G, Cai Y, Guo Y, et al. The association between dietary selenium intake and Hashimoto’s thyroiditis among US adults: national health and nutrition examination survey (NHANES), 2007-2012. J Endocrinol Invest. 2022;46(7):1385–1395. doi: 10.1007/s40618-022-01987-0.
- Eslam M, Newsome PN, Sarin SK, et al. A new definition for metabolic dysfunction-associated fatty liver disease: an international expert consensus statement. J Hepatol. 2020;73(6):1575–1209. doi: 10.1016/j.jhep.2020.07.045.
- Wan H, Wang Y, Xiang Q, et al. Associations between abdominal obesity indices and diabetic complications: Chinese visceral adiposity index and neck circumference. Cardiovasc Diabetol. 2020;19(1):118. doi: 10.1186/s12933-020-01095-4.
- Veronese N, Notarnicola M, Cisternino AM, et al. Coffee intake and liver steatosis: a population study in a mediterranean area. Nutrients. 2018;10(1):89. doi: 10.3390/nu10010089.
- Zhang Y, Liu W, Zhang W, et al. Association between blood lead levels and hyperlipidemiais: results from the NHANES (1999-2018). Front Public Health. 2022;10:981749. doi: 10.3389/fpubh.2022.981749.
- Kim H, Hu EA, Rebholz CM. Ultra-processed food intake and mortality in the USA: results from the third national health and nutrition examination survey (NHANES III, 1988-1994). Public Health Nutr. 2019;22(10):1777–1785. doi: 10.1017/S1368980018003890.
- Michels WM, Grootendorst DC, Verduijn M, et al. Performance of the Cockcroft-Gault, MDRD, and new CKD-EPI formulas in relation to GFR, age, and body size. Clin J Am Soc Nephrol. 2010;5(6):1003–1009. doi: 10.2215/CJN.06870909.
- Tan L, Liu Y, Liu J, et al. Association between insulin resistance and uncontrolled hypertension and arterial stiffness among US adults: a population-based study. Cardiovasc Diabetol. 2023;22(1):311. doi: 10.1186/s12933-023-02038-5.
- Barzegar N, Tohidi M, Hasheminia M, et al. The impact of triglyceride-glucose index on incident cardiovascular events during 16 years of follow-up: Tehran lipid and glucose study. Cardiovasc Diabetol. 2020;19(1):155. doi: 10.1186/s12933-020-01121-5.
- Joshi O, Becerra TA, Engle DM, et al. Factors affecting public preferences for grassland landscape heterogeneity in the great plains. Environ Manage. 2017;60(5):922–930. doi: 10.1007/s00267-017-0921-5.
- Elgazar EH, Esheba NE, Shalaby SA, et al. Thyroid dysfunction prevalence and relation to glycemic control in patients with type 2 diabetes mellitus. Diabetes Metab Syndr. 2019;13(4):2513–2517. doi: 10.1016/j.dsx.2019.07.020.
- Hoermann R, Midgley JE, Larisch R, et al. Homeostatic control of the thyroid-pituitary axis: perspectives for diagnosis and treatment. Front Endocrinol. 2015;6:177. doi: 10.3389/fendo.2015.00177.
- Lv F, Cai X, Li Y, et al. Sensitivity to thyroid hormone and risk of components of metabolic syndrome in a Chinese euthyroid population. J Diabetes. 2023;15(10):900–910. doi: 10.1111/1753-0407.13441.
- Grabherr F, Grander C, Effenberger M, et al. MAFLD: what 2 years of the redefinition of fatty liver disease has taught us. Ther Adv Endocrinol Metab. 2022;13:20420188221139101. doi: 10.1177/20420188221139101.
- Liu H, Xing Y, Nie Q, et al. Association between sensitivity to thyroid hormones and metabolic dysfunction-associated fatty liver disease in euthyroid subjects: a cross-sectional study. Diabetes Metab Syndr Obes. 2023;16:2153–2163. doi: 10.2147/DMSO.S420872.
- Lai S, Li J, Wang Z, et al. Sensitivity to thyroid hormone indices are closely associated with NAFLD. Front Endocrinol. 2021;12:766419. doi: 10.3389/fendo.2021.766419.
- Kussmaul T, Greiser KH, Haerting J, et al. Thyroid analytes TSH, FT3 and FT4 in serum of healthy elderly subjects as measured by the Roche modular system: do we need age and gender dependent reference levels? Clin Lab. 2014;60(9):1551–1559. doi: 10.7754/clin.lab.2014.130328.
- Taylor PN, Richmond R, Davies N, et al. Paradoxical relationship between body mass index and thyroid hormone levels: a study using mendelian randomization. J Clin Endocrinol Metab. 2016;101(2):730–738. doi: 10.1210/jc.2015-3505.
- Wang X, Gao X, Han Y, et al. Causal association between serum thyrotropin and obesity: a bidirectional, mendelian randomization study. J Clin Endocrinol Metab. 2021;106(10):e4251–e4259. doi: 10.1210/clinem/dgab183.
- Chen P, Hou X, Wei L, et al. Free triiodothyronine is associated with the occurrence and remission of nonalcoholic fatty liver disease in euthyroid women. Eur J Clin Invest. 2019;49:e13070.
- Huang B, Wen W, Ye S. TSH-SPP1/TRbeta-TSH positive feedback loop mediates fat deposition of hepatocyte: crosstalk between thyroid and liver. Front Immunol. 2022;13:1009912. doi: 10.3389/fimmu.2022.1009912.
- Potenza M, Via MA, Yanagisawa RT. Excess thyroid hormone and carbohydrate metabolism. Endocr Pract. 2009;15(3):254–262. doi: 10.4158/EP.15.3.254.
- Denroche HC, Huynh FK, Kieffer TJ. The role of leptin in glucose homeostasis. J Diabetes Investig. 2012;3(2):115–129. doi: 10.1111/j.2040-1124.2012.00203.x.