
Abstract
Background
Cirrhosis is a disease that imposes a heavy burden worldwide, but its incidence varies widely by region. Therefore, we analysed data on the incidence and mortality of cirrhosis in 204 countries and territories from 1990–2019 and projected the disease development from 2019–2039.
Methods
Data on the incidence and mortality of liver cirrhosis from 1990 to 2019 were acquired from the public Global Burden of Disease (GBD) study. In addition, the average annual percentage change (AAPC) and estimated annual percentage change (EAPC) of the age-standardized rate (ASR) of cirrhosis in different regions were calculated. The estimates of risk factor exposure were summarized, and the proportion of causes and risk factors of liver cirrhosis and their relationship with the human development index (HDI) and socio–demographic index (SDI) were analysed. Trends in the incidence of cirrhosis in 2019–2039 were predicted using Nordpred and BAPC models.
Results
Globally, the ASR of cirrhosis incidence decreased by 0.05% per year from 25.7/100,000 in 1990 to 25.3/100,000 in 2019. The mortality risk associated with cirrhosis is notably lower in females than in males (13 per 100,000 vs 25 per 100,000). The leading cause of cirrhosis shifted from hepatitis B to C. Globally, alcohol use increased by 14%. In line, alcohol use contributed to 49.3% of disability-adjusted life years (DALYs) and 48.4% of global deaths from liver cirrhosis. Countries with a low ASR in 1990 experienced a faster increase in cirrhosis, whereas in 2019, the opposite was observed. In countries with high SDI, the ASR of cirrhosis is generally lower. Finally, projections indicate that the number and incidence of cirrhosis will persistently rise from 2019–2039.
Conclusions
Cirrhosis poses an increasing health burden. Given the changing etiology, there is an imperative to strengthen the prevention of hepatitis C and alcohol consumption, to achieve early reduce the incidence of cirrhosis.
KEY MESSAGES
This study is an updated assessment of liver cirrhosis prevalence trends in 204 countries worldwide and the first to project trends over the next 20 years.
The disease burden of cirrhosis is still increasing, and despite the decline in ASR, the number and prevalence of cirrhosis will continue to increase over the next two decades after 2019.
It is alarming that the global surge in alcohol use is accompanied by an increase in DALYs and deaths due to liver cirrhosis.
Liver cirrhosis remains a noteworthy public health event, and our study can further guide the development of national healthcare policies and the implementation of related interventions.
1. Introduction
Liver cirrhosis is an integral part of the development of chronic liver disease. It is characterized by diffuse liver fibrosis due to prolonged injury and inflammation, regrowth of small nodules surrounded by fibrotic septa and intrahepatic vascular shunting [Citation1]. As cirrhosis progresses, it impairs important liver functions, including protein synthesis, detoxification, and the regulation of related metabolic processes and increases the risk of liver cancer. The main causes of liver cirrhosis include long–term alcohol abuse, viral hepatitis infection (especially hepatitis B and C), non–alcoholic fatty liver disease (NAFLD) and autoimmune diseases [Citation2,Citation3].
The incidence of liver cirrhosis varies widely in various regions of the world. Globally, cirrhosis causes approximately two million deaths each year [Citation4]. In the United States, the prevalence of cirrhosis is estimated at 0.15% [Citation5], resulting in more than 25,000 deaths in 1998 [Citation6]. In China, the incidence of liver cirrhosis per thousand people increased by 73.7%, from 6833.3 in 1990 to 11869.6 in 2016 [Citation7]. Due to the great differences in the level of economic development and population composition in different regions, the burden caused by liver cirrhosis also varies greatly. For the 1980–2010 global burden of disease study (GBD), the study of liver cirrhosis by Mokdad et al., the number of deaths from liver cirrhosis increased from 676,000 in 1980 (95% uncertainty interval (UI): 452,863 to 1,004,530) in 2010 1,029,042 (95% UI: 670,216 to 1,554,530); but the age–standardized death rate decreased by 22% [Citation4]. The same changes were also shown in a 2017 GBD study. The study analysed cirrhosis data from 195 countries and found that the number of deaths increased from 899 000 (95% UI: 829 000–948 000) in 1990 to 1.32 million (95% UI: 1.27–1.45) in 2017; the age–standardized death rate decreased from 21.0 (19.2–22.3) per 100,000 in 1990 to 16.5 (15.8–18.1) per 100,000 in 2017 [Citation8]. Both of these previous studies showed the same trend, with an increase in cirrhosis deaths and a gradual decline in age–standardized death rates.
Therefore, based on the latest GBD data in 2019, this study analyses and evaluates the disease burden of liver cirrhosis in 204 countries and regions around the world from 1990 to 2019, and predicts the changing trend of its health burden in the next 20 years, to provide a reference for decision–makers.
2. Methods
2.1. Data sources
The data used in this article comes from GBD 2019, which systematically assessed 369 diseases and 87 risk factors in 204 countries and territories [Citation9]. We extracted data on incidence, deaths, age–standardized incidence and deaths, summary exposure value, and risk factors for morbidity associated with cirrhosis by country and territory from 1990 to 2019 from the Global Health Data Exchange Query Tool (http://ghdx.healthdata.org/gbd–results–tool) [Citation9]. In terms of age selection, in addition to selecting ‘all ages’ and ‘age-standardized’ for analysis, we also selected the following age groups: ‘<1 year’, ‘1–4 years’, ‘5–9 years’, ‘10–14 years’, ‘15–19 years’, ‘20–24 years’, ‘25–29 years’, ‘30–34 years’, ‘35–39 years’, ‘40–44 years’, ‘45–49 years’, ‘50–54 years’, ‘55–59 years’, ‘60–64 years’, ‘65–69 years’, ‘70–74 years’, ‘75–79 years’, ‘80–84 years’, ‘85–89 years’, ‘90–94 years’, ‘95+ years’. Further, we retrieved and analysed the composition ratio of liver cirrhosis cases in five aetiological groups (hepatitis B, hepatitis C, NAFLD, alcohol use, and other causes) and studied two risk factors (alcohol use) and (drug use) rate of liver cirrhosis.
We also collected national–level Human Development Index (HDI) data (https://hdr.undp.org/data–center/human–development–index#/indicies/HDI) from the World Bank to explore the relationship between HDI and cirrhosis. In addition, we obtained the global population forecast information for 2017–2100 in the GBD database (https://ghdx.healthdata.org/record/ihme–data/global–population –forecasts–2017–2100), to further predict the future development trend of liver cirrhosis.
2.2. Statistical analysis
Because the included data had different age groups and changed over time, we assessed them using age–standardized rates (ASR). The calculation of ASR is based on the world standard population in the GBD database, and heterogeneity is estimated using a 95% uncertainty interval (UI) [Citation10]. Further, we use estimated annual percentage change (EAPC) and average annual percentage change (AAPC) to assess the trend of ASR over time. The regression line is fitted to the natural logarithm of the ratio, y = α + βx + e, where y = ln (ASR) and x = calendar year. EAPC is calculated as 100 × [exp (β)-1], and its 95% confidence interval (CI) can also be obtained from the linear regression model [Citation11]. In addition, we used Joinpoint Regression Program version 4.9.1.0 (Statistical Research and Applications Branch, National Cancer Institute) to calculate AAPC, AAPC = {exp (Σwibi/Σwi) − 1} * 100, where bi is the slope coefficient for each segment in the desired year range, and wi is the length of each segment in the year range. Next, EAPCs for morbidity and mortality were clustered using hierarchical cluster analysis, and countries with similar trends in EAPCs were identified. In addition, the relationships between EAPCs, ASRs (1990 and 2019), and HDI (2022) were determined for each country. To clarify the relationship between socioeconomic development and the occurrence of liver cirrhosis, we included the GBD database (https://ghdx.healthdata.org/record/ihme–data/gbd–2019–socio–demographic–index–sdi–1950–2019) of socio–demographic index (SDI) data from 1950–2019. The national economic development level is divided into low, medium–low, medium, high–medium, and high SDI according to the quintiles of the SDI value, and the value ranges from 0 to 1.
To predict the incidence of future cirrhosis, we used the Nordpred package in the R software to analyse the number and incidence of cirrhosis in different age groups from 2019 to 2039 and calculated ASR by gender. To verify the reliability of the predicted results, we used the BAPC and INLA packages in R software for analysis. Statistics of all data in this study were performed using R software (version 4.2.1) and p < 0.05 was considered statistically significant.
3. Results
3.1. Global disease burden of cirrhosis
First, we analyzed the age–standardized incidence rate (ASIR) of each country and territory in 2019. Moldova (80 per 100000, 95% UI: 71.7 − 86.3) has the highest ASIR, followed by Mongolia (79.6 per 100000, 95% UI: 66.4 − 94.2) and Egypt (78.7 per 100000, 95% UI: 62.3–99). Papua New Guinea (6.1 per 100000, 95% UI: 4.9 − 7.2), by comparison, has the lowest ASIR among countries and territories, followed by Cook Islands (6.1 per 100000, 95% UI: 5 − 7.1) and Jamaica (8.5 per 100000, 95% UI: 7.3 − 9.8) ( and ). Further, we analysed the changes in the number of cases of cirrhosis in each country and territory from 1990 to 2019. As shown in , the number of cases in the United Arab Emirates increased by 820%, from 219.5 in 1990 to 2019.1 in 2019 ( and ). Meanwhile, the number of cases in the Republic of Korea dropped 43.9%, from 30,126.5 in 1990 to 16,886.5 in 2019 ( and ). To better assess the changes of ASIR in liver cirrhosis, we performed an EAPC analysis. The results show that Kazakhstan has the fastest ASIR growth with an average annual growth rate of 4.3% (95% CI: 4.1 − 4.5), while the Republic of Korea has the fastest ASIR decline with an average annual growth rate of 3.9% (95% CI: −4.1 to −3.7) ( and ). The results of the AAPC analysis are consistent. Kazakhstan is the fastest growing ASIR with an average annual growth rate of 3.632% (95% CI: 3.505 − 3.759), while the Republic of Korea is the fastest declining ASIR with an average annual growth rate of 3.345% (95% CI: −3.548 to −3.14) ().
Figure 1. Incidence of cirrhosis in 204 countries and regions worldwide burden of disease: A. ASR for the incidence of cirrhosis in 2019; B. Changes in the cases of cirrhosis from 1990 to 2019; C. EAPC analysis of cirrhosis ASR from 1990 to 2019. ASIR, age-standardized rate; EAPC, estimated annual percent change. Source: Institute for Health Metrics and Evaluation. Used with permission. All rights reserved.
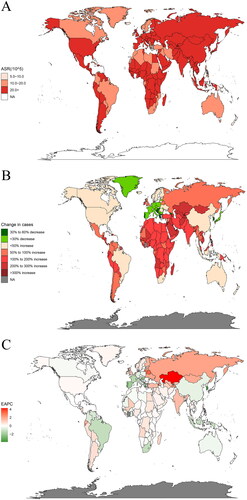
Table 1. ASIR, change in case numbers and EAPC for cirrhosis in different countries.
Table 2. Incidence rate and age–standardized incidence of cirrhosis in various countries of the world from 1990 to 2019 and temporal trends from 1990 to 2019.
Furthermore, the mortality burden of liver cirrhosis was analysed by countries and regions in 2019. Egypt had the highest age–standardized death rate (ASDR) (126.7 per 100000, 95% UI: 87.3 − 169.5), followed by Mongolia (72.9 per 100000, 95% UI: 56.9 − 91.3). However, Singapore (3.3 per 100000, 95% UI: 2.9 − 3.6) and Iceland (3.3 per 100000, 95% UI: 2.9 − 3.7) had the lowest ASDR globally ( and ). The change in the number of deaths from cirrhosis from 1990 to 2019 also shows large differences across countries. The number of deaths from cirrhosis in the United Arab Emirates increased by 607.7% from 71.4 in 1990 to 505.6 in 2019. In Portugal, however, there was a 42.8% decrease, from 3,658.6 cases in 1990 to 2,091.7 cases in 2019 ( and ). EAPC analysis found that Belarus and Lithuania had the fastest annual average growth rate of 3.7% (95%CI: 2.6 − 4.9; 95%CI: 2.6 − 4.8;). However, the Republic of Korea experienced the fastest annual decrease in ASDR of 5.6% (95% CI: −5.9 to −5.2) globally ( and ).
Figure 2. Disease burden of cirrhosis mortality in 204 countries and territories worldwide: A. ASR for cirrhosis mortality in 2019; B. Changes in the cases of cirrhosis from 1990 to 2019; C. EAPC analysis of cirrhosis ASR from 1990 to 2019. ASR, age-standardized rate; EAPC, estimated annual percent change. Source: Institute for Health Metrics and Evaluation. Used with permission. All rights reserved.
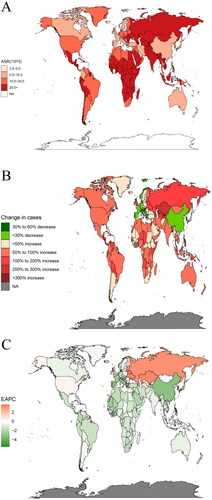
Table 3. ASDR, change in case numbers and EAPC for cirrhosis in different countries.
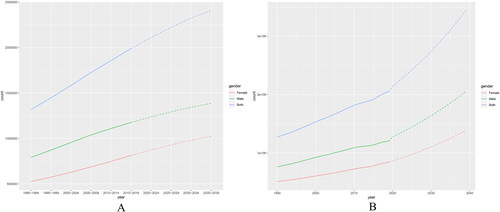
In addition, the burden of cirrhosis was different between the genders. Globally, the number of deaths, death rate, and ASDR of liver cirrhosis in females is significantly lower than those in males. Among them, the Republic of Moldova had the highest death rate among female patients (67.8 per 100000, 95% UI: 59.3 − 77.5), while Papua New Guinea had the lowest (1.9 per 100000, 95% UI: 1.3 − 2.7). Analysis of the ASDR data, however, found that Egyptian females had the highest (141.4 per 100000, 95% UI: 103.9–191) and Iceland the lowest (1.9 per 100000, 95% UI: 1.6 − 2.2). Analysis of the data for males found that the highest cirrhosis death rate remained in the Republic of Moldova (81.7 per 100000, 95% UI: 70.7 − 93.8), while the lowest became Singapore (5.2 per 100000, 95% UI: 4.7 − 5.8). However, Egyptian males still have the highest ASDR of cirrhosis (124.5 per 100000, 95% UI: 78.7 − 170.3), as do females; Singapore still has the lowest ASDR (3.9 per 100000, 95% UI: 3.5 − 4.4) ().
Table 4. Number of liver cirrhosis mortalities, death rate and ASDR by gender in 2019.
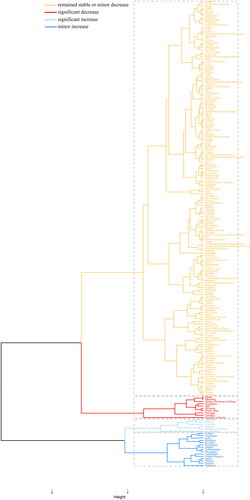
We performed a stratified cluster analysis for each country based on EAPC incidence and death. A total of 173 countries and territories, including Tunisia, the Syrian Arab Republic, and Egypt, were designated to the ‘remained stable or minor decrease’ group. 10 countries and territories, including Spain, Mauritius, and Taiwan (Province of China), were classified as a ‘significant decrease’ group. 6 countries including Lithuania, Belarus, and Armenia are classified as the ‘significant increase’ group. 15 countries and territories, including Kuwait, Azerbaijan, and India, are divided into the ‘minor increase’ group ( and Supplementary Table 1).
Figure 3. Cluster analysis: Estimated annual percent change data combining incidence and deaths. Source: Institute for Health Metrics and Evaluation. Used with permission. All rights reserved.
3.2. Percentage change of cirrhosis caused by different causes
The percentage of the five causes of cirrhosis has changed greatly from 1990 to 2019. Globally, the top three causes of cirrhosis in 1990 were hepatitis B (28.2%), other causes (24.3%), and hepatitis C (23.2%). However, in 2019, the top three causes changed to hepatitis C (26.9%), hepatitis B (25.4%), and alcohol use (21.3%). Notably, the proportion of cirrhosis due to NAFLD also increased significantly ().
Figure 4. Contribution of hepatitis B, hepatitis C, NAFLD, alcohol use, and other causes to cirrhosis cases (in both genders), globally and regionally, in 1990 and 2019: A. The proportion of cirrhosis caused by various causes in 1990; B. The proportion of cirrhosis caused by various causes in 2019. NAFLD, Non-alcoholic fatty liver disease. Source: Institute for Health Metrics and Evaluation. Used with permission. All rights reserved.
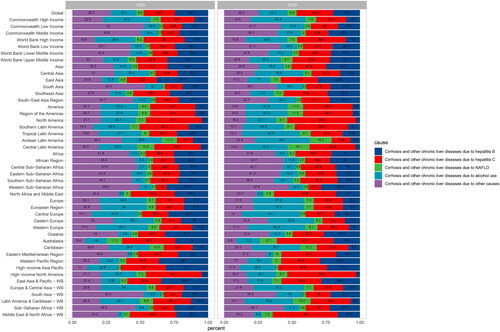
From the perspective of different causes, liver cirrhosis caused by hepatitis B mostly occurs in East Asia, whether in 1990 (37.7%) or 2019 (30.9%). Liver cirrhosis caused by hepatitis C mostly occurred in North America and high–income North America, accounting for 41.1% in 1990 and increasing to 50.8% in 2019. The proportion of cirrhosis due to NAFLD was highest in Central and Latin America, which increased from 12.8% in 1990 to 16.2% in 2019. Interestingly, we found that the region with the largest proportion of cirrhosis due to alcohol use changed from Western Europe in 1990 (38.3%) to Central Europe in 2019 (43.1%). The region with the highest proportion of cirrhosis that could not be classified into the above four causes changed from South Asia (53.4%) in 1990 to Western Sub–Saharan Africa (47.8%) in 2019.
3.3. Summary exposure value (SEV) and proportion of DALYs and deaths attributable to alcohol or drug use in different regions
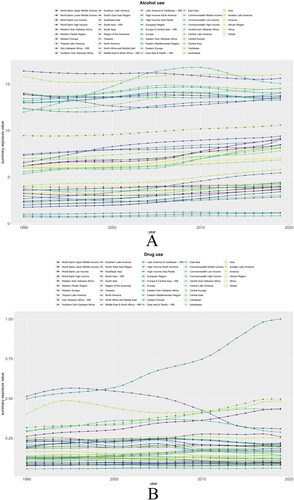
Further, we analysed how the SEV of alcohol consumption and drug use varied across regions of the globe. As shown in and Supplementary Table 2, there has been a significant 14% increase in alcohol use globally; The SEV of alcohol use in Western Europe and Oceania was consistently high, exceeding 15 since 1990. Notably, the largest increase in SEV attributable to alcohol use was observed in Southeast Asia, reaching 104.1%. The global SEV change in drug use was stable, increasing by only 2.7%. However, the 101% increase in SEV attributable to drug use in North America should be of concern.
Figure 5. Summary exposure value changes of alcohol and drug use in 46 GBD regions from 1990 to 2019: A. Changes in SEV for alcohol use; B. Changes in SEV for alcohol use. Source: Institute for Health Metrics and Evaluation. Used with permission. All rights reserved.
In addition, we focused on the effects of alcohol use and drug use on cirrhosis. Globally, 49.3% of DALYs and 48.4% of deaths can be attributed to alcohol use. By region, the effects of alcohol use were highest in Western Europe (75.6% DALYs and 73% deaths) and lowest in the Middle East & North Africa–WB (11.8% DALYs and 10.4% deaths) ().
Figure 6. Proportion of DALYs and deaths from cirrhosis due to alcohol use and drug use in 46 GBD regions in 2019: A. Proportion of DALYs and death in cirrhosis due to alcohol use; B. Proportion of DALYs and death in cirrhosis due to drug use. DALYs, Disability Adjusted Life Year; GBD, Global Burden of Disease, Injury, and Risk Factors Study. Source: Institute for Health Metrics and Evaluation. Used with permission. All rights reserved.
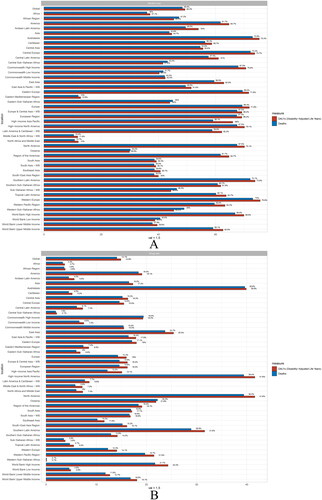
Drug use has a smaller effect on cirrhosis than alcohol use. Globally, 14.9% of DALYs and 14.1% of deaths were attributed to drug use. The effect of drug use was greatest in North America and high–income North America (41.6% of DALYs and 39.4% of deaths), whereas the effect was smallest in Western Sub–Saharan Africa (0.1% of DALYs and deaths) ().
3.4. Correlation analysis of EAPC with ASR and HDI
Further, we analysed the correlation between EAPC, ASR, and HDI. In 1990, EAPC showed a significant negative correlation with ASIR (ρ = −0.29, p < 0.001) and ASDR (ρ = −0.17, p = 0.0137) (). Interestingly, as of 2019, there is a significant positive correlation between EAPC and ASIR (ρ = 0.34, p < 0.001) and ASDR (ρ = 0.22, p = 0.0018) (). As a result, the pattern of cirrhosis has changed considerably over the past 30 years. Surprisingly, there was no significant correlation between HDI and EAPC (p > 0.05) ().
Figure 7. Correlation of EAPC with cirrhosis ASR and HDI: A. Correlation of EAPC with cirrhosis ASIR and ASDR in 1990. B. Correlation of EAPC with 2019 cirrhosis ASIR and ASDR. C. Correlation of EAPC with 2019 HDI. The circles in the figure represent countries, and the size of the circles represents the number of cases of cirrhosis. ρ and P values were obtained from Pearson correlation coefficient analysis. ASR, age–standardized rate; ASIR, age–standardized Incidence rate; ASDR, age–standardized death rate; EAPC, estimated annual percentage change; HDI, human development index. Source: Institute for Health Metrics and Evaluation. Used with permission. All rights reserved.
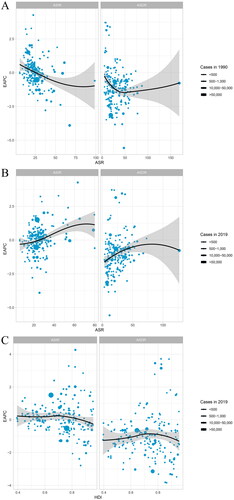
Therefore, we found a significant negative association of EAPC with baseline ASR in 1990 but showed a significant positive association in 2019. The reasons may be related to two factors, first, the lower the baseline of ASR, the more significant the changes. Second, cirrhosis has insufficient priority over other public problems, so these countries with lower ASR will invest fewer resources in it. While in 2019, countries with higher ASR were more likely to increase liver cirrhosis. This result may be attributed to the aging population, with a large elderly population increasing the incidence of cirrhosis.
3.5. Changes in ASR trends in cirrhosis by SDI–based region and country
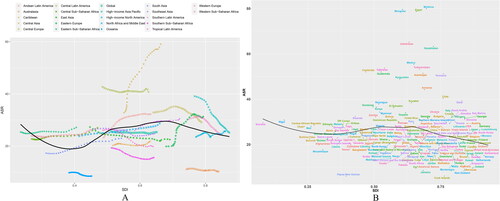
As shown in , we studied the variation trend of ASR based on SDI in different regions and countries. The changes in North Africa and the Middle East, South Asia, and southern Latin America are consistent with the expected trends. However, in many areas of the mid–posterior region of SDI, the phase ASR fluctuates greatly. For example, ASR in central Asia was significantly higher than expected, and the fluctuation increased. Although the overall ASR of the high–income Asia Pacific region is higher than expected the fluctuation decreases (). At the national level, with some exceptions, the ASR of liver cirrhosis was negatively associated with SDI in various countries in 2019 ().
Figure 8. ASR trends in cirrhosis by socio–demographic index, 1990–2019: A. 21 GBD regions; B. 204 countries and territories. Expected values for sociodemographic indices and disease incidence based on all sites are shown as black lines. ASR, age–standardized rate; GBD, Global Burden of Diseases, Injuries, and Risk Factors Study. Source: Institute for Health Metrics and Evaluation. Used with permission. All rights reserved.
3.6. Prediction of global cirrhosis incidence
Further, we predicted the number of episodes of liver cirrhosis in the next 20 years by using the Nordpred and the BAPC software packages of the R software. The results found that the number of cirrhosis increased. Based on the Nordpred model analysis, the incidence number of liver cirrhosis has increased from 1,317,848.92 in 1990–1994 to 2,409,435.31 in 2035–2039 ( and Supplementary Table 3). The BAPC analysis similarly indicated that the incidence number of liver cirrhosis had increased from 1,273,961 in 1990 to 3,438,491 in 2039 ( and Supplementary Table 3).
Figure 9. Statistics and predictions of the number of cases in all age groups: A. Prediction based on Nordpred model; B. Prediction based on BAPC model. Source: Institute for Health Metrics and Evaluation. Used with permission. All rights reserved.
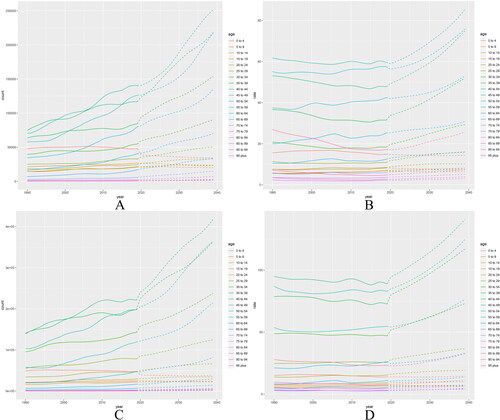
In all age groups, the analysis found that the number of cases of liver cirrhosis showed a rising trend, and the incidence rate was relatively stable and slightly increased (, Supplementary Tables 4 and 5). The same conclusion was obtained using the BAPC model, but the growth was more (, Supplementary Tables 6–9). The reason for the larger increase in the BAPC model may be that the Nordpred model analysis uses the average of the 5–year data, which makes the increase less obvious than the BAPC model analysis due to the average.
Figure 10. Cirrhosis incidence 1990–2019 and projections for the next 20 years, stratified by gender: A. Number of female cases; B. Female incidence rate; C. Number of male cases; D. Male incidence rate. Prediction of changes over the next 20 years based on the Nordpred model. Source: Institute for Health Metrics and Evaluation. Used with permission. All rights reserved.
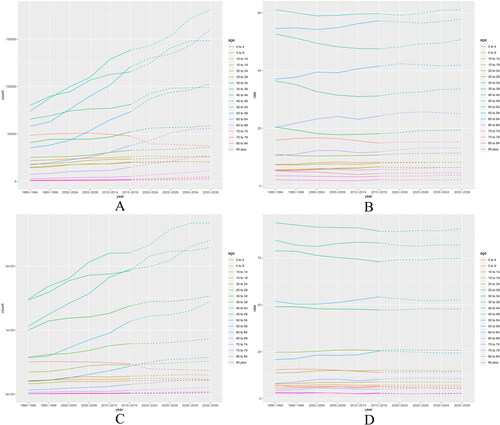
Figure 11. Cirrhosis incidence 1990–2019 and projections for the next 20 years, stratified by gender: A. Number of female cases; B. Female incidence rate; C. Number of male cases; D. Male incidence rate. Prediction of changes over the next 20 years based on the BAPC model. Source: Institute for Health Metrics and Evaluation. Used with permission. All rights reserved.
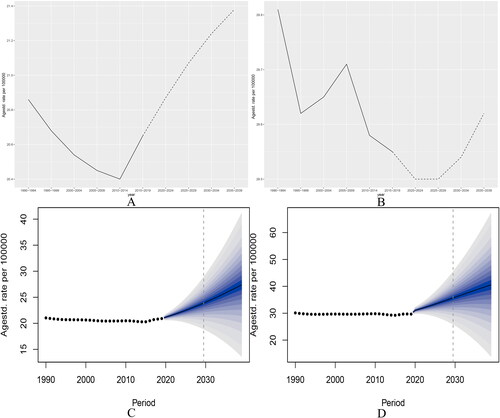
Due to changes in time and age, we projected ASR changes in the next 20 years based on the analysis of ASR changes in cirrhosis over the past 30 years. Nordpred model analysis showed that ASR in females decreased from 20.86 per 100 in 1990–1994 to 20.4 in 2010–2014 and then continued to increase to 21.38 in 2035–2039 ( and Supplementary Table 10). However, the ASR for males was 29.81 per 100,000 in 1990–1994, then fluctuated and dropped to 29.5 in 2020–2024 and then rose to 29.62 in 2035–2039 ( and Supplementary Table 10). The prediction results of the BAPC model showed a similar trend change. The ASR value for females fluctuated from (21.04206 ± 2.96e–07) per 100,000, in 1990 to the lowest level in 2014 (20.29454 ± 2.30e–07), and then gradually increased to (27.38541 ± 7.01e–05) ( and Supplementary Table 11) in 2039. Similarly, the 1990 ASR value for males was (30.10715 ± 3.47e–07) per 100,000, then fluctuated and reached the lowest (29.24959 ± 2.73e–07) in 2015, and then gradually rose to (40.54755 ± 1.36E–04) ( and Supplementary Table 11) in 2039.
Figure 12. Statistics and predictions of cirrhosis ASR for different genders: A and B are based on the Nordpred model for females and males, respectively; C and D are based on the BAPC model, respectively. ASR, age–standardized rate. Source: Institute for Health Metrics and Evaluation. Used with permission. All rights reserved.
Combined with the above analysis, it is clear that the incidence of liver cirrhosis will continue to rise in the future, and that the risk of developing liver cirrhosis is always much higher in males than in females.
4. Discussion
Our study is the first to report on changing trends in liver cirrhosis at the global, regional, and national levels over 30 years, and predicts changes over the next 20 years. Furthermore, the targeted analysis of the etiology, risk factors, and the impact of HDI and SDI on ASR, could further guide national healthcare policy development and the implementation of related interventions.
Globally, the number of cases of liver cirrhosis has increased by more than seven hundred thousand cases between 1990 and 2019, reaching a staggering more than 2 million cases by 2019, but the ASR has declined. The reason for this contradiction should be attributed to the rapid increase in population size and aging degree [Citation12,Citation13]. Furthermore, we noted significant differences in ASR across regions. In 2019, the ASR in the central Asia area was as high as 59.1 per 100,000, while the lowest Oceania area was only 8.5 (). This difference is mainly caused by the types of viral infection, alcohol consumption level, social development level, and the abundance of medical resources [Citation4]. The country–level analysis found the most pronounced decline in the incidence of cirrhosis in the Republic of Korea. Between 1990 and 2019, the number of cases of liver cirrhosis decreased by 43.9%, and the ASR decreased by 3.9% annually (). The reason for this beneficial change should come from the introduction of vaccination in 1983 and the national immunization in 1995, which reduced the prevalence of hepatitis virus and thus caused a significant decrease in the incidence of cirrhosis [Citation14]. Therefore, immunization at the national level is very effective in reducing the disease burden of liver cirrhosis.
The etiology of liver cirrhosis has similarly changed significantly over the last 30 years. In 1990, the main cause of liver cirrhosis was hepatitis B virus infection (24.3%), but by 2019, HCV infection rose to first place (26.9%) (). The all–age prevalence of chronic hepatitis B decreased in all WHO regions between 1990 and 2019, from 6.0% in 1990 to 31 to 4.1% in 2019 [Citation15]. This beneficial change was largely attributed to the availability of the hepatitis B vaccine, with its global coverage estimated at 81% by the end of 2013, and with childhood universal vaccination systems established in 183 out of 194 countries [Citation16]. Our finding that East Asia continues to have the highest rate of HBV–related cirrhosis globally is consistent with the study by Lan et al. [Citation17]. This is mainly due to the large number of hepatitis B patients in China, where about 30% of cirrhosis cases in 2019 were HBV–related [Citation18]. As the other virus, which causes the most liver cirrhosis except for hepatitis B virus, the prevalence of HCV remained relatively stable between 1990 and 2019 [Citation8,Citation11,Citation19]. Therefore, the proportion of liver cirrhosis caused by hepatitis C has increased.
Notably, cirrhosis caused by non–alcoholic steatohepatitis (NASH), a type of NAFLD, is on the rise. A recent meta–analysis of population–based studies suggests that the incidence of NASH has increased globally in recent years [Citation20]. According to NHANES data, the prevalence of NASH cirrhosis increased 2.5–fold from 1999–2002 to 2009–2012 [Citation21]. Ye et al. also showed that the death rate of cirrhosis caused by NASH was increasing, and the increase was most obvious in Asia [Citation22]. The burden of cirrhosis due to NASH will grow due to the global increase in metabolic syndrome and obesity and the lack of viable treatments [Citation23,Citation24]. It is particularly alarming that NASH has become one of the leading causes of liver cancer worldwide [Citation25]. Therefore, weight loss to maintain a normal BMI range to reduce the risk of the metabolic syndrome caused by NASH should be actively promoted worldwide [Citation26,Citation27].
Cirrhosis caused by alcohol use still cannot be ignored. According to our analysis, the proportion of alcoholic cirrhosis and its impact on deaths and DALYs were highest in Central and Western Europe ( and ). A previous study based on GBD 2017 similarly supported our conclusions. The study showed that the highest proportion of alcohol–related cirrhosis deaths was in Central Europe (44.0%) and Western Europe (41.7%) [Citation8]. The burden of disease analysis of alcoholic cirrhosis in the study by Zhang et al. showed that the largest increase in age–standardized death rates was observed in the Eastern European region, whereas the decline was observed in the Western European region [Citation28]. In previous studies, alcohol consumption per capita was high in Eastern Europe and the prevalence of harmful alcohol consumption was still increasing in this region [Citation29,Citation30]. Together with our study, we can predict that the proportion of alcohol–related cirrhosis deaths in Eastern Europe will increase significantly in the future. Thus, regions with a high burden of alcohol–related cirrhosis, such as Central and Western Europe, could reduce alcohol consumption through policies such as increasing alcohol taxes, implementing minimum prices, and raising the national legal drinking age [Citation30,Citation31]. However, alcohol use in the Middle East has the lowest DALYs (11.8%) and deaths (10.4%), which is largely related to religious practices in the region [Citation4]. Unsurprisingly, drug use in North America and high–income North America caused the highest DALYs (41.6%) and deaths (39.4%) (). Previous studies have shown that drug use is the second largest route of HCV transmission, widely affecting industrialized countries, especially the United States [Citation32]. The rise in HCV infection in recent years the high levels of DALYs and deaths in liver cirrhosis due to drug use are directly related in North America.
Although there are some exceptions, the age–standardized incidence of liver cirrhosis is inversely associated with SDI at the national level. Correspondingly, a previous GBD 2017–based study showed that higher SDI levels also showed lower DALYs and deaths [Citation8]. In general, a higher SDI in a country is associated with higher economic, educational, and healthcare levels [Citation33]. The study by Gorgani et al. also confirmed that the quality–of–care index (Qci) was higher in countries with high SDI [Citation34]. Therefore, well–developed infrastructure, higher education level, and medical quality may be associated with lower ASR of liver cirrhosis in areas with high SDI. Notably in Central Asia and Latin America, the ASR was significantly higher than at baseline and tended to increase (). As in the previous analysis in this paper, DALYs and deaths were equally high in alcohol use in these two areas (). The study by Manthey et al. also showed a high prevalence of alcohol use disorders in Central Asia [Citation35]. Therefore, reasoned that the abnormal increase in ASR in these two regions should be attributed to alcohol use and that alcoholic cirrhosis due to high alcohol consumption should be the primary cause of the remaining high ASR in both regions [Citation36,Citation37].
Both Nordpred and BAPC models predict a significant increase in the number of cirrhosis cases over the next 20 years (). This trend may result from the following two reasons, first, the growth and aging of the global population [Citation38]. Second, there is an increased incidence of cirrhosis. As shown in , the results predicted by both models indicated that the ASR of liver cirrhosis showed an overall increasing trend in the two decades after 2019. Interestingly, we found that the ASR of liver cirrhosis did not show a consistent upward trend since 1990 but fluctuated downward and then increased. Clearly, the decline in cirrhosis ASR has been due to widespread vaccination, screening, and antiviral treatment, but the increase in injection drug use, alcohol abuse, and metabolic syndrome in recent years has largely offset these benefits and will make the burden of cirrhosis even greater in the future [Citation39].
Analyses for 1990–2019 and projections for the next 20 years both suggest that ASR is significantly higher in males than in females with cirrhosis. This difference stems from higher HBV and HCV infection, alcohol consumption, and drug injection in males [Citation17,Citation40]. Previous studies have shown that females have higher rates of hepatitis B surface antigen clearance and seroconversion, higher rates of hepatitis C virus clearance, and better response to interferon therapy [Citation41–43]. In addition, oestrogen in premenopausal females can inhibit hepatic stellate cell activation and fibrosis, and lower alcohol consumption in females also leads to a significantly lower incidence of alcoholic liver disease than in males [Citation37,Citation44,Citation45]. Thus, the combination of these factors contributes to a much higher global burden of cirrhosis among males than among females.
In recent years, the refugee problem caused by war, poverty, and economic and social reasons has also changed the disease burden of cirrhosis. Globally, refugees mostly come from developing countries in the south and enter advanced economies such as North America and Western Europe [Citation46]. It is estimated that about 10% of the population of the European Region are migrants or refugees [Citation47]. In addition, Italy has about half a million refugees, mainly from Central and East Asia, North Africa, Sub–Saharan Africa, and Eastern Europe [Citation48]. However, these refugees often come from countries that have moderate or high prevalence rates of viral liver disease [Citation49,Citation50]. A survey of 12,880 refugees in Germany showed a significantly higher HCV seroprevalence than the general German population [Citation51]. Coppola et al. screened 882 refugees from Italy and found that the HBV seropositive rate was as high as 8%, which was significantly higher than the level of the Italian native population [Citation52]. Similarly, a recent survey of refugees in Ontario, Canada, found a higher incidence of HBV–related cirrhosis among refugees than among native populations [Citation53]. Therefore, the entry of refugees with high rates of viral hepatitis and the associated development of cirrhosis can greatly challenge the health care system of the host country. Strengthening the education of related protection knowledge, popularizing the detection of hepatitis virus infection, and injecting hepatitis B vaccine are effective methods to reduce the burden of liver cirrhosis in refugees.
In addition, considering that treatment of cirrhosis other than liver transplantation is not very prominent in improving the survival benefit of patients with decompensated cirrhosis [Citation54]. Therefore, more extensive and effective methods should be implemented to prevent the occurrence of liver cirrhosis. The government should further formulate necessary public health policies to intervene in high–burden areas and high–risk populations. Examples include strengthening hepatitis B vaccination and publicizing the dangers of alcohol use and obesity. In addition, screening for transient elastography should be encouraged in patients with metabolic syndrome, chronic alcohol use, and chronic hepatitis for early diagnosis. We should not only focus on developed and developing regions but also provide essential vaccines and medicines to underdeveloped regions. Therefore, cooperation among countries and coordination among international organizations play a crucial role in reducing the global burden of liver cirrhosis.
Although the analysis of GBD in this paper can largely conclude the burden of liver cirrhosis and projections for the future, the text still has several limitations. First, this paper mainly discusses the trend of the incidence of liver cirrhosis, the number of patients with liver cirrhosis, and the forecast value up to 2039. However, the analysis and prediction of DALYs and death trends were not analysed, only the changes in these two indicators caused by different risk factors in 1990 and 2019 were analysed. Further analyses of DALYs and deaths in liver cirrhosis are planned to better describe the disease burden of liver cirrhosis and complement the present study. Second, the accuracy of GBD estimation largely depends on the quality and quantity of the data. As in the analysis of risk factors for cirrhosis, we did not find data on smoking in the database to analyze its effect on cirrhosis. Third, the assessment of exposure risk has a delayed effect. Although we assessed SEV, DALYs, and Deaths attributable to alcohol and drug use, further follow–up is needed to determine whether related exposures contribute to the increased risk of long–term cirrhosis.
5. Conclusions
In conclusion, from 1990 to 2019, the ASR of liver cirrhosis showed a downward trend worldwide, but the number of cases continued to rise. HCV infection has also replaced HBV as the leading cause of cirrhosis. In addition, alcohol consumption as a risk factor for cirrhosis should raise alarm. Finally, our projections suggest that the number and incidence of cirrhosis will continue to increase until 2039. As a result, the global burden of cirrhosis will continue to increase, and countries should adopt broader and more effective approaches to prevent cirrhosis based on its most common causes.
Author contributions
Yikai Wang conceived and designed the study. Yikai Wang analyzed data and wrote the manuscript. Muqi Wang and Chenrui Liu, checked the analysis results. Miao Hao, Wenjun Wang, and Juanjuan Shi helped collect data and references. Yaping Li, Xiaoli Jia, and Xin Zhang checked the article’s format and language. Shuangsuo Dang is responsible for the overall content as a guarantor.
Ethical approval and consent to participate
The institutional review board of the Second Affiliated Hospital of Xi’an Jiaotong University in Shaanxi Province, China, determined that the study did not need approval because it used publicly available data.
Supplemental Material
Download Zip (269.6 KB)Acknowledgements
The authors thank everyone working for this study. We also appreciate the work of the Global Burden of Disease study 2019 collaborators.
Disclosure statement
No potential conflict of interest was reported by the author(s).
Data availability statement
The data were obtained through an online query tool from the website of IHME (http://ghdx.healthdata.org/), and no permissions were required to access the data.
Additional information
Funding
References
- Pinzani M, Rosselli M, Zuckermann M. Liver cirrhosis. Best Pract Res Clin Gastroenterol. 2011;25 (2):1–34. doi: 10.1016/j.bpg.2011.02.009.
- Tsochatzis EA, Bosch J, Burroughs AK. Liver cirrhosis. Lancet. 2014;383 (9930):1749–1761. doi: 10.1016/S0140–6736(14)60121–5.
- Schuppan D, Afdhal NH. Liver cirrhosis. Lancet. 2008;371 (9615):838–851. doi: 10.1016/s0140–6736(08)60383–9.
- Mokdad AA, Lopez AD, Shahraz S, et al. Liver cirrhosis mortality in 187 countries between 1980 and 2010: a systematic analysis. BMC Med. 2014;12 (1):145. doi: 10.1186/s12916–014–0145–y.
- Digestive diseases in the United States: epidemiology and Impact. NIDDK; Bethesda, MD: 1994. NIH Publication No. 94–1447.
- National Center for Health Statistics. US Department of Health and Human Services, Centers for Disease Control and Prevention; Hyattsville, MD: 2005. Series 13.
- Li M, Wang ZQ, Zhang L, et al. Burden of cirrhosis and other chronic liver diseases caused by specific etiologies in China, 1990–2016: findings from the global burden of disease study 2016. Biomed Environ Sci. 2020;33 (1):1–10. doi: 10.3967/bes2020.001.
- Collaborators, G.B.D.C. The global, regional, and national burden of cirrhosis by cause in 195 countries and territories, 1990–2017: a systematic analysis for the global burden of disease study 2017. Lancet Gastroenterol Hepatol. 2020;5 (3):245–266. doi: 10.1016/S2468–1253(19)30349–8.
- Vos T, Lim SS, Abbafati C, et al. Global burden of 369 diseases and injuries in 204 countries and territories, 1990–2019: a systematic analysis for the global burden of disease study 2019. Lancet. 2020;396 (10258):1204–1222. doi: 10.1016/S0140–6736(20)30925–9.
- Golabi P, Paik JM, AlQahtani S, et al. Burden of non–alcoholic fatty liver disease in asia, the Middle east and North africa: data from global burden of disease 2009–2019. J Hepatol. 2021;75 (4):795–809. doi: 10.1016/j.jhep.2021.05.022.
- Liu Z, Jiang Y, Yuan H, et al. The trends in incidence of primary liver cancer caused by specific etiologies: results from the global burden of disease study 2016 and implications for liver cancer prevention. J Hepatol. 2019;70 (4):674–683. doi: 10.1016/j.jhep.2018.12.001.
- Xiao S, Xie W, Zhang Y, et al. Changing epidemiology of cirrhosis from 2010 to 2019: results from the global burden disease study 2019. Ann Med. 2023;55 (2):2252326. doi: 10.1080/07853890.2023.2252326.
- Tan D, Chan KE, Wong ZY, et al. Global epidemiology of cirrhosis: changing etiological basis and comparable burden of nonalcoholic steatohepatitis between males and females. Dig Dis. 2023;41 (6):900–912. doi: 10.1159/000533946.
- Yim SY, Kim JH. The epidemiology of hepatitis B virus infection in korea. Korean J Intern Med. 2019;34 (5):945–953. doi: 10.3904/kjim.2019.007.
- Collaborators, G.B.D.H.B. Global, regional, and national burden of hepatitis B, 1990–2019: a systematic analysis for the global burden of disease study 2019. Lancet Gastroenterol Hepatol. 2022;7 (9):796–829. doi: 10.1016/S2468–1253(22)00124–8.
- Wiktor SZ. Viral hepatitis. In: Holmes KK, Bertozzi S, Bloom BR, Jha P, Editors. Major infectious diseases. Washington (DC): The International Bank for Reconstruction and Development/The World Bank© 2017 International Bank for Reconstruction and Development/The World Bank., 2017.
- Lan Y, Wang H, Weng H, et al. The burden of liver cirrhosis and underlying etiologies: results from the global burden of disease study 2019. Hepatol Commun. 2023;7 (2):e0026–e0026–e0026. doi: 10.1097/hc9.0000000000000026.
- Huang P, Zhu LG, Zhu YF, et al. Seroepidemiology of hepatitis B virus infection and impact of vaccination. World J Gastroenterol. 2015;21 (25):7842–7850. doi: 10.3748/wjg.v21.i25.7842.
- Ouyang G, Pan G, Guan L, et al. Incidence trends of acute viral hepatitis caused by four viral etiologies between 1990 and 2019 at the global, regional and national levels. Liver Int. 2022;42 (12):2662–2673. doi: 10.1111/liv.15452.
- Riazi K, Azhari H, Charette JH, et al. The prevalence and incidence of NAFLD worldwide: a systematic review and meta–analysis. Lancet Gastroenterol Hepatol. 2022;7 (9):851–861. doi: 10.1016/s2468–1253(22)00165–0.
- Kabbany MN, Conjeevaram Selvakumar PK, Watt K, et al. Prevalence of nonalcoholic Steatohepatitis–Associated cirrhosis in the United States: an analysis of national health and nutrition examination survey data. Am J Gastroenterol. 2017;112 (4):581–587. doi: 10.1038/ajg.2017.5.
- Ye F, Zhai M, Long J, et al. The burden of liver cirrhosis in mortality: results from the global burden of disease study. Front Public Health. 2022;10:909455. doi: 10.3389/fpubh.2022.909455.
- Diehl AM, Day C. Cause, pathogenesis, and treatment of nonalcoholic steatohepatitis. N Engl J Med. 2017;377 (21):2063–2072. doi: 10.1056/NEJMra1503519.
- Younossi ZM, Koenig AB, Abdelatif D, et al. Global epidemiology of nonalcoholic fatty liver disease–Meta–analytic assessment of prevalence, incidence, and outcomes. Hepatology. 2016;64 (1):73–84. doi: 10.1002/hep.28431.
- Huang DQ, Singal AG, Kono Y, et al. Changing global epidemiology of liver cancer from 2010 to 2019: NASH is the fastest growing cause of liver cancer. Cell Metab. 2022;34 (7):969–977 e2. doi: 10.1016/j.cmet.2022.05.003.
- Lazarus JV, Mark HE, Anstee QM, et al. Advancing the global public health agenda for NAFLD: a consensus statement. Nat Rev Gastroenterol Hepatol. 2022;19 (1):60–78. doi: 10.1038/s41575–021–00523–4.
- Karlsen TH, Sheron N, Zelber–Sagi S, et al. The EASL–Lancet liver commission: protecting the next generation of europeans against liver disease complications and premature mortality. Lancet. 2022;399 (10319):61–116. doi: 10.1016/S0140–6736(21)01701–3.
- Zhang X, Zhang X, Liu M, et al. Global, regional, and national burden of cirrhosis and other chronic liver diseases due to alcohol use, 1990–2019: a systematic analysis for the global burden of disease study 2019. BMC Gastroenterol. 2022;22 (1):484. doi: 10.1186/s12876–022–02518–0.
- Shield K, Manthey J, Rylett M, et al. National, regional, and global burdens of disease from 2000 to 2016 attributable to alcohol use: a comparative risk assessment study. Lancet Public Health. 2020;5 (1):e51–e61. doi: 10.1016/S2468–2667(19)30231–2.
- Collaborators GBDA. Population–level risks of alcohol consumption by amount, geography, age, sex, and year: a systematic analysis for the global burden of disease study 2020. Lancet. 2022;400 (10347):185–235. doi: 10.1016/S0140–6736(22)00847–9.
- Paik J, Henry L, Younossi Y, et al. The global burden of liver cancer (LC) and chronic liver diseases (CLD) is driven by non–alcoholic steatohepatitis (NASH) and alcohol liver disease (ALD). Journal of Hepatology. 2022;77: s 5–S7. doi: 10.1016/s0168–8278(22)00435–4.
- Suryaprasad AG, White JZ, Xu F, et al. Emerging epidemic of hepatitis C virus infections among young nonurban persons who inject drugs in the United States, 2006–2012. Clin Infect Dis. 2014;59 (10):1411–1419. doi: 10.1093/cid/ciu643.
- Global Burden of Disease Health Financing Collaborator, N. Past, present, and future of global health financing: a review of development assistance, government, out–of–pocket, and other private spending on health for 195 countries, 1995–2050. Lancet. 2019;393 (10187):2233–2260. doi: 10.1016/S0140–6736(19)30841–4.
- Gorgani F, Esfahani Z, Ghamari SH, et al. Global, regional, and national burden and quality of care index of liver cirrhosis by cause from global burden of disease 1990–2019. J Gastroenterol Hepatol. 2023;38 (1):119–128. doi: 10.1111/jgh.16041.
- Manthey J, Shield KD, Rylett M, et al. Global alcohol exposure between 1990 and 2017 and forecasts until 2030: a modelling study. Lancet. 2019;393 (10190):2493–2502. doi: 10.1016/s0140–6736(18)32744–2.
- Liangpunsakul S, Haber P, McCaughan GW. Alcoholic liver disease in asia, Europe, and North America. Gastroenterology. 2016;150 (8):1786–1797. doi: 10.1053/j.gastro.2016.02.043.
- Griswold MG, Fullman N, Hawley C, et al. Alcohol use and burden for 195 countries and territories, 1990–2016: a systematic analysis for the global burden of disease study 2016. Lancet. 2018;392 (10152):1015–1035. doi: 10.1016/S0140–6736(18)31310–2.
- Murray CJL, Callender CSKH, Kulikoff XR, et al. Population and fertility by age and sex for 195 countries and territories, 1950–2017: a systematic analysis for the global burden of disease study 2017. Lancet. 2018;392 (10159):1995–2051. doi: 10.1016/S0140–6736(18)32278–5.
- Moon AM, Singal AG, Tapper EB. Contemporary epidemiology of chronic liver disease and cirrhosis. Clin Gastroenterol Hepatol. 2020;18 (12):2650–2666. doi: 10.1016/j.cgh.2019.07.060.
- Zhang T, Xu J, Ye L, et al. Age, gender and geographic differences in global health burden of cirrhosis and liver cancer due to nonalcoholic steatohepatitis. J Cancer. 2021;12 (10):2855–2865. doi: 10.7150/jca.52282.
- Zacharakis GH, Koskinas J, Kotsiou S, et al. Natural history of chronic HBV infection: a cohort study with up to 12 years follow–up in North Greece (part of the interreg I–II/EC–project). J Med Virol. 2005;77 (2):173–179. doi: 10.1002/jmv.20434.
- Di Martino V, Lebray P, Myers RP, et al. Progression of liver fibrosis in women infected with hepatitis C: long–term benefit of estrogen exposure. Hepatology. 2004;40 (6):1426–1433. doi: 10.1002/hep.20463.
- Villa E, Karampatou A, Cammà C, et al. Early menopause is associated with lack of response to antiviral therapy in women with chronic hepatitis C. Gastroenterology. 2011;140 (3):818–829.e2. doi: 10.1053/j.gastro.2010.12.027.
- Codes L, Asselah T, Cazals–Hatem D, et al. Liver fibrosis in women with chronic hepatitis C: evidence for the negative role of the menopause and steatosis and the potential benefit of hormone replacement therapy. Gut. 2007;56 (3):390–395. doi: 10.1136/gut.2006.101931.
- Yasuda M, Shimizu I, Shiba M, et al. Suppressive effects of estradiol on dimethylnitrosamine–induced fibrosis of the liver in rats. Hepatology. 1999;29 (3):719–727. doi: 10.1002/hep.510290307.
- Coppola N, Alessio L, Onorato L, et al. Epidemiology and management of hepatitis C virus infections in immigrant populations. Infect Dis Poverty. 2019;8 (1):17. doi: 10.1186/s40249–019–0528–6.
- https://www.who.int/health–topics/refugee–and–migrant–health#tab=tab_1.
- Coppola N, Alessio L, Gualdieri L, et al. Hepatitis B virus infection in undocumented immigrants and refugees in Southern Italy: demographic, virological, and clinical features. Infect Dis Poverty. 2017;6 (1):33. doi: 10.1186/s40249–016–0228–4.
- Sharma S, Carballo M, Feld JJ, et al. Immigration and viral hepatitis. J Hepatol. 2015;63 (2):515–522. doi: 10.1016/j.jhep.2015.04.026.
- Pisaturo M, Alessio L, Starace M, et al. Characterization of hepatitis virus co–infections in a cohort of immigrants living in Southern Italy. J Med Virol. 2023;95 (3):e28665. doi: 10.1002/jmv.28665.
- Mattlinger C, Thumfart JO, Heinen W[, et al. Hepatitis C virus seroprevalence and dependency on country of origin of refugees in Rhineland–Palatinate, Germany in 2015]. Bundesgesundheitsblatt Gesundheitsforschung Gesundheitsschutz. 2018;61 (11):1472–1480. doi: 10.1007/s00103–018–2816–x.
- Coppola N, Alessio L, Gualdieri L, et al. Hepatitis B virus, hepatitis C virus and human immunodeficiency virus infection in undocumented migrants and refugees in Southern Italy, january 2012 to june 2013. Euro Surveill. 2015;20 (35):30009. doi: 10.2807/1560–7917.ES.2015.20.35.30009.
- Sayed N, Selzner N, Djerboua M, et al. Incidence of cirrhosis among recent immigrants and refugees to Ontario, Canada. Am J Gastroenterol. 2023;118 (7):1289–1292. doi: 10.14309/ajg.0000000000002214.
- Gluud C. Mortality from cirrhosis: lack of progress over the last 35 years. Gut. 2005;54 (11):1523–1526. doi: 10.1136/gut.2005.072876.