
Abstract
Background and Aim
This study aims to validate the efficacy of the conventional non-invasive score in predicting significant fibrosis in metabolic-associated fatty liver disease (MAFLD) and to develop a non-invasive prediction model for MAFLD.
Methods
This cross-sectional study was conducted among 7701 participants with MAFLD from August 2018 to December 2023. All participants were divided into a training cohort and a validation cohort. The study compared different subgroups’ demographic, anthropometric, and laboratory examination indicators and conducted logistic regression analysis to assess the correlation between independent variables and liver fibrosis. Nomograms were created using the logistic regression model. The predictive values of noninvasive models and nomograms were evaluated using receiver operating characteristic (ROC) curve analysis and decision curve analysis (DCA).
Results
Four nomograms were developed for the quantitative analysis of significant liver fibrosis risk based on the multivariate logistic regression analysis results. The nomogram’s area under ROC curves (AUC) was 0.710, 0.714, 0.748, and 0.715 in overall MAFLD, OW-MAFLD, Lean-MAFLD, and T2DM-MAFLD, respectively. The nomogram had a higher AUC in all MAFLD participants and OW-MAFLD than the other non-invasive scores. The DCA curve showed that the net benefit of each nomogram was higher than that of APRI and FIB-4. In the validation cohort, the AUCs of the nomograms were 0.722, 0.750, 0.719, and 0.705, respectively.
Conclusion
APRI, FIB-4, and NFS performed poorly predicting significant fibrosis in patients with MAFLD. The new model demonstrated improved diagnostic accuracy and clinical applicability in identifying significant fibrosis in MAFLD.
Introduction
Nonalcoholic fatty liver disease (NAFLD) is a chronic liver disease characterized by the excessive accumulation of fat in the liver [Citation1]. In 2020, due to shared risk factors and pathogenesis, international experts unanimously recommended changing the disease’s acronym from NAFLD to Metabolic Dysfunction Associated Fatty Liver Disease (MAFLD) [Citation2]. This proposal has since gained widespread consensus from experts globally. The diagnostic criteria for MAFLD are hepatic steatosis accompanied by overweight or obesity, type 2 diabetes mellitus (T2DM), or more than two metabolic risk abnormalities. According to a recent meta-analysis, MAFLD affects more than one-third of the world’s population, with a prevalence of 38.77% [Citation3].
Liver fibrosis is a crucial factor in assessing the prognosis of chronic liver disease, as it is an independent risk factor for the development of liver cirrhosis and hepatocellular carcinoma [Citation4]. Patients with NAFLD undergo various stages of fibrosis, which can ultimately lead to cirrhosis. The development and progression of liver fibrosis are closely linked to the adverse outcomes of NAFLD [Citation5–7]. The progression of liver lesions in patients with MAFLD is comparable to that of NAFLD. Therefore, it is crucial to detect patients with significant fibrosis to improve the management of MAFLD.
While liver biopsy is widely regarded as the most accurate method for diagnosing liver fibrosis, its invasiveness, potential sampling differences, poor acceptability, and the high prevalence of NAFLD limit its widespread use in diagnosing NAFLD [Citation8,Citation9]. Therefore, a reliable noninvasive fibrosis score is needed to overcome these limitations. The most commonly used non-invasive fibrosis models are the aspartate aminotransferase to platelet ratio index (APRI), the fibrosis score-4 (FIB-4), and the nonalcoholic fatty liver disease fibrosis score (NFS). These models have been tested and have shown strong performance in predicting fibrosis in NAFLD [Citation10–13].
It is widely acknowledged that metabolic profiles are associated with the risk of severe fibrosis in patients with NAFLD [Citation14]. As MAFLD is primarily defined by metabolic abnormalities of the fatty liver and fibrosis progression differs from that of NAFLD, it is essential to reassess the applicability of conventional noninvasive fibrosis scores to MAFLD. Additionally, exploring the possibility of establishing a new noninvasive prediction model is worthwhile. This study aims to validate the effectiveness of the conventional non-invasive score in predicting significant fibrosis in MAFLD and to develop a non-invasive prediction model for MAFLD.
Materials and methods
Participants
This cross-sectional study included 7701 adult participants diagnosed with MAFLD at Changzhou Third People’s Hospital between August 2018 and December 2023. Exclusion criteria comprised age < 18 years old, history of hepatocellular carcinoma or liver surgery, acute or severe infection, history of malignant tumors, chronic kidney disease, and incomplete data. The participants were divided into a training cohort and a validation cohort. The study was conducted in accordance with the Helsinki Declaration and approved by the Ethics Committee of Changzhou Third People’s Hospital. As this is a retrospective study and the clinical data was previously collected without patient contact, we applied for an exemption from obtaining informed consent during the ethical review. The patient’s personal information has been anonymized and kept confidential. The research project does not involve any personal privacy or commercial interests.
Disease definition
This study defined hepatic steatosis based on abdominal ultrasonography conducted by proficient sonographers. T2DM was diagnosed based on fasting plasma glucose (FPG) ≥ 7.0 mmol/L or glycated hemoglobin (HbA1c) ≥ 6.5% or treatment with an antidiabetic drug [Citation15]. MAFLD was defined as fatty liver present with overweight (Body Mass Index (BMI) ≥ 23 kg/m2) or T2DM, or at least two metabolic risk abnormalities. The criteria for metabolic syndrome are 1) waist circumference (WC) ≥ 90 cm for males and ≥ 80 cm for females; 2) blood pressure ≥ 130/85 mmHg; 3) plasma triglycerides (TG) ≥ 1.70 mmol/L; 4) plasma high-density lipoprotein cholesterol (HDL-c) < 1.0 mmol/L for males and < 1.3 mmol/L for females; 5) FPG 5. 6 to 6.9 mmol/L, or 2-h post-load glucose levels 7.8 to 11.0 mmol/L, or HbA1c 5.7% to 6.4%; 6) homeostasis assessment of Insulin resistance score ≥ 2.5; and 7) plasma high-sensitivity C-reactive protein level > 2 mg/L [Citation2]. The classification of MAFLD includes three subtypes: OW-MAFLD for those who are overweight or obese, T2DM-MAFLD for those with type 2 diabetes, and Lean-MAFLD for those with metabolic dysfunction who have a lean or normal weight.
Body measurements and laboratory test
The study participants’ height and weight were measured as part of routine procedures, and their BMI was calculated by dividing weight by the square of height (kg/m2). WC was measured at the midpoint between the edge of the ribs and the ilium’s superior border at the expiration period’s end. Hip circumference (HC) was measured at the most prominent part of the buttocks. The waist-hip ratio (WHR) was calculated by dividing WC (cm) by HC (cm). Participants were required to fast for 8-10 h before drawing early morning fasting venous blood. The biochemical parameters, including alanine transaminase (ALT), aspartate aminotransferase (AST), alkaline phosphatase (ALP), and gamma-glutamyl transferase (GGT), were measured using the methods recommended by the International Federation of Clinical Chemistry and Laboratory Medicine (IFCC). The study measured various biomarkers including total bilirubin (TBIL), direct bilirubin (DBIL), indirect bilirubin (IBIL), total protein (TP), albumin (ALB), globulin (GLB), HDL-c, low-density cholesterol (LDL-c), FPG, blood urea nitrogen (BUN), creatinine, uric acid (UA), estimated glomerular filtration rate (eGFR), total cholesterol (TC), and TG. In addition, HbA1c levels were measured using high-performance liquid chromatography, and routine blood tests were conducted with a fully automated hematology analyzer.
Non-invasive assessment of liver stiffness
Liver fibrosis was evaluated using the FibroScan-502 probe (Echosens, France) to non-invasively determine Liver stiffness measurement (LSM). Participants fasted for over eight hours and the test was conducted while lying flat with the right arm fully exposed to the skin of the liver region at maximum abduction. The detection area included the horizontal line of the xiphoid process, the right midaxillary line, and the line connecting the ribs’ lower edge. The M-probe was positioned vertically near the skin of the detection area in the intercostal space to ensure accurate measurement. Failure was recorded when no LSM was obtained after a minimum of 10 shots. To ensure effective LSM and controlled attenuation parameter (CAP) detection, the success rate of the procedure was required to be at least 60%, and the interquartile range (IQR)/median (IQR/M) must be no more than 30%. The final value was determined by calculating the median of ten successful detections. To assess significant liver fibrosis (stages F2-F4), LSM ≥ 8 kPa was used, while LSM < 8 kPa indicated the absence of significant liver fibrosis (stage F0-F1) [Citation16].
Liver biopsy
Liver biopsy was performed by puncture, and the liver tissues were fixed in 10% formaldehyde, dehydrated, embedded in paraffin, sectioned, and stained with hematoxylin and eosin. Two liver pathologists performed the histopathological examination. The NASH Clinical Research Network (CRN) scoring system assessed steatosis, ballooning, lobular inflammation grades, and fibrosis stage. Liver fibrosis was staged into four stages (F0-F4), and significant fibrosis was defined as ≥ 2.
Body composition analysis
Body composition was measured using the InBody770 (Biospace, Seoul, Korea). The InBody770 uses an alternating current frequency ranging from 1 kHz to 1000 kHz, which ensures high accuracy and reliability. As the frequency increases, the impedance measured by InBody also increases. The examination was conducted by the same skilled physician for all subjects. The participants refrained from consuming any food for at least eight hours and avoided wearing metallic materials. They stood barefoot in the designated position of the foot electrodes while holding the hand electrodes with their hands. The testing lasted for 60 s. The manufacturer’s algorithm generates the data output and includes measurements of total body water (TBW), body fat mass (BFM), soft lean mass (SLM), fat-free mass (FFM), skeletal muscle mass (SMM), percent body fat (PBF), basal metabolic rate (BMR), visceral fat area (VFA), fat-free mass index (FFMI), fat mass index (FMI), and skeletal muscle index (SMI).
Evaluation of liver fibrosis
The formulas used to calculate noninvasive measures of liver fibrosis are as follows: APRI: (AST [U/L]/upper limit of normal AST range [U/L])/platelet count [109/L] × 100 [Citation17]. FIB-4: (age [years] × AST [U/L])/(platelet count [109/L] × ALT [U/L] 1/2) [Citation11]. NFS: −1.675 + 0.037 × age [years] + 0.094 × BMI [kg/m2] + 1.13 × impaired fasting glucose/diabetes (yes = 1, no = 0) + 0.99 × AST [U/L]/ALT [U/L] − 0.013 × platelet count [109/L] − 0.66 × albumin [g/dL] [Citation10].
Statistical analysis
The means ± standard deviations or medians (25th/75th percentile) were used to display the continuous variables, while numbers (%) were used for the categorical ones. The analysis of continuous variables was conducted using either the Student’s t-test or the Mann − Whitney U-test for two groups, while the one-way analysis of variance or Kruskal-Wallis test was used for groups larger than two. The chi-squared test was also used to compare categorical variables within groups. We utilized univariate and multivariate logistic regression analysis to examine the relationship between independent factors and the incidence rate of significant fibrosis. This resulted in estimating the odds ratio (OR) and 95% confidence interval (CI). Only parameters that showed a significant difference (p < 0.05) based on univariate logistic regression analysis were selected for multivariate regression analysis. Nomograms were created based on the multivariate logistic regression analysis to estimate the probability of significant fibrosis. Noninvasive models and nomograms were also evaluated for their predictive values using receiver operating characteristic (ROC) curve analysis. The diagnostic accuracy was assessed by calculating the area under the receiver operator characteristic curve (AUC), as well as sensitivity and specificity. The nomogram calibrations were evaluated using a bootstrap resampling method with relocations. Predictors’ net clinical benefits were compared using decision curve analysis (DCA) curves. P values less than 0.05 were considered significant (with a two-tailed significance). Statistical analyses were conducted using SPSS version 23.0 (SPSS, IBM, Corp., Armonk, NY, USA). GraphPad Prism v.9.0 (GraphPad Software, USA) was used for figure plotting.
Result
Baseline characteristics of study participants
Between August 2018 and December 2023, a study was conducted at Changzhou Third People’s Hospital involving 11,450 participants diagnosed with fatty liver. After excluding 3,413 participants under 18 years of age, those with a history of hepatocellular carcinoma or liver surgery, acute or severe infectious diseases, previous malignant tumors, chronic kidney disease, or incomplete data, 8,037 participants remained. After excluding 336 participants who did not meet the diagnostic criteria for MAFLD, we analyzed data from 7,701 MAFLD participants. The study utilized data from 7,316 participants who did not undergo liver biopsy to develop the nomogram, referred to as the ‘training cohort.’ Additionally, data from 385 participants who underwent liver biopsy were used to validate the accuracy and reliability of the nomogram, referred to as the ‘validation cohort.’ The diagnostic criteria were used to categorize the training cohort into three groups: the OW-MAFLD group (n = 5505), the Lean-MAFLD group (n = 508), and the T2DM-MAFLD group (n = 1303). The validation cohort was also divided into three groups: the OW-MAFLD group (n = 218), the Lean-MAFLD group (n = 70), and the T2DM-MAFLD group (n = 97) (). Baseline characteristics of the 7316 participants diagnosed with MAFLD are displayed in . Out of the participants, 4641 (63.44%) were male, and 2675 (36.56%) were female, with an average age of 43.0 (32.0, 53.0) years. The clinical characteristics of the enrolled subjects, according to the MAFLD subgroup classification, showed significant differences in gender, age, weight, BMI, TBW, BFM, SLM, FFM, SMM, PBF, BMR, WHR, VFA, FFMI, FMI, SMI, LSM, CAP, WBC, RBC, HGB, PLT, ALT, AST, ALP, GGT, DBIL, TP, ALB, TC, TG, HDL-c, LDL-c, FPG, BUN, creatinine, eGFR, UA, FIB-4, and NFS (p < 0. 01). The mean LSM values in the MAFLD subgroups were 6.30, 5.60, and 6.60 kPa, respectively (p < 0.001) (). This result indicates a significant difference in liver stiffness among the different MAFLD subgroups, with the T2DM-MAFLD group having higher liver stiffness. Table S1 shows the baseline characteristics of 385 participants diagnosed with MAFLD in the validation cohort.
Figure 1. Study flowchart. T2DM: Type 2 diabetes mellitus; BMI: Body mass index; MAFLD: Metabolic-associated fatty liver disease.
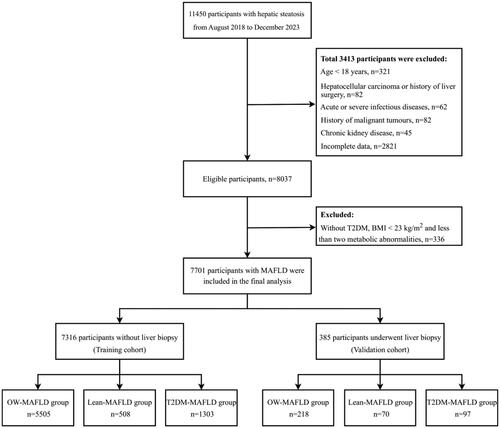
Table 1. Baseline characteristics of participants with MAFLD stratified by subtypes in the training cohort.
Baseline characteristics of participants with and without significant fibrosis
Among all patients with MAFLD, those with significant fibrosis exhibited notable differences in physiological and biochemical markers compared to those without significant fibrosis. Specifically, patients with significant fibrosis tended to be older and have higher body weight and BMI. Their body composition indices, including TBW, BFM, SLM, FFM, SMM, PBF, BMR, WHR, VFA, FFMI, FMI, and SMI were also increased. LSM and CAP were significantly higher in patients with significant fibrosis. Hematologic markers showed that patients with significant fibrosis had lower PLT, while liver enzyme markers such as ALT, AST, ALP, and GGT were elevated. Bilirubin indices, including TBIL, DBIL, and IBIL, also showed an increasing trend. TP levels increased while ALB levels were relatively decreased. Patients with significant fibrosis exhibited lower levels of HDL-c and higher levels of FPG. Additionally, they demonstrated lower levels of BUN and creatinine, indicators of renal function. It is worth mentioning that noninvasive testing indicators were significantly higher for APRI, FIB-4, and NFS (p < 0.05) (Table S2). In the OW-MAFLD group, patients with significant fibrosis tended to be older and have higher body weight and BMI. Their body composition indices, including TBW, BFM, SLM, FFM, SMM, PBF, BMR, WHR, VFA, FFMI, FMI, and SMI were also increased. LSM and CAP were significantly higher in patients with significant fibrosis. Hematologic markers showed that patients with significant fibrosis had lower PLT, while liver enzyme markers such as ALT, AST, ALP, and GGT were elevated. Bilirubin indices, including TBIL, DBIL, and IBIL, also showed an increasing trend. TP levels increased while ALB levels were relatively decreased. Patients with significant fibrosis exhibited lower levels of HDL-c and higher levels of FPG. Additionally, they demonstrated lower levels of BUN. Noninvasive testing indicators were significantly higher for APRI, FIB-4, and NFS (p < 0.05) (Table S3). In the Lean-MAFLD group, patients with significant fibrosis showed advanced age, low body weight, and decreased WHR compared to patients without significant fibrosis. Additionally, patients with significant fibrosis had increased LSM and CAP. Regarding hematological indices, patients with significant fibrosis exhibited decreased PLT and increased liver enzyme indices, such as ALT, AST, ALP, and GGT, as well as elevated levels of TBIL and DBIL. Regarding protein metabolism, patients with significant fibrosis had low levels of ALB. Furthermore, the patients presented lower levels of LDL-c and creatinine. It is worth noting that patients with significant fibrosis showed significantly elevated non-invasive test results, including the APRI, FIB-4, and NFS, which were statistically different (p < 0.05) (Table S4). In the T2DM-MAFLD group, patients with significant fibrosis had higher body weight and BMI than those without significant fibrosis. Additionally, they exhibited increased body composition indices, such as BFM, PBF, WHR, VFA, FFMI, FMI, and SMI. Regarding liver assessment, patients with significant fibrosis exhibited a notable increase in liver stiffness (LSM) and fat content (CAP). Hematological investigations revealed that patients with significant fibrosis had lower PLT and elevated liver enzymes such as ALT, AST, ALP, and GGT. DBIL and TP levels were also elevated, while FPG and BUN levels were relatively low. UA levels were found to be elevated in patients with significant fibrosis. The APRI and FIB-4 were significantly higher in patients with significant fibrosis (p < 0.05). However, there was no significant difference in NFS between the two groups of patients (p > 0.05) (Table S5).
Univariate and multivariate analysis for predicting significant fibrosis in the MAFLD overall and subgroups
Univariate and multivariate logistic regression were used to determine whether each factor was an independent risk factor for significant liver fibrosis. The study found that certain factors may be independent risk factors for significant liver fibrosis in different groups. The results indicated that AGE, BMI, PBF, VFA, PLT, AST, ALB, and BUN could potentially serve as independent risk factors for significant liver fibrosis in MAFLD overall (). In the OW-MAFLD group, these factors were AGE, BMI, PBF, VFA, PLT, AST, and BUN (Table S6). In the Lean-MAFLD group, the factors were WHR, PLT, AST, and ALB (Table S7). In the T2DM-MAFLD group, the factors were VFA, PLT, AST, TP, and FPG (Table S8).
Table 2. Results of univariate and multivariate analysis for prediction of significant fibrosis in the MAFLD overall.
Construction of new predictive model for predicting significant fibrosis
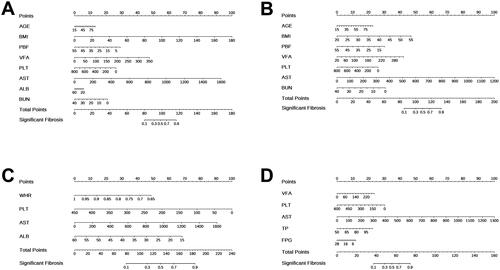
The multivariate logistic regression analysis revealed statistically significant independent predictors, creating four nomograms for quantitative analysis of significant liver fibrosis risk. In overall MAFLD, nomogram1 included eight predictors: AGE, BMI, PBF, VFA, PLT, AST, ALB, and BUN. Higher values of age, BMI, VFA, and AST and lower values of PBF, PLT, ALB, and BUN suggest an increased risk of significant fibrosis (). The nomogram2 for the OW-MAFLD group includes seven predictors: AGE, BMI, PBF, VFA, PLT, AST, and BUN. Higher values of age, BMI, VFA, and AST and lower values of PBF, PLT, and BUN suggest a higher risk of significant fibrosis (). The nomogram3 for the Lean-MAFLD group includes four predictors: WHR, PLT, AST, and ALB. Higher AST values and lower WHR, PLT, and ALB values suggest a higher risk of significant fibrosis (). The nomogram4 for the T2DM-MAFLD group included VFA, PLT, AST, TP, and FPG as the five predictors. A higher risk of significant fibrosis is suggested by higher VFA, AST, and TP values, as well as lower PLT and FPG values ().
Figure 2. Nnomograms for predicting significant fibrosis. (A) Nomogram1 was created to predict significant fibrosis in MAFLD overall; (B) Nomogram2 was created to predict significant fibrosis in OW-MAFLD; (C) Nomogram3 was created to predict significant fibrosis in Lean-MAFLD; (D) Nomogram4 was created to predict significant fibrosis in T2DM-MAFLD. Values for each variable are individually plotted and correspond to point values assigned from the point scale (top). A total score was obtained from the values of each index and plotted on the total point scale (bottom), which is used to assign a corresponding value for the predicted rate of the nomogram.
Performances of APRI, FIB-4, NFS, and nomogram in predicting significant fibrosis in the MAFLD overall and subgroups
The ROC curve was developed to evaluate the ability of APRI, FIB-4, NFS, and nomograms to predict significant liver fibrosis (). In the overall MAFLD population, nomogram1, APRI, FIB-4, and NFS demonstrated potential in diagnosing significant liver fibrosis (p < 0.001). The AUC (95% CI) of these models were 0.710 [0.698, 0.722], 0.679 [0.665, 0.693], 0.624 [0.610, 0.638], and 0.586 [0.572, 0.600], respectively. The critical values for each model were −0.831, 0.329, 1.235, and −29.189, respectively (, ). Nomogram1 had the most accurate predictive performance compared to the other three non-invasive scores, significantly outperforming them (p < 0.001) (). In the OW-MAFLD group, nomogram2, APRI, FIB-4, and NFS showed potential in diagnosing significant liver fibrosis (p < 0.001). The AUC (95% CI) for these models were 0.714 [0.700, 0.728], 0.665 [0.649, 0.681], 0.612 [0.594, 0.630], and 0.581 [0.565, 0.597], respectively. The optimal critical values for each model are −0.392, 0.315, 1.138, and −29.189, respectively (, ). Comparison between nomogram2 and the other three non-invasive scores indicated that nomogram2 had the most accurate predictive performance, significantly outperforming the other statistical scores (p < 0.001). () The Lean-MAFLD group showed potential in predicting significant liver fibrosis with nomogram3, APRI, FIB-4, and NFS (p < 0.001). The AUC (95% CI) for these models were 0.748[0.697,0.799], 0.710[0.657,0.763], 0.748[0.701,0.795], and 0.722[0.669,0.775], respectively. The optimal critical values were −1.293, 0.310, 1.298, and −28.546, respectively (, ). There was no significant difference between nomogram3 and the other three non-invasive scores in terms of AUC (p > 0.05) (). This result suggests that nomogram3 performs similarly to the other scores in predicting significant fibrosis. In the T2DM-MAFLD group, nomogram4, APRI, and FIB-4 demonstrated diagnostic potential in predicting significant liver fibrosis (p < 0.001). The models’ AUCs (95% CI) were 0.715 [0.686, 0.744], 0.724 [0.697, 0.751], and 0.620 [0.585, 0.655], respectively, with optimal critical values of 0.978, 0.342, and 1.848. The NFS did not significantly predict liver fibrosis (p > 0.05) (, ). Nomogram4 outperformed FIB-4 in prediction performance and had statistically significant advantages (p < 0.001). However, the comparison between nomogram4 and APRI showed no significant difference in prediction performance (p > 0.05) ().
Figure 3. ROC curves of APRI, FIB-4, NFS and nomograms for predicting significant fibrosis. (A) ROC curves for predicting significant fibrosis in MAFLD overall; (B) ROC curves for predicting significant fibrosis in OW-MAFLD; (C) ROC curves for predicting significant fibrosis in Lean-MAFLD; (D) ROC curves for predicting significant fibrosis in T2DM-MAFLD.
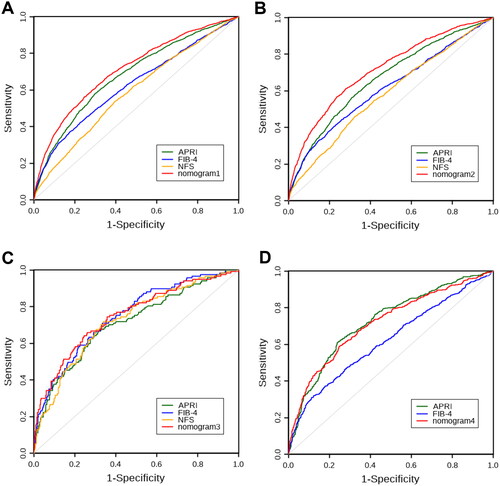
Table 3. Performance assessment of APRI, FIB-4, NFS and nomograms for the prediction of significant fibrosis in the training cohort.
Table 4. The comparation of AUCs of APRI, FIB-4, NFS and nomograms for the prediction of significant fibrosis in the training cohort.
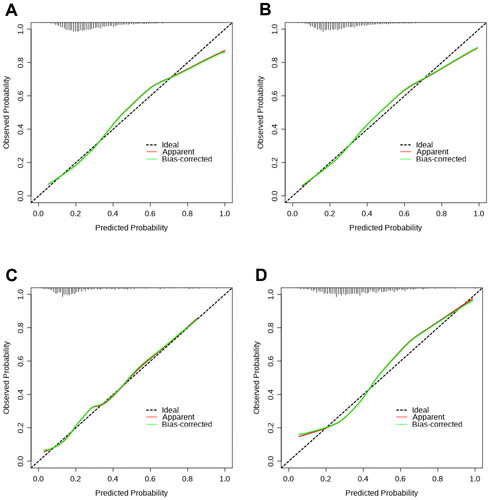
The calibration curves were utilized to compare the predicted probability of significant liver fibrosis (abscissa) with the observed probability of significant liver fibrosis after bias correction (ordinate), which was obtained from 1000 bootstrap resamplings. Calibration curves for the probability of significant liver fibrosis showed good agreement between prediction by the nomogram1 and actual observation in overall MAFLD (). Nomogram2 showed good agreement between predicted and observed probabilities of significant liver fibrosis in the OW-MAFLD group (). showed that Nomogram3 also had good agreement between predicted and observed probabilities of significant liver fibrosis in the Lean- MAFLD group. Similarly, nomogram4 showed good agreement between predicted and observed probabilities of significant liver fibrosis in the T2DM-MAFLD group ().
Figure 4. The calibration curves of nomograms (1000 bootstrap resamples) for predicting significant fibrosis. (A) The calibration curve of nomogram1 for predicting significant fibrosis in MAFLD overall; (B) The calibration curve of nomogram2 for predicting significant fibrosis in OW-MAFLD; (C) The calibration curve of nomogram3 for predicting significant fibrosis in Lean-MAFLD; (D) The calibration curve of nomogram4 for predicting significant fibrosis in T2DM-MAFLD.
Clinical utility evaluation of nomogram
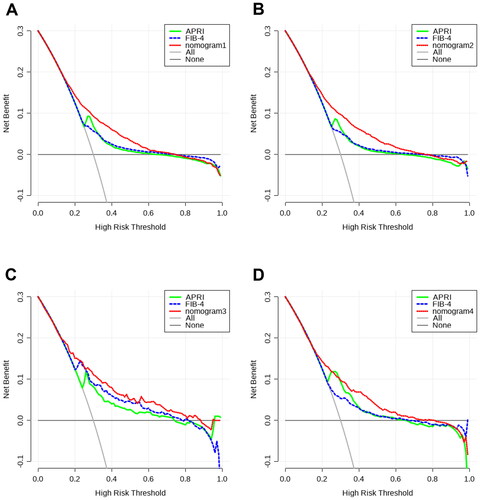
This study conducted DCA to evaluate the clinical effectiveness of nomograms and compare them with other existing models by quantifying the net benefit probability within a threshold of 0.0 to 1.0. The lines for each index indicate that clinical benefits can be achieved through the utilization of this index. Individuals can obtain a higher benefit through diagnosis if the net benefit is more significant under the same threshold probability. In summary, there exists a straightforward correlation between the decision curve and the net benefit of the model’s clinical decision. This correlation is dependent on the distance between the two extreme curves, with the model’s clinical decision being more advantageous at greater distances from these curves. DCA curves showed that patient threshold probabilities in the range of approximately 0.1-0.7 add more net benefit to the use of nomogram1 than other diagnostic models when compared to strategies that treat all patients or no patients in MAFLD overall, indicating that the model is a good assessment tool (). As shown in , nomogram2 showed a higher net benefit than the other models in the OW-MAFLD group. DCA curves showed that patient threshold probabilities in the range of approximately 0.1-0.9 add more net benefit to using nomogram3 than other diagnostic models when compared to strategies that treat all patients or no patients in the Lean-MAFLD group (). The results also showed that the nomogram4 had the highest net clinical benefits in predicting significant liver fibrosis in the T2DM-MAFLD group ().
Figure 5. DCA curves of APRI, FIB-4 and nomograms for predicting significant fibrosis. (A) DCA curves for predicting significant fibrosis in MAFLD overall; (B) DCA curves for predicting significant fibrosis in OW-MAFLD; (C) DCA curves for predicting significant fibrosis in Lean-MAFLD; (D) DCA curves for predicting significant fibrosis in T2DM-MAFLD.
Validation of the nomogram
To further verify the reliability of the nomograms, a validation cohort of 385 patients was constructed. Out of these patients, 133 (34.5%) experienced significant liver fibrosis. The ROC curve of the nomograms in the validation cohort showed an AUC (95% CI) of 0.722 [0.671, 0.773], 0.750 [0.679, 0.821], 0.719 [0.586, 0.852], and 0.705 [0.605, 0.805], respectively (, ). This result is similar to that of the training cohort.
Figure 6. ROC curves of nomograms for predicting significant fibrosis. (A) ROC curves for predicting significant fibrosis in MAFLD overall; (B) ROC curves for predicting significant fibrosis in OW-MAFLD; (C) ROC curves for predicting significant fibrosis in Lean-MAFLD; (D) ROC curves for predicting significant fibrosis in T2DM-MAFLD.
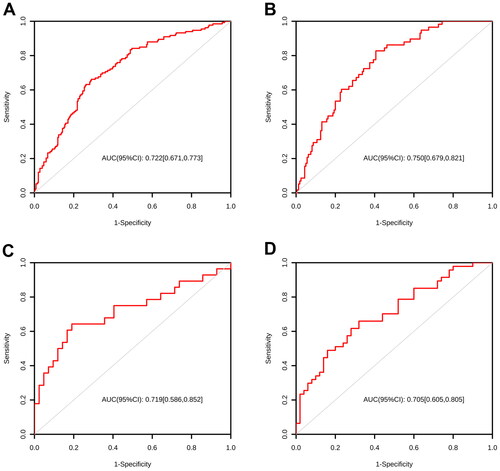
Table 5. Performance assessment of nomograms for the prediction of significant fibrosis in the validation cohort.
Discussion
This cross-sectional study analyzed data from 7701 participants with confirmed MAFLD. The study found that: (1) AGE, BMI, PBF, VFA, PLT, AST, ALB, and BUN may serve as independent risk factors for significant liver fibrosis in MAFLD patients in general. In the OW-MAFLD group, AGE, BMI, PBF, VFA, PLT, AST, and BUN may serve as independent risk factors for significant liver fibrosis. In both the Lean-MAFLD and T2DM-MAFLD groups, certain factors may serve as independent risk factors for significant liver fibrosis. Specifically, in the Lean-MAFLD group, WHR, PLT, AST, and ALB may be considered as such. In contrast, in the T2DM-MAFLD group, VFA, PLT, AST, TP, and FPG may be considered independent risk factors for significant liver fibrosis. (2) Although APRI, FIB-4, and NFS can still be used to predict fibrosis in individuals with MAFLD, their overall performance was significantly inferior to what has been previously reported in NAFLD. Additionally, there were differences in the performance of each MAFLD subgroup. (3) The new models, constructed using related predictors, demonstrated excellent diagnostic accuracy and high clinical applicability for identifying significant fibrosis in participants with MAFLD.
NAFLD affects around 25% of the global population and can lead to end-stage liver disease and hepatocellular carcinoma [Citation18, Citation19]. NAFLD comprises a group of liver disorders characterized by the excessive accumulation of liver fat. It is diagnosed after ruling out heavy drinking and other factors that contribute to chronic liver disease. Although it is the most common cause of chronic liver disease, the definition of NAFLD does not take into account the role of metabolic factors in its pathogenesis [Citation20, Citation21]. MAFLD is a more appropriate term to describe the condition of fatty liver disease associated with metabolic dysfunction. The change from NAFLD to MAFLD in name and definition is an important milestone that significantly impacts disease diagnosis and treatment [Citation22]. According to a recent meta-analysis, the global prevalence of MAFLD and NAFLD was estimated at 39% and 33%, respectively [Citation23]. Around 30% to 40% of hepatitis B patients with hepatic steatosis were previously excluded from NAFLD diagnostic criteria [Citation24, Citation25]. The revised diagnostic criteria of MAFLD now include individuals with hepatic steatosis, metabolic dysfunction, and other causes of chronic liver disease. Only about 80% of patients meet both MAFLD and NAFLD diagnostic criteria. A study found that the prevalence of MAFLD in patients with T2DM was 70%, while the prevalence of metabolic syndrome was 80% [Citation26]. Another recent study reported that 89.2% of patients with hepatic steatosis met the diagnostic criteria for MAFLD and NAFLD [Citation27]. In our study, 96.2% of participants with hepatic steatosis had MAFLD. Among the three subgroups of MAFLD, overweight/obesity MAFLD represented the most significant proportion at 75.2%, consistent with previous research [Citation28–30].
Recent data has shown a significant difference in clinical characteristics between NAFLD and MAFLD. In their analysis of data collected from the third National Health and Nutrition Examination Survey (NHANES-III) conducted from 1988 to 1994, Lin et al. [Citation31] found that patients with MAFLD were older, more frequently male, had a higher BMI, and a higher prevalence of T2DM and hypertension compared to those with NAFLD. A recent study found significant correlations between MAFLD and male gender, higher body mass index, hypertension, diabetes, hyperlipidemia, elevated transaminase, and higher fibrosis scores compared to NAFLD [Citation23]. A Korean study showed that patients diagnosed with MAFLD experienced a significantly increased degree of damage to their health-related quality of life, highlighting the impact on patients’ well-being [Citation32]. According to the study, patients with MAFLD experience significant impairment in health-related quality of life and physical activity performance compared to healthy controls, while no such impairment was observed in patients with NAFLD [Citation33].
MAFLD is a chronic illness. Patients typically experience a prolonged disease duration, which requires extended diagnosis, classification, clinical treatment, and follow-up monitoring. Studies have shown that the stage of fibrosis is the primary predictor of liver-related events, as well as an increased risk of liver-related complications and death. The mortality rate of patients with MAFLD increases as fibrosis advances [Citation7,Citation34,Citation35]. The prompt identification and precise staging of liver fibrosis are critical factors in determining prognosis, which is essential for selecting appropriate treatment methods and enhancing patient outcomes [Citation36]. It is imperative to detect significant liver fibrosis at the earliest possible stage to manage it during the reversible phase. In a cohort study of Chinese patients with NAFLD confirmed by biopsy, Yang et al. [Citation37] found that out of the 239 patients who met the MAFLD criteria, 74 (30.9%) had significant liver fibrosis. Our study yielded a comparable proportion of 29.0%. Additionally, T2DM is a pivotal risk factor for fibrosis progression in fatty liver disease [Citation38]. A recent meta-analysis reported that 20% of patients with T2DM had elevated LSM values [Citation39]. Our study found that T2DM-MAFLD participants had significantly higher LSM values and a higher prevalence of significant liver fibrosis than the other two MAFLD subgroups. It is important to note that chronic liver disease is often asymptomatic and may take several years to progress to an advanced stage. Therefore, frequent follow-up and repeated evaluation are necessary.
Liver biopsy remains the gold standard for diagnosing liver fibrosis. However, it is invasive and susceptible to sampling error, making it unsuitable for large-scale screening [Citation40]. Vibration-controlled transient elastography (VCTE) is a non-invasive method that is highly effective in assessing liver fibrosis in chronic liver diseases, including MAFLD, regardless of the underlying cause. VCTE can accurately distinguish between late and early fibrosis. The measured data are consistent with the liver biopsy results in detecting significant and severe fibrosis [Citation41, Citation42]. However, VCTE detection is susceptible to severe obesity, ascites, and the influence of bilirubin level and liver inflammatory activity [Citation43]. Magnetic resonance elastography is a highly accurate imaging modality for assessing liver fibrosis and provides a more precise classification of fibrosis compared to VCTE. However, this treatment’s high cost and limited availability severely restrict its conventional clinical application [Citation44].
The high prevalence of MAFLD necessitates a non-invasive scoring index that is suitable for large-scale screening. The index should be simple and easy to obtain for monitoring and repeated evaluation of patients’ fibrosis progression. Therefore, current research focuses on discovering a straightforward, precise, reproducible technique for detecting liver fibrosis in MAFLD patients. The current non-invasive fibrosis indicators, such as APRI, FIB-4, and NFS, are based on simple laboratory parameters that are easy to obtain in regular clinical settings and are cost-effective. However, their ability to diagnose liver fibrosis in the early stages remains controversial [Citation44] despite their high diagnostic accuracy for advanced fibrosis. Our study found that APRI, FIB-4, and NFS still have a certain predictive role in participants with MAFLD. The AUC values (95% CI) for APRI, FIB-4, and NFS were 0.679 [0.665,0.693], 0.624 [0.610,0.638], and 0.586 [0.572,0.600], respectively. However, the overall performance of these scores was noticeably inferior to previously reported results in NAFLD [Citation44–46]. Additionally, the predictive performance of these scores varied significantly across different subgroups of MAFLD. In the Lean-MAFLD group, APRI, FIB-4, and NFS had superior predictive performance, with respective AUC (95% CI) values of 0.710 [0.657,0.763], 0.748 [0.701,0.795], and 0.722 [0.669,0.775]. However, the predictive performance in the OW-MAFLD group was lower than expected, with AUC (95% CI) values of 0.665 [0.649,0.681], 0.612 [0.594,0.630], and 0.581 [0.565,0.597], respectively. Additionally, NFS was not found to be predictive in the T2DM-MAFLD group. The reasons for these results are multifaceted. Firstly, the primary clinical purpose of these scoring systems is to eliminate advanced fibrosis rather than identify it, and their efficiency in determining significant fibrosis is limited [Citation47]. Secondly, these results could potentially be influenced by the patient’s BMI value. Previous studies have demonstrated that these scoring systems have poor performance in obese patients [Citation48]. The BMI level of patients with MAFLD was higher than that of patients with NAFLD. Additionally, age can significantly impact the accuracy of their diagnosis [Citation49]. The study confirmed that patients with MAFLD had an older average age than patients with NAFLD. Moreover, MAFLD includes patients with viral hepatitis and autoimmune liver disease. The results could also be attributed to the abnormal transaminase levels in these patients and the inclusion of more patients with T2DM. Therefore, it is imperative to further develop and validate a novel scoring system for fibrosis in the MAFLD population.
The diagnosis of MAFLD is often incidentally discovered by clinicians during the examination of other diseases or annual physicals, due to the absence of distinct clinical symptoms. Demographic factors such as gender and age, anthropometric measurements such as WC, BMI, PBF, and VFA, as well as laboratory tests including PLT, AST, ALB, and BUN, can be easily monitored during routine physical examinations and follow-up visits at medical centers of all levels. These factors are preferred over liver biopsy or imaging examinations. Therefore, developing a straightforward and practical fibrosis assessment tool based on readily available indicators is crucial. This study utilized a substantial sample and standardized demographic, anthropometric, and laboratory testing techniques. To enhance the practicality of the new nomogram in clinical settings, we restricted the candidate variables to clinical and laboratory indicators that are readily available when constructing a model to predict significant liver fibrosis.
The multivariate logistic regression analysis revealed statistically significant independent predictors, and four nomograms were created for the quantitative analysis of significant liver fibrosis risk. The nomogram for the overall MAFLD included AGE, BMI, PBF, VFA, PLT, AST, ALB, and BUN. The nomogram for the OW-MAFLD group was based on seven predictors: AGE, BMI, PBF, VFA, PLT, AST, and BUN. The nomogram for the Lean-MAFLD group was based on four predictors: WHR, PLT, AST, and ALB. The nomogram for the T2DM-MAFLD group was based on five predictors: VFA, PLT, AST, TP, and FPG. We systematically evaluated each model in this study using the AUC, calibration curve, and DCA to validate their precision and consistency. The study found that the model’s AUC (95% CI) was 0.710 [0.698,0.722] for overall MAFLD, 0.714 [0.700,0.728] for OW-MAFLD, 0.748 [0.697,0.799] for Lean-MAFLD, and 0.715 [0.686,0.744] for T2DM-MAFLD. The optimal critical values were also −0.831, −0.392, −1.293, and 0.978, respectively. The study used AUC and DCA curves to compare new models with APRI, FIB-4, and NFS. The results showed that the nomogram had a higher AUC in all MAFLD participants and the OW-MAFLD group than the other three non-invasive scores. In the Lean-MAFLD group, the AUC of the nomogram was not significantly different from that of the other three non-invasive scores. However, in the T2DM-MAFLD group, the nomogram had a higher AUC than FIB-4, while being comparable to APRI. The DCA curve showed that the net benefit of each nomogram was higher than that of APRI and FIB-4. In summary, these new models outperformed the three other existing scoring systems in various aspects, indicating their superior overall predictive effect.
Currently, many clinical guidelines recommend using non-invasive scoring systems to predict and screen liver fibrosis, along with frequent follow-ups and early interventions for patients with NASH and/or liver fibrosis [Citation1, Citation50, Citation51]. The nomogram developed in this study has the potential to serve as a large-scale screening tool for significant liver fibrosis in patients with MAFLD. This new method enables clinical staff to quickly and accurately identify patients with MAFLD who may be at risk of significant liver fibrosis. Based on the risk assessment, clinicians can create customized treatment plans for patients. For individuals at high risk, additional examinations, such as imaging or a liver biopsy, should be conducted for more precise risk assessment and prognosis.
It is essential to note the strengths of this study. Firstly, the researchers used a large sample of 7701 participants to ensure the reliability of the results. Secondly, they restricted the variables to simple and readily available indicators during the development of a model for predicting significant liver fibrosis in MAFLD participants, aiming to enhance the clinical applicability of the nomogram in this particular study. Thirdly, this study developed a general prediction model for MAFLD and specific prediction models for different subgroups of MAFLD, enhancing the relevance and practicality of clinical application.
Limitations
There are limitations to our research. Firstly, as this was a cross-sectional study, it was not possible to investigate causality or long-term outcomes. Nonetheless, it provides insights for further analysis or experimental research. Secondly, since this study was conducted in a single center and all participants had similar characteristics, further research is necessary to confirm these findings and validate our proposed model with a larger sample size from other populations. Additionally, ultrasound is the most frequently employed diagnostic method for assessing liver steatosis. It has been demonstrated to be reliable and accurate in identifying moderate to severe degrees of liver steatosis [Citation52, Citation53]. However, the diagnostic accuracy for mild hepatic steatosis is low [Citation54, Citation55]. In our study, participants with mild hepatic steatosis may have made exclusion errors, which could have led to an overestimation of the degree of fibrosis in the MAFLD population. Additionally, the study participants in the training cohort did not undergo a liver biopsy. Due to the large sample size of this study, it was not feasible to conduct liver punctures on all participants. The use of the LSM obtained by TE for the diagnosis and classification of liver fibrosis was relatively appropriate. Finally, the new scoring system requires further validation. Our model needs external validation from other sources to establish its universality and applicability.
Conclusions
To summarize, we have developed four new nomograms with a relatively high accuracy level. These nomograms can help clinicians evaluate the risk of significant fibrosis in patients with MAFLD. By assessing individual risks, clinicians and patients can implement necessary lifestyle monitoring and medical intervention measures in the early stages, thereby preventing the progression to advanced fibrosis.
Ethics approval
The research adhered to the principles of the Declaration of Helsinki and received approval from the Ethics Committee of Changzhou Third People’s Hospital (No. 02 A-A20230023). Informed consent was not required owing to the retrospective nature of the study.
Authors contributions
Conceptualization and methodology: FZ, WL and LL; project administration, data curation, and resources: FZ and YH; investigation: FZ, YH, GZ and YM; formal analysis: FZ and WL; supervision: WL and LL; Writing - original draft: FZ and YH; Writing - review and editing: WL; funding acquisition: FZ and GZ; All authors have read and agreed to the published version of the manuscript. All authors have made substantial contributions to the work and agree to be accountable for all aspects.
Supplemental Material
Download MS Word (74.5 KB)Acknowledgments
The authors thank all the study participants for their assistance.
Disclosure statement
No potential conflict of interest was reported by the author(s).
Data availability statement
The data utilized and analyzed in the present study are accessible from the corresponding author upon justified request.
Additional information
Funding
References
- Chalasani N, Younossi Z, Lavine JE, et al. The diagnosis and management of nonalcoholic fatty liver disease: practice guidance from the American association for the study of liver diseases. Hepatology. 2018;67(1):1–19. doi: 10.1002/hep.29367.
- Eslam M, Newsome PN, Sarin SK, et al. A new definition for metabolic dysfunction-associated fatty liver disease: an international expert consensus statement. J Hepatol. 2020;73(1):202–209. doi: 10.1016/j.jhep.2020.03.039.
- Chan KE, Koh TJL, Tang ASP, et al. Global prevalence and clinical characteristics of metabolic-associated fatty liver disease: a meta-analysis and systematic review of 10 739 607 individuals. J Clin Endocrinol Metab. 2022;107(9):2691–2700. doi: 10.1210/clinem/dgac321.
- Ginès P, Krag A, Abraldes JG, et al. Liver cirrhosis. Lancet. 2021;398(10308):1359–1376. doi: 10.1016/S0140-6736(21)01374-X.
- Angulo P, Kleiner DE, Dam-Larsen S, et al. Liver fibrosis, but no other histologic features, is associated with long-term outcomes of patients with nonalcoholic fatty liver disease. Gastroenterology. 2015;149(2):389–397 e10. doi: 10.1053/j.gastro.2015.04.043.
- Hagström H, Nasr P, Ekstedt M, et al. Fibrosis stage but not NASH predicts mortality and time to development of severe liver disease in biopsy-proven NAFLD. J Hepatol. 2017;67(6):1265–1273. doi: 10.1016/j.jhep.2017.07.027.
- Vilar-Gomez E, Calzadilla-Bertot L, Wai-Sun Wong V, et al. Fibrosis severity as a determinant of cause-specific mortality in patients with advanced nonalcoholic fatty liver disease: a multi-national cohort study. Gastroenterology. 2018;155(2):443–457 e17. doi: 10.1053/j.gastro.2018.04.034.
- Ratziu V, Charlotte F, Heurtier A, et al. Sampling variability of liver biopsy in nonalcoholic fatty liver disease. Gastroenterology. 2005;128(7):1898–1906. doi: 10.1053/j.gastro.2005.03.084.
- European Association for Study of Liver, Asociacion Latinoamericana Para el estudio del H. EASL-ALEH clinical practice guidelines: non-invasive tests for evaluation of liver disease severity and prognosis. J Hepatol. 2015;63(1):237–264.
- Angulo P, Hui JM, Marchesini G, et al. The NAFLD fibrosis score: a noninvasive system that identifies liver fibrosis in patients with NAFLD. Hepatology. 2007;45(4):846–854. doi: 10.1002/hep.21496.
- Shah AG, Lydecker A, Murray K, et al. Comparison of noninvasive markers of fibrosis in patients with nonalcoholic fatty liver disease. Clin Gastroenterol Hepatol. 2009;7(10):1104–1112. doi: 10.1016/j.cgh.2009.05.033.
- Harrison SA, Oliver D, Arnold HL, et al. Development and validation of a simple NAFLD clinical scoring system for identifying patients without advanced disease. Gut. 2008;57(10):1441–1447. doi: 10.1136/gut.2007.146019.
- Kolhe KM, Amarapurkar A, Parikh P, et al. Aspartate transaminase to platelet ratio index (APRI) but not FIB-5 or FIB-4 is accurate in ruling out significant fibrosis in patients with non-alcoholic fatty liver disease (NAFLD) in an urban slum-dwelling population. BMJ Open Gastroenterol. 2019;6(1):e000288. doi: 10.1136/bmjgast-2019-000288.
- Petta S, Eslam M, Valenti L, et al. Metabolic syndrome and severity of fibrosis in nonalcoholic fatty liver disease: an age-dependent risk profiling study. Liver Int. 2017;37(9):1389–1396. doi: 10.1111/liv.13397.
- Wu J, Lu AD, Zhang LP, et al. [Study of clinical outcome and prognosis in pediatric core binding factor-acute myeloid leukemia]. Zhonghua Xue Ye Xue Za Zhi. 2019;40(1):52–57.
- Koehler EM, Plompen EP, Schouten JN, et al. Presence of diabetes mellitus and steatosis is associated with liver stiffness in a general population: the rotterdam study. Hepatology. 2016;63(1):138–147. doi: 10.1002/hep.27981.
- Wai CT, Greenson JK, Fontana RJ, et al. A simple noninvasive index can predict both significant fibrosis and cirrhosis in patients with chronic hepatitis C. Hepatology. 2003;38(2):518–526. doi: 10.1053/jhep.2003.50346.
- Younossi ZM, Koenig AB, Abdelatif D, et al. Global epidemiology of nonalcoholic fatty liver disease-meta-analytic assessment of prevalence, incidence, and outcomes. Hepatology. 2016;64(1):73–84. doi: 10.1002/hep.28431.
- Paik JM, Golabi P, Younossi Y, et al. Changes in the global burden of chronic liver diseases from 2012 to 2017: the growing impact of NAFLD. Hepatology. 2020;72(5):1605–1616. doi: 10.1002/hep.31173.
- Yilmaz Y, Byrne CD, Musso G. A single-letter change in an acronym: signals, reasons, promises, challenges, and steps ahead for moving from NAFLD to MAFLD. Expert Rev Gastroenterol Hepatol. 2021;15(4):345–352. doi: 10.1080/17474124.2021.1860019.
- Demirtas CO, Yilmaz Y. Metabolic-associated fatty liver disease: time to integrate ground-breaking new terminology to our clinical practice? Hepatol Forum. 2020;1(3):79–81. doi: 10.14744/hf.2020.2020.0024.
- Alharthi J, Gastaldelli A, Cua IH, et al. Metabolic dysfunction-associated fatty liver disease: a year in review. Curr Opin Gastroenterol. 2022;38(3):251–260. doi: 10.1097/MOG.0000000000000823.
- Lim GEH, Tang A, Ng CH, et al. An observational data meta-analysis on the differences in prevalence and risk factors between MAFLD vs NAFLD. Clin Gastroenterol Hepatol. 2023;21(3):619–629 e7. doi: 10.1016/j.cgh.2021.11.038.
- Nguyen VH, Le MH, Cheung RC, et al. Differential clinical characteristics and mortality outcomes in persons with NAFLD and/or MAFLD. Clin Gastroenterol Hepatol. 2021;19(10):2172–2181 e6. doi: 10.1016/j.cgh.2021.05.029.
- Zheng Q, Zou B, Wu Y, et al. Systematic review with meta-analysis: prevalence of hepatic steatosis, fibrosis and associated factors in chronic hepatitis B. Aliment Pharmacol Ther. 2021;54(9):1100–1109. doi: 10.1111/apt.16595.
- Xing Y, Chen J, Liu J, et al. Associations between GGT/HDL and MAFLD: a cross-sectional study. Diabetes Metab Syndr Obes. 2022;15:383–394. doi: 10.2147/DMSO.S342505.
- Wong VW, Wong GL, Woo J, et al. Impact of the new definition of metabolic associated fatty liver disease on the epidemiology of the disease. Clin Gastroenterol Hepatol. 2021;19(10):2161–2171 e5. doi: 10.1016/j.cgh.2020.10.046.
- Sohn W, Kwon HJ, Chang Y, et al. Liver fibrosis in asians with metabolic dysfunction-associated fatty liver disease. Clin Gastroenterol Hepatol. 2022;20(5):e1135–e1148. doi: 10.1016/j.cgh.2021.06.042.
- Kim M, Yoon EL, Cho S, et al. Prevalence of advanced hepatic fibrosis and comorbidity in metabolic dysfunction-associated fatty liver disease in korea. Liver Int. 2022;42(7):1536–1544. doi: 10.1111/liv.15259.
- Yuan Q, Wang H, Gao P, et al. Prevalence and risk factors of metabolic-associated fatty liver disease among 73,566 individuals in beijing, China. Int J Environ Res Public Health. 2022;19(4):2096. doi: 10.3390/ijerph19042096.
- Lin S, Huang J, Wang M, et al. Comparison of MAFLD and NAFLD diagnostic criteria in real world. Liver Int. 2020;40(9):2082–2089. doi: 10.1111/liv.14548.
- Hwang TI, Han AL. Quality of life in adults with metabolic dysfunction-associated fatty liver disease. Int J Environ Res Public Health. 2021;18(24):13145. doi: 10.3390/ijerph182413145.
- Attia D, Aty NA, Shawket A, et al. MAFLD not NAFLD is associated with impairment of health-related quality of life. J Clin Transl Hepatol. 2022;10(1):4–5. doi: 10.14218/JCTH.2021.00485.
- Taylor RS, Taylor RJ, Bayliss S, et al. Association between fibrosis stage and outcomes of patients with nonalcoholic fatty liver disease: a systematic review and meta-analysis. Gastroenterology. 2020;158(6):1611–1625 e12. doi: 10.1053/j.gastro.2020.01.043.
- Dulai PS, Singh S, Patel J, et al. Increased risk of mortality by fibrosis stage in nonalcoholic fatty liver disease: systematic review and meta-analysis. Hepatology. 2017;65(5):1557–1565. doi: 10.1002/hep.29085.
- Sanyal AJ, Van Natta ML, Clark J, et al. Prospective study of outcomes in adults with nonalcoholic fatty liver disease. N Engl J Med. 2021;385(17):1559–1569. doi: 10.1056/NEJMoa2029349.
- Yang RX, Zou ZS, Zhong BH, et al. The pathologic relevance of metabolic criteria in patients with biopsy-proven nonalcoholic fatty liver disease and metabolic dysfunction associated fatty liver disease: a multicenter cross-sectional study in China. Hepatobiliary Pancreat Dis Int. 2021;20(5):426–432. doi: 10.1016/j.hbpd.2021.06.002.
- Lee CH, Lui DT, Lam KS. Non-alcoholic fatty liver disease and type 2 diabetes: an update. J Diabetes Investig. 2022;13(6):930–940. doi: 10.1111/jdi.13756.
- Ciardullo S, Perseghin G. Prevalence of elevated liver stiffness in patients with type 1 and type 2 diabetes: a systematic review and meta-analysis. Diabetes Res Clin Pract. 2022;190:109981. doi: 10.1016/j.diabres.2022.109981.
- Sumida Y, Nakajima A, Itoh Y. Limitations of liver biopsy and non-invasive diagnostic tests for the diagnosis of nonalcoholic fatty liver disease/nonalcoholic steatohepatitis. World J Gastroenterol. 2014;20(2):475–485. doi: 10.3748/wjg.v20.i2.475.
- Siddiqui MS, Vuppalanchi R, Van Natta ML, et al. Vibration-Controlled transient elastography to assess fibrosis and steatosis in patients with nonalcoholic fatty liver disease. Clin Gastroenterol Hepatol. 2019;17(1):156–163 e2. doi: 10.1016/j.cgh.2018.04.043.
- Aykut UE, Akyuz U, Yesil A, et al. A comparison of FibroMeter NAFLD score, NAFLD fibrosis score, and transient elastography as noninvasive diagnostic tools for hepatic fibrosis in patients with biopsy-proven non-alcoholic fatty liver disease. Scand J Gastroenterol. 2014;49(11):1343–1348. doi: 10.3109/00365521.2014.958099.
- Wong VW, Irles M, Wong GL, et al. Unified interpretation of liver stiffness measurement by M and XL probes in non-alcoholic fatty liver disease. Gut. 2019;68(11):2057–2064. doi: 10.1136/gutjnl-2018-317334.
- Xiao G, Zhu S, Xiao X, et al. Comparison of laboratory tests, ultrasound, or magnetic resonance elastography to detect fibrosis in patients with nonalcoholic fatty liver disease: a meta-analysis. Hepatology. 2017;66(5):1486–1501. doi: 10.1002/hep.29302.
- Mózes FE, Lee JA, Selvaraj EA, et al. Diagnostic accuracy of non-invasive tests for advanced fibrosis in patients with NAFLD: an individual patient data meta-analysis. Gut. 2022;71(5):1006–1019. doi: 10.1136/gutjnl-2021-324243.
- Ismaiel A, Leucuta DC, Popa SL, et al. Noninvasive biomarkers in predicting nonalcoholic steatohepatitis and assessing liver fibrosis: systematic review and meta-analysis. Panminerva Med. 2021;63(4):508–518. doi: 10.23736/S0031-0808.20.04171-3.
- Kaya E, Bakir A, Kani HT, et al. Simple noninvasive scores are clinically useful to exclude, not predict, advanced fibrosis: a study in Turkish patients with biopsy-proven nonalcoholic fatty liver disease. Gut Liver. 2020;14(4):486–491. doi: 10.5009/gnl19173.
- Eren F, Kaya E, Yilmaz Y. Accuracy of fibrosis-4 index and non-alcoholic fatty liver disease fibrosis scores in metabolic (dysfunction) associated fatty liver disease according to body mass index: failure in the prediction of advanced fibrosis in lean and morbidly obese individuals. Eur J Gastroenterol Hepatol. 2022;34(1):98–103. doi: 10.1097/MEG.0000000000001946.
- McPherson S, Hardy T, Dufour JF, et al. Age as a confounding factor for the accurate non-invasive diagnosis of advanced NAFLD fibrosis. Am J Gastroenterol. 2017;112(5):740–751. doi: 10.1038/ajg.2016.453.
- Eslam M, Sarin SK, Wong VW, et al. The asian pacific association for the study of the liver clinical practice guidelines for the diagnosis and management of metabolic associated fatty liver disease. Hepatol Int. 2020;14(6):889–919. doi: 10.1007/s12072-020-10094-2.
- European Association for the Study of the L, European Association for the Study of D, European Association for the Study of O . EASL-EASD-EASO clinical practice guidelines for the management of non-alcoholic fatty liver disease. Obes Facts. 2016;9(2):65–90.
- Hernaez R, Lazo M, Bonekamp S, et al. Diagnostic accuracy and reliability of ultrasonography for the detection of fatty liver: a meta-analysis. Hepatology. 2011;54(3):1082–1090. doi: 10.1002/hep.24452.
- Salmi A, di Filippo L, Ferrari C, et al. Ultrasound and FibroScan((R)) controlled attenuation parameter in patients with MAFLD: head to head comparison in assessing liver steatosis. Endocrine. 2022;78(2):262–269. doi: 10.1007/s12020-022-03157-x.
- Saadeh S, Younossi ZM, Remer EM, et al. The utility of radiological imaging in nonalcoholic fatty liver disease. Gastroenterology. 2002;123(3):745–750. doi: 10.1053/gast.2002.35354.
- Schwenzer NF, Springer F, Schraml C, et al. Non-invasive assessment and quantification of liver steatosis by ultrasound, computed tomography and magnetic resonance. J Hepatol. 2009;51(3):433–445. doi: 10.1016/j.jhep.2009.05.023.