
Abstract
Background
Abdominal aortic aneurysm (AAA) is highly lethal upon onset of acute aortic diseases (AAD) or rupture. Dyslipidaemia and hyperuricaemia are important risk factors for the development of AAA and AAD as well as aortic disease-related death. The aim of this study was to explore whether uric acid (UA) to high-density lipoprotein cholesterol (HDL-C) ratio (UHR) can be used as an independent predictor of the presence of AAA or AAD.
Methods
Three hundred subjects, including 100 AAA patients (AAA group), 100 AAD patients (AAD group) and 100 controls (CON group), were recruited in this study. UHR and other serum samples were obtained upon the patients’ admission before any medical treatment. The optimal cut-off points of UHR were determined using receiver operating characteristic (ROC) curve analysis.
Results
The UHR in AAA group was significantly higher than that in CON group, but there was no significant difference between AAD group and CON group. The optimal cut-off point of UHR for AAA was 7.78 (sensitivity 84.7%, specificity 62.4%, and AUC 0.811; p < 0.001), and UHR (OR: 1.122, 95%CI: 1.064-1.184; p < 0.001) was found to be an independent factor for predicting AAA after adjusting for traditional AAA risk factor.
Conclusion
UHR can be widely used in clinical practice as an auxiliary tool for screening AAA. The optimal cut-off point for UHR to AAA was determined for the first time in Chinese subjects.
1. Introduction
Abdominal aortic aneurysm (AAA) is a multifactorial cardiovascular disease that is highly lethal upon onset of acute aortic rupture (AAD) [Citation1]. The prevalence of AAA and AAD in China have shown a clear upward trend [Citation2]. Unhealthy dietary patterns are associated with the development of AAA and AAD [Citation3,Citation4]. While imaging plays a crucial role in diagnosing AAA and AAD, there is also evidence suggesting that biochemical markers contribute to their differential diagnosis.
Dyslipidaemia is an important risk factor for the development of AAA and AAD. It was reported that the growth rate of AAA was positively associated with levels of total cholesterol (TC) and apolipoprotein B, and negatively associated with level of high-density lipoprotein cholesterol (HDL-C) [Citation5,Citation6]. Moreover, research has shown a strong association between low level of HDL-C and increased in-hospital mortality in patients with AAD [Citation7]. In addition, the diagnostic value of derivations of lipids, such as monocyte to high-density lipoprotein ratio (MHR), in AAD has been reported in a retrospective study with 128 AAD patients and 110 healthy controls [Citation8]. However, the specific impact of lipids and their derivations on differentiating between AAA and AAD remains uncertain.
In addition, hyperuricaemia has become an increasing public health problem associated with gout arthritis as well as cardiovascular risk and mortality [Citation9,Citation10]. A 3.8-year nationwide community-based cohort study in Japan showed that hyperuricemia was a vital risk for aortic disease-related death. Kaplan-Meier analysis revealed that subjects with hyperuricemia had a higher rate of AAD-related death than those without hyperuricemia [Citation9]. Furthermore, a meta-analysis involving 2390 subjects provided evidence that serum uric acid (UA) levels were significantly higher among patients with AAD than those in controls [Citation11]. Similarly, a population-based cohort study found that compared to the controls, patients with gout exhibited a significantly increased incidence of AAA development [Citation12]. The murine experimental evidence also suggested that hyperuricemia could exacerbate AAA formation through reactive oxygen species (ROS)/matrix metalloproteinase-9 signalling pathway [Citation13]. Until now, the difference in UA level between AAA and AAD patient remained unclear.
Recently, UA to HDL-C ratio (UHR) has been taken as a novel predictor for metabolic syndrome, non-alcoholic fatty liver disease, Hashimoto’s thyroiditis, and the presence of coronary collateral circulation [Citation14–19]. In a cohort study, peritoneal dialysis patients with higher UHR had a significantly increased risk of cardiovascular mortality, including the mortality of AAA and AAD [Citation20]. However, studies on the diagnostic value of UHR in AAA and AAD are extremely rare. Therefore, we aimed to explore whether UHR can be used as an independent predictor of the presence of AAA or AAD.
2. Methods
2.1. Study subjects
This study initially included 318 subjects in the Department of Cardiovascular Medicine and Cardiovascular Surgery of the Second Xiangya Hospital, Central South University between April 2017 and December 2019. Patients with Marfan syndrome, thyroid diseases, malignancies, active inflammatory disorders, acute myocardial infarction or stroke, renal or hepatic failure or other connective tissue disorders were excluded from the study. Patients who undergo anti-inflammation therapy were also excluded. AAA and AAD were diagnosed by chest radiography, transoesophageal echocardiography, computed tomography scans or surgery. AAA was defined as segmental, full-thickness dilation of the aorta resulting in a > 50% increase in diameter compared with the normal aortic diameter [Citation21]. AAD was defined as the separation of aortic lumen from the intima, forming the true and false two lumen separation state of the aorta wall [Citation22]. Contemporaneous controls had no clinical history and manifestation of AAA or AAD, and they all undergone imaging examinations to confirm the absence of AAA and AAD. Of the initial 318 patients, 18 were excluded due to the lack of complete data on any variables required for the study. Ultimately 300 patients entered our analysis, 100 in each group. The study was approved by the Ethics Committee of the Second Xiangya Hospital of Central South University (LYF20230227) and informed written consent was gained from all participants.
2.2. Data collection
All subjects were invited to filled out a questionnaire on baseline data, sex, age, height, weight, current smoking status, medical history and use of medication before participant. A current smoker was defined by smoking at least 20 cigarettes a day for at least the past five years. The diagnosis of hypertension, diabetes and coronary heart disease were described in our previous studies [Citation8,Citation23].
2.3. Laboratory assays
Blood samples were obtained upon the patients’ admission in our hospital before any medical treatment and centrifuged at 4 °C 3000 rpm for 15 min. The lipid profile was measured as described before [Citation23]. All blood samples were measured by a laboratory technician blinded to the study.
2.4. Statistical analysis
Quantitative variables were expressed as mean ± standard error of mean (SEM) unless were specifically explained, and qualitative variables were expressed as numbers and percentages. Skewed distribution data were analysed after logarithmic transformation. Differences between groups were analysed by unpaired t-test or one-way analysis of variance. Categorical variables were compared using chi-squared test. Body mass index (BMI) was calculated as mean weight divided by mean height squared (kg/m2). The UHR was calculated as serum UA level (mg/dL) divided by HDL-C concentration(mg/dL) using the same blood samples drawn on admission. The optimal cut-off points of UHR were determined using receiver operating characteristic (ROC) curve analysis. All statistical analyses were performed with SPSS version 25.0. All P values were 2-tailed, and p < 0.05 was considered statistically significant.
3. Results
3.1. Baseline characteristics of the study population
There were more male subjects in AAA and AAD groups than CON group. The age and the percentage of subjects with smoking in AAA group were significantly higher than those in AAD and CON groups (p < 0.001). There was no significant difference in BMI, history of diabetes or coronary heart disease among three groups. Systolic blood pressure and the percentage of subjects with hypertension in AAD group were significantly higher than those in CON and AAA groups. Diastole blood pressure in AAD group was significantly higher only than that in AAA group but not CON group. The percentage of subjects with lipid-lowing therapy was higher and low density lipoprotein cholesterol level was lower significantly in AAD group than those in AAA and CON groups. AAA group had significantly higher TG and lower HDL-C levels than the AAD and CON groups, although there was no significant difference in TC level among three groups. The level of UA in AAA group was significantly higher than those in CON and AAD groups ().
Table 1. Baseline characteristics of the study population.
3.2. Distibution of UHR in different groups
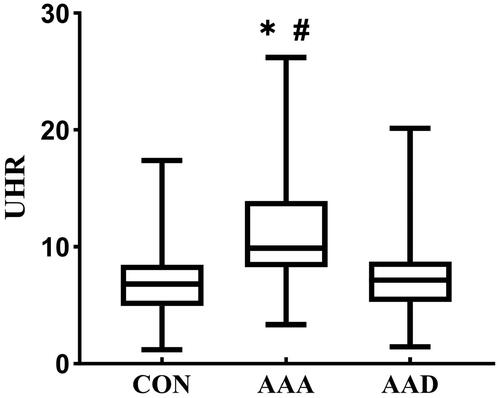
The UHR in AAA group (9.89, 8.26 − 13.9) was significantly higher than that in CON group (6.82, 4.93 − 8.46, p < 0.05) or in AAD group (7.13, 5.28 − 8.73, p < 0.05). There was no significant difference in UHR between AAD group and CON group ().
Figure 1. Distribution of UHR in different groups. Data were presented as median (min -max). CON: control group; AAA: abdominal aortic aneurysms; AAD: acute aortic dissection; UHR: uric acid to high-density lipoprotein cholesterol ratio. * p < 0.05 versus CON; # p < 0.05 versus AAD.
3.3. Determination of the UHR cut-off point for AAA
To determine the optimal cut-off point of UHR to distinguish AAA patients from control subjects or/and AAD patients, ROC analysis was performed and Youden’s index was calculated.
Among the subjects in CON and AAA groups, the optimal cut-off point of UHR for AAA was 7.78 (sensitivity 84.7%, specificity 62.4%, AUC 0.811 and Youden’s index 0.541; p < 0.001). To determine whether UHR has an advantage over UA and HDL-C, ROC analysis was also performed for UA and HDL-C. The AUC and Youden’s index of UA (AUC 0.748 and Youden’s index 0.411) were smaller than those of UHR. HDL-C, as a protective factor, got an AUC less than 0.5. And the Youden’s index of HDL-C was 0.353, which was smaller than those of UHR and UA ().
Figure 2. Diagnosis value of UHR to distinguish abdominal aortic aneurysm patients. (A-B) ROC analysis of HDL-C, UA and UHR to distinguish abdominal aortic aneurysm patients from healthy controls(A) and acute aortic dissection patients(B); (C) The percentage of subjects with low (L-UHR) and high (H-UHR) level of UHR according to the cut-off point determined by ROC analysis in three groups; (D) The proportion distribution of the three groups in patients with low and high UHR. CON: control group; AAA: abdominal aortic aneurysms; AAD: acute aortic dissection; AUC: area under the curve.
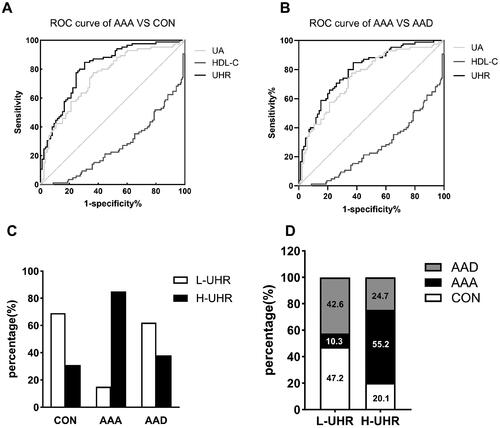
The optimal cut-off point of UHR to distinguish AAA patients from AAD patients was 7.77 when AAA and AAD subjects were analyzed together (sensitivity 84.7%, specificity 69.4%, AUC 0.792 and Youden’s index 0.471; p < 0.001). While the AUC and Youden’s index of UA (AUC 0.682 and Youden’s index 0.471) and HDL-C (AUC 0.263 and Youden’s index 0.377) were smaller than those of UHR ().
3.4. Comparisons of the distribution of UHR according to the cut-off points determined by ROC curve analysis among three groups
To determine the validity of the cut-off point obtained by the ROC curve analysis, we further analysed the distribution of UHR in three groups. According to the cut-off point, 7.78, the percentage of low level of UHR (L-UHR) in CON and AAD group were much higher than those of high level of UHR (H-UHR), while the percentage of H-UHR in AAA group was much higher than L-UHR (). We also compared the proportion distribution of the three disease states in patients with L-UHR or H-UHR. There were almost 90% subjects from CON or AAD group in subjects with L-UHR. While more than half of the subjects with H-UHR were from the AAA group ().
3.5. Univariate and multivariate logistic regression analysis
To investigate whether UHR was useful as a predictor of AAA, univariate and multivariate logistic regression analysis for the factors related to AAA were conducted in 300 subjects. Univariate logistic regression analysis showed that being male[odds ratio (OR): 3.683, 95% confidence intervals (CI): 1.913–7.09; p < 0.001), smoking(OR: 2.139, 95%CI: 1.201–3.809; p = 0.01), lipid-lowing therapy (OR: 0.219, 95% CI: 0.07–0.68; p = 0.009), HDL-C level (OR: 0.945, 95%CI: 0.921–0.970; p < 0.001), serum UA level (OR: 1.262, 95%CI: 1.109–1.436; p < 0.001) and UHR (OR:1.107, 95%CI: 1.063–1.153; p < 0.001) were significantly associated with the presence of AAA. Subsequent multivariate regression analysis revealed that except for HDL-C and serum UA levels, only UHR (OR: 1.122, 95%CI: 1.064–1.184; p < 0.001) was found to be an independent factor for predicting AAA after adjusting for traditional AAA risk factor, such as age, smoking and lipid-lowing therapy ().
Table 2. Regression analysis.
4. Discussion
In this study, we found UHR was higher in AAA patients than controls and AAD patients. And UHR showed better value for screening AAA compared with UA and HDL-C. A cut-off point of UHR for AAA, 7.78 was firstly determined in Chinese subjects, which was capable to screening AAA even when AAD patients were included as controls. To our knowledge, this is the first study to demonstrate that UHR can act as a potential biomarker for AAA diagnosis.
UHR has been regarded as indicator of metabolic imbalance [Citation18,Citation19]. It was reported to be a strong predictor of metabolic syndrome in patients with type 2 diabetes mellitus (T2DM) [Citation18,Citation19]. Diabetic kidney injury (DKI) is a serious microvascular complication of T2DM. The median UHR of the diabetic patients with DKI group was significantly elevated compared to the those without DKI [Citation24]. Logistic regression analysis confirmed that a 0.1 point increase in UHR increases DKI odds by 2.3 times [Citation24]. It indicates that UHR could be a diagnostic tool in DKI, and there is a close relationship between microvascular diseases and UHR. It was found that high level of serum UA exerted unfavourable effects directly on vascular endothelium via the NF-κB signalling pathway [Citation25]. UA-treated endothelial cells displayed decreased proliferation, reduced nitric oxide release and increased adhesion to monocytes [Citation25,Citation26]. Considering that endothelial cells also constitute the intima of large arteries, hyperuricemia may also have a potential impact on the wall of large arteries.
AAA patients in this study had higher UHR than the controls, supporting that hyperuricemia also took part in the occurrence and development of macrovascular diseases. Dual-energy computed tomography showed that gout patients had significantly higher volume of monosodium urate crystals (MSU) within the aorta compared to controls [Citation27,Citation28]. Significantly increased UA levels were demonstrated in the wall of aortic aneurysms and in carotid plaque [Citation29]. Additionally, serum UA level was elevated in Behçet’s disease patients with AAD compared to those without AAD, and ROC curve displayed that serum UA level presented with great predictive value for AAD risk in patients with Behçet’s disease [Citation30]. Recently, the preoperative uric acid-to-albumin ratio was identified as an independent risk factor for one-year mortality in patients with AAD of Type A [Citation31]. These results support that MSU deposit not only in the joint area, but also in the extra-joint area, including the macrovascular walls [Citation32]. Previous studies had reported that UA stimulated the proliferation and differentiation of vascular smooth muscle cells in vitro and in vivo, and promoted obvious vascular calcification [Citation33,Citation34]. Moreover, UA-induced monocyte chemoattractant protein-1 production in vascular smooth muscle cells via mitogen-activated protein kinase and cyclooxygenase-2 [Citation35]. These suggest that UA promotes critical proinflammatory pathways in vascular smooth muscle cells, in addition to impairing vascular endothelial function, and thus may play a role in the vascular changes associated with macrovascular diseases.
It was interesting that UHR in AAA group was higher than that in AAD group. Patients with AAD commonly show more severe clinical manifestations and more intense inflammatory response in vivo than those with AAA. Unlike MHR, another derived indicator containing monocyte, closely relates to inflammation, UHR is a factor that reflects metabolic disorders [Citation8,Citation18,Citation19]. MHR in AAD group was significantly higher than that in the controls in a previous study [Citation8]. It was reported that MHR was significantly and positively correlated with serum UA levels in Chinese adults [Citation36]. However, there was no significant difference in UHR between CON group and AAD group in this study. This raises the possibility that UA-associated metabolic disorder may play a greater role in AAA than in AAD, while AAD is closely related to monocyte/macrophage-mediated inflammation. A Real-World population study in China found that higher serum UA level could influence the vascular function mainly instead of vascular structure [Citation37]. Commonly, the destruction severity and inflammation state of vascular structure in AAD is greater than that in AAA. Therefore, UHR is more likely to be associated with relatively early or mild vascular pathologic changes.
HDL, known for its reversal cholesterol transportation function, can protect against atherosclerotic cardiovascular diseases [Citation38]. In addition, HDL exhibits excellent anti-inflammatory, anti-oxidative, vasodilatory, and insulin-sensitizing properties [Citation38,Citation39]. Therefore, it is reasonable that the AUC of the ROC curve of HDL-C is less than 0.5. Low HDL-C level is commonly secondary to high TG level [Citation40]. AAA patients in this study had significantly reduced HDL-C and increased TG levels when compared to the controls and AAD patients. Unlike HDL-C and UA levels, univariate analysis did not support the contribution of TG level to AAA. It suggests that the potential impact of low HDL-C level on AAA may exceed that of high TG level. It was found that higher serum UA level was closely linked to smaller HDL particles that were prone to be quickly cleared by the kidney [Citation41]. This potentially weakening the protective effect of HDL on blood vessels. Further research is needed to understand the implications of this relationship on AAA development.
Additionally, the application of lipid-lowering drugs might lead to the differences in biochemical parameters, including UA and blood lipids, among three groups. The percentage of patients with lipid-lowering therapy was lowest in AAA group (6%) while highest in AAD group (33%) among three groups. Lipid-lowering drugs, including statins and fibrates, are known to raise HDL-C levels by about 5%-20% [Citation42]. They have also been reported to reduce serum UA levels [Citation43–45]. Although AAA patients had higher TG and UA levels and lower HDL-C levels than AAD patients, the difference in TC levels between two groups did not reach statistic significance, which did not seem to support the obvious effect of lipid-lowering drugs on the above parameters including UA and HDL-C. Therefore, it cannot be ruled out that there may be other underlying causes for the differences in biochemical parameters between different groups.
This study was associated with some limitations. Firstly, this is a single-centre observational study with a relatively small sample size. Secondly, we only enrolled the patients who had already been diagnosed as AAA or AAD. Patients with suspected diagnosis due to atypical manifestations were not included in this study.
In summary, UHR is easy to obtain and can be widely used in clinical practice to improve the diagnosis of AAA. The optimal cut-off point for UHR to AAA was determined for the first time in Chinese subjects.
Authors’ contributions
Jin Xu carried out the experimental work, the analysis and interpretation of data and drafted the manuscript. Xiao Du and Shilan Zhang participated in the study design, data collection. Xueyan Zang and Zixi Xiao participated in the analysis and interpretation of the data; Rongkai Su and Xiadie Huang participated in the draft of the paper. Jin Xu and Ling Liu revised the manuscript. All authors have accepted responsibility for the entire content of this manuscript and approved its submission.
Ethics approval and consent to participate
The study was approved by the Ethics Committee of the Second Xiangya Hospital of Central South University and informed consent was gained from all participants.
Disclosure statement
No potential conflict of interest was reported by the author(s).
Availability of data and materials
The datasets analysed during the current study are available from the corresponding author on reasonable request.
Correction Statement
This article has been corrected with minor changes. These changes do not impact the academic content of the article.
Additional information
Funding
References
- Katsuki S, et al. Nanoparticle-Mediated delivery of pitavastatin to monocytes/macrophages inhibits angiotensin II-Induced abdominal aortic aneurysm formation in apoe(-/-) mice. J Atheroscler Thromb. 2022;29(1):1–8.
- Li Y, Wang DD, Ley SH, et al. Potential impact of time trend of Life-Style factors on cardiovascular disease burden in China. J Am Coll Cardiol. 2016;68(8):818–833. doi: 10.1016/j.jacc.2016.06.011.
- Kaluza J, Stackelberg O, Harris HR, et al. Anti-inflammatory diet and risk of abdominal aortic aneurysm in two swedish cohorts. Heart. 2019;105(24):1876–1883. doi: 10.1136/heartjnl-2019-315031.
- Meital LT, et al. Abdominal aortic aneurysm and omega-3 polyunsaturated fatty acids: mechanisms, animal models, and potential treatment. Prostaglandins Leukot Essent Fatty Acids. 2017;118:1–9.
- Deeg MA, et al. Prognostic and predictive biomarkers of abdominal aortic aneurysm growth rate. Curr Med Res Opin. 2016;32(3):509–517.
- Burillo E, Lindholt JS, Molina-Sánchez P, et al. ApoA-I/HDL-C levels are inversely associated with abdominal aortic aneurysm progression. Thromb Haemost. 2015;113(6):1335–1346. doi: 10.1160/TH14-10-0874.
- Liu XT, et al. High-density lipoprotein cholesterol and in-hospital mortality in patients with acute aortic dissection. J Huazhong Univ Sci Technolog Med Sci. 2016;36(3):364–367.
- Du X, et al. Diagnostic value of monocyte to high-density lipoprotein ratio in acute aortic dissection in a chinese han population. Expert Rev Mol Diagn. 2020;20(12):1243–1252.
- Otaki Y, Watanabe T, Konta T, et al. Impact of hyperuricemia on mortality related to aortic diseases: a 3.8-year nationwide community-based cohort study. Sci Rep. 2020;10(1):14281. doi: 10.1038/s41598-020-71301-6.
- Dehlin M, Jacobsson L, Roddy E. Global epidemiology of gout: prevalence, incidence, treatment patterns and risk factors. Nat Rev Rheumatol. 2020;16(7):380–390. doi: 10.1038/s41584-020-0441-1.
- Li X, et al. Uric acid in aortic dissection: a meta-analysis. Clin Chim Acta. 2018;484:253–257.
- Wang J-C, Tsai S-H, Chien W-C, et al. Association between gout and abdominal aortic aneurysm. J Cardiol. 2023;82(4):274–278.
- Wang J-C, Tsai S-H, Tsai H-Y, et al. Hyperuricemia exacerbates abdominal aortic aneurysm formation through the URAT1/ERK/MMP-9 signaling pathway. BMC Cardiovasc Disord. 2023;23(1):55. doi: 10.1186/s12872-022-03012-x.
- Aydın C, Emlek N. The relationship between uric acid to high-density lipoprotein cholesterol ratio and collateral index in patients with chronic total occlusion. Kardiologiia. 2021;61(9):61–65. doi: 10.18087/cardio.2021.9.n1750.
- Kurtkulagi O, Tel BMA, Kahveci G, et al. Hashimoto’s thyroiditis is associated with elevated serum uric acid to high density lipoprotein-cholesterol ratio. Rom J Intern Med. 2021;59(4):403–408. doi: 10.2478/rjim-2021-0023.
- Kosekli MA, Kurtkulagii O, Kahveci G, et al. The association between serum uric acid to high density lipoprotein-cholesterol ratio and non-alcoholic fatty liver disease: the abund study. Rev Assoc Med Bras (1992). 2021;67(4):549–554. (1992),
- Aktas G, Khalid A, Kurtkulagi O, et al. Poorly controlled hypertension is associated with elevated serum uric acid to HDL-cholesterol ratio: a cross-sectional cohort study. Postgrad Med. 2022;134(3):297–302. doi: 10.1080/00325481.2022.2039007.
- Kocak MZ, et al. Serum uric acid to HDL-cholesterol ratio is a strong predictor of metabolic syndrome in type 2 diabetes mellitus. Rev Assoc Med Bras. (1992), 2019;65(1):9–15.
- Yazdi F, et al. Investigating the relationship between serum uric acid to high-density lipoprotein ratio and metabolic syndrome. Endocrinol Diabetes Metab. 2022;5(1):e00311.
- Liu R, et al. Uric acid to high-density lipoprotein cholesterol ratio predicts cardiovascular mortality in patients on peritoneal dialysis. Nutr Metab Cardiovasc Dis. 2021;31(2):561–569.
- Chen S, Yang D, Lei C, et al. Identification of crucial genes in abdominal aortic aneurysm by WGCNA. PeerJ. 2019;7:e7873. doi: 10.7717/peerj.7873.
- Wang Y, et al. An integrated fluid-chemical model toward modeling the thrombus formation in an idealized model of aortic dissection. Comput Biol Med. 2021;136:104709.
- Xu J, Chen Y-Q, Zhao S-P, et al. Determination of optimal cut-off points after a high-fat meal corresponding to fasting elevations of triglyceride and remnant cholesterol in chinese subjects. Lipids Health Dis. 2019;18(1):206. doi: 10.1186/s12944-019-1146-9.
- Aktas G, Yilmaz S, Kantarci DB, et al. Is serum uric acid-to-HDL cholesterol ratio elevation associated with diabetic kidney injury? Postgrad Med. 2023;135(5):519–523. doi: 10.1080/00325481.2023.2214058.
- Liang WY, et al. Uric acid promotes chemokine and adhesion molecule production in vascular endothelium via nuclear factor-kappa B signaling. Nutr Metab Cardiovasc Dis. 2015;25(2):187–194.
- Kang D-H, Park S-K, Lee I-K, et al. Uric acid-induced C-reactive protein expression: implication on cell proliferation and nitric oxide production of human vascular cells. J Am Soc Nephrol. 2005;16(12):3553–3562. doi: 10.1681/ASN.2005050572.
- Klauser AS, Halpern EJ, Strobl S, et al. Dual-Energy computed tomography detection of cardiovascular monosodium urate deposits in patients with gout. JAMA Cardiol. 2019;4(10):1019–1028. doi: 10.1001/jamacardio.2019.3201.
- Barazani SH, et al. Quantification of uric acid in vasculature of patients with gout using dual-energy computed tomography. World J Radiol. 2020;12(8):184–194.
- Patetsios P, Rodino W, Wisselink W, et al. Identification of uric acid in aortic aneurysms and atherosclerotic artery. Ann N Y Acad Sci. 1996;800:243–245.
- Atıl A, Deniz A. Could be serum uric acid a risk factor for thrombosis and/or uveitis in behcet’s disease? Vascular. 2018;26(4):378–386. doi: 10.1177/1708538117742831.
- Wang X, et al. The preoperative uric acid-to-Albumin ratio as a new indicator to predict Long-Term prognosis after surgery for patients with acute type a aortic dissection. Heart Surg Forum. 2023;26(1):E001–E008.
- Nasonova VA, Zakharova MM, Barskova VG[, et al. Detection of sodium monourate crystals in biopsies of gastric mucosa in patients with gout]. Ter Arkh. 2004;76(6):47–51.
- Kang D-H, Nakagawa T, Feng L, et al. A role for uric acid in the progression of renal disease. J Am Soc Nephrol. 2002;13(12):2888–2897. doi: 10.1097/01.asn.0000034910.58454.fd.
- Yan B, et al. The effects of hyperuricemia on the differentiation and proliferation of osteoblasts and vascular smooth muscle cells are implicated in the elevated risk of osteopenia and vascular calcification in gout: an in vivo and in vitro analysis. J Cell Biochem. 2019;120(12):19660–19672.
- Kanellis J, Watanabe S, Li JH, et al. Uric acid stimulates monocyte chemoattractant protein-1 production in vascular smooth muscle cells via mitogen-activated protein kinase and cyclooxygenase-2. Hypertension. 2003;41(6):1287–1293. doi: 10.1161/01.HYP.0000072820.07472.3B.
- Li Y, Liu X, Luo Y. Monocyte to high-density lipoprotein cholesterol ratio and serum uric acid in chinese adults: a cross-sectional study. BMC Endocr Disord. 2022;22(1):48. doi: 10.1186/s12902-022-00966-z.
- Liu H, Liu J, Zhao H, et al. Relationship between serum uric acid and vascular function and structure markers and gender difference in a Real-World population of China-from beijing vascular disease patients evaluation study (BEST) study. J Atheroscler Thromb. 2018;25(3):254–261. doi: 10.5551/jat.39685.
- Nagao M, Nakajima H, Toh R, et al. Cardioprotective effects of high-density lipoprotein beyond its anti-Atherogenic action. J Atheroscler Thromb. 2018;25(10):985–993. doi: 10.5551/jat.RV17025.
- Manandhar B, Cochran BJ, Rye KA. Role of high-density lipoproteins in cholesterol homeostasis and glycemic control. J Am Heart Assoc. 2020;9(1):e013531.
- Meas T, et al. Switching fibrate to statin in type 2 diabetic patients: consequences on lipid profile. Eur J Intern Med. 2009;20(2):197–200.
- Vekic J, Jelic-Ivanovic Z, Spasojevic-Kalimanovska V, et al. High serum uric acid and low-grade inflammation are associated with smaller LDL and HDL particles. Atherosclerosis. 2009;203(1):236–242. doi: 10.1016/j.atherosclerosis.2008.05.047.
- Razavi AC, Jain V, Grandhi GR, et al. Does elevated high-density lipoprotein cholesterol protect against cardiovascular disease? J Clin Endocrinol Metab. 2024;109(2):321–332. doi: 10.1210/clinem/dgad406.
- Derosa G, Maffioli P, Sahebkar A. Plasma uric acid concentrations are reduced by fenofibrate: a systematic review and meta-analysis of randomized placebo-controlled trials. Pharmacol Res. 2015;102:63–70.
- Zhang J, Ji X, Dong Z, et al. Impact of fenofibrate therapy on serum uric acid concentrations: a review and meta-analysis. Endocr J. 2021;68(7):829–837. doi: 10.1507/endocrj.EJ20-0808.
- Akbari A, et al. The effect of statin therapy on serum uric acid levels: A Systematic review and meta-analysis. Curr Med Chem. 2024;31:1726–1739. doi: 10.2174/0929867330666230207124516.