
 ?Mathematical formulae have been encoded as MathML and are displayed in this HTML version using MathJax in order to improve their display. Uncheck the box to turn MathJax off. This feature requires Javascript. Click on a formula to zoom.
Abstract
Background
Patients with hip fractures frequently need to receive perioperative transfusions of concentrated red blood cells due to preoperative anemia or surgical blood loss. However, the use of perioperative blood products increases the risk of adverse events, and the shortage of blood products is prompting us to minimize blood transfusion. Our study aimed to construct a machine learning algorithm predictive model to identify patients at high risk for perioperative transfusion early in hospital admission and to manage their patient blood to reduce transfusion requirements.
Methods
This study collected patients hospitalized for hip fractures at a university hospital from May 2016 to November 2022. All patients included in the analysis were randomly divided into a training set and validation set according to 70:30. Eight machine learning algorithms, CART, GBM, KNN, LR, NNet, RF, SVM, and XGBoost, were used to construct the prediction models. The models were evaluated for discrimination, calibration, and clinical utility, and the best prediction model was selected.
Results
A total of 805 patients were included in the study, of whom 306 received transfusions during the perioperative period. We screened eight features used to construct the prediction model: age, fracture time, fracture type, hemoglobin, albumin, creatinine, calcium ion, and activated partial thromboplastin time. After evaluating and comparing the performance of each of the eight models, the model constructed by the XGBoost algorithm had the best performance, with MCC values of 0.828 and 0.939 in the training and validation sets, respectively. In addition, it had good calibration and clinical utility in both the training and validation sets.
Conclusion
The model constructed by the XGBoost algorithm has the best performance, using this model to identify patients at high risk for transfusion early in their admission and promptly incorporating them into a patient blood management plan can help reduce the risk of transfusion.
1. Introduction
Hip fractures are the most devastating type of osteoporotic fracture, with high morbidity and mortality [Citation1]. There are an estimated 14.2 million hip fractures worldwide in 2019, with an age-standardized incidence of 182 per 100,000 people [Citation2]. As the population ages [Citation3], the absolute number of hip fracture events continues to increase [Citation4], despite the decline in the age-adjusted incidence of hip fractures in most Western countries [Citation5–7].
Due to preoperative anemia or surgical blood loss, hip fracture patients often need to receive perioperative transfusions of concentrated red blood cells [Citation8]. A national study of perioperative transfusions for hip fractures in Scotland revealed an overall transfusion rate of 28.7% (n = 6,685) during hospital admission, with varying transfusion rates between hospitals, ranging from 16.6% to 37.4% [Citation9]. Although controversial, numerous studies have indicated that the use of perioperative blood products is associated with several adverse events [Citation10–15]. Identifying patients at high risk for perioperative transfusion early in their admission and implementing patient blood management (PBM) can significantly reduce transfusion requirements [Citation16,Citation17], offering a therapeutic opportunity to avoid transfusions and enhance patient prognosis [Citation18].
Machine learning (ML) algorithms, a subset of artificial intelligence, can learn from input data and make predictions or classifications [Citation19]. Predictive models based on ML algorithms have been developed for various topics in orthopaedic surgery [Citation20]. However, to date, no studies have applied them to perioperative transfusions for hip fractures. Our study aims to identify high-risk patients early in their admission by analysing their admission data, screening for early risk factors associated with perioperative transfusion, and constructing predictive models using machine learning algorithms.
2. Materials and methods
2.1. Data collection
In this study, patients hospitalized for hip fractures at a university hospital from May 2016 to November 2022 were collected. Relevant medical record data information was extracted from the electronic medical record system. Inclusion criteria for patients were: 1. confirmed diagnosis of intertrochanteric fracture or femoral neck fracture; 2. age of patients not less than 60 years. The exclusion criteria for patients were: 1. pathological fractures; 2. multiple injuries; 3. patients with combined cancer, acute cardiovascular disease, preoperative co-infection, or patients who had been bedridden for a long time before the fracture; 4. more than 20% of the data items were missing; 5. Non-surgical treatment. We have previously performed a prediction of pneumonia after hip fracture surgery based on this population using similar inclusion and exclusion criteria [Citation21].
We adopt a restrictive strategy for blood transfusion, and the criteria for transfusing concentrated red blood cells are: (1) the patient’s hemoglobin is <70 g/L; (2) when the hemoglobin is between 70 and 100 g/L, the decision to transfuse red blood cells is based on the patient’s cardiopulmonary compensatory function, the presence or absence of increased metabolic rate, age, and other factors.
The variables we extracted were all general information available within 24 h of admission. We will describe the variables using the following format: [variable information (abbreviations or surrogates in the manuscript)]. The extracted data included: sex (Female), age (Age), fracture side (Left), fracture time, hypertension (HBP), coronary heart disease (CHD), diabetes mellitus (DM), cerebral infarction (CI), chronic obstructive pulmonary disease (COPD), fracture type (femoral neck fracture, FNF), white blood cell count (WBC), neutrophil ratio (N), red blood cell count (RBC), haemoglobin (HB), platelet count (PLT), glucose (GLU), alanine transaminase (ALT), aspartate Transaminase (AST), total bilirubin (STB), direct bilirubin (DBIL), indirect bilirubin (IBIL), albumin (ALB), blood urea nitrogen (BUN), creatinine (Cr), potassium ion (Ka +), sodium ion (Na+), calcium ion (Ca+), prothrombin time (PT), international normalized ratio (INR), prothrombin activity (PTA), activated partial thromboplastin time (APTT), thromboplastin time (TT), fibrinogen (FIB). Data extraction was performed independently by one of the authors and verified for accuracy by another independent author.
The study was approved by the hospital ethics review committee (ethics number: KYXM-202302-010). An informed consent waiver was obtained because the study was retrospective and the patient’s personal information was withheld from the analysis. All procedures performed in this study were in accordance with the 1964 Declaration of Helsinki and subsequent amendments.
2.2. Statistical analysis
We employed the multiple interpolation technique to recover missing data, utilizing the ‘mice’ package in R for implementation. Normally distributed continuous variables were expressed as mean ± standard deviation, non-normally distributed continuous variables as median (interquartile range), and categorical variables as percentages. Continuous variables were analysed by independent Student’s t-test or Mann–Whitney U and expressed as mean (standard deviation) or median (interquartile interval). Categorical variables were analysed based on distribution using the chi-square test, Wilcoxon rank sum test, Fisher test, and continuity correction and expressed as case numbers and composition ratios.
All patients included in the analysis were randomly divided into a training set and a validation set following a 70:30 ratio. To avoid the effect of multicollinearity among variables, we will use the least absolute shrinkage and selection operator (LASSO) technique for screening variables [Citation22,Citation23]. The filtered variables are incorporated as final features in the model of the ML algorithm. Eight machine learning algorithms, including Classification and Regression Trees (CART), Gradient Boosting Machines (GBM), k-Nearest Neighbours (KNN), Logistic Regression (LR), Neural Network (NNet), Random Forest (RF), Support Vector Machines (SVM), and eXtreme Gradient Boosting (XGBoost), were utilized to construct prediction models. Ten times 10-fold cross-validation resampling is used to ensure stability and repeatability of model performance.
Matthews correlation coefficient (MCC) is used as the main statistical metric for the evaluation of the predictive performance of our model. MCC is particularly suitable for assessing the predictive performance of imbalanced datasets [Citation24]. It is calculated to correlate with all four confusion matrix categories of the dichotomous confusion matrix (true-positive TP, false-negative FN, true-negative TN, and false-positive FP), and is the only statistic that produces a high score only if the prediction yields good results in all four confusion matrix categories. .The value of MCC is taken at [-1,+1], with a value greater than 0.7 indicates a good predictive performance. The area under the curve (AUC) of the receiver operating characteristic curve (ROC curve), accuracy (ACC), sensitivity (SEN), specificity (SPE), and F1 score are used as supplementary indicators to evaluate the predictive performance of the model. These statistics range from 0 to 1, and as their values get closer to 1 they indicate better predictive performance of the model. The Kappa statistic is used to determine whether the models’ predictions are consistent with the actual results. The Kappa statistic value ranges from −1 to +1. The closer the Kappa statistic value is to 1, the better the consistency, with a value greater than 0.75 indicating very good consistency. The calibration plot is used to represent the calibration degree of the evaluated model. Brier Score is used to evaluate the overall performance of the model, with values closer to 0 indicating better performance. When the Brier Score is 0, it indicates that the overall performance of the model is perfect; when the Brier Score is greater than 0.25 it indicates that the overall performance of the model is worthless [Citation25]. Decision Curve Analysis (DCA) is used to evaluate the clinical utility of column line graphs in decision-making. The ML algorithm prediction model is selected by combining various statistical indicators using MCC as the main statistical indicator. And Shapely Additive exPlanations (SHAP) values were used to interpret the best ML model.
All statistical analyses, model construction, and validation in this study were implemented based on R software (version 4.1.3).
3. Results
Based on the inclusion and exclusion criteria, 805 patients were finally included in the study and the process of screening and analysis is shown in . 306 (38.01%) of them received transfusion in the perioperative period and the baseline information of all patients is shown in . All patients were randomly divided into a training set (563 patients, 70%) and validation set (242 patients, 30%) and the baseline information of patients in both groups are shown in S1. We extracted 32 features from each patient. To avoid multicollinearity among the variables included in the model, we used LASSO regression to filter the characteristics included in the model. The results showed that when the lambda value was chosen as lambda.1se (0.04265), a total of 8 features with non-zero coefficients were screened (), namely: age, fracture time, FNF, HB, ALB, Cr, Ca+, and APTT. We utilized the screened features to construct prediction models using eight ML algorithms.
Figure 1. Flowchart of data screening and analysis.
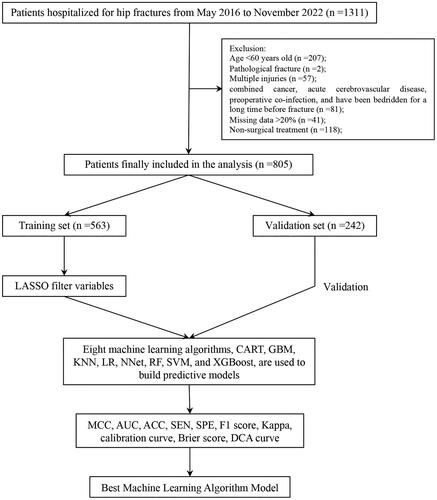
Figure 2. The potential risk factors were selected using the LASSO regression. a: Trend graph of variance filter coefficients. Each colour curve represents a trend in variance coefficient change. b: Graph of cross-validation results. The vertical line on the left side represents λ min, and the vertical line on the right side represents λ 1se. λ min refers to the λ value corresponding to the minimum mean squared error (MSE) among all λ values; λ 1se refers to the λ value corresponding to the simplest and best model obtained after cross-validation within a square difference range of λ min.
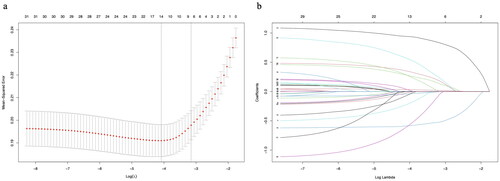
Table 1. Characteristics of patients in the training set.
The performance of the models constructed by each algorithm was determined by resampling with ten times ten-fold cross-validation. The MCCs of CART, GBM, KNN, LR, NNet, RF, SVM, and XGBoost algorithms in the training set are 0.615, 0.667, 0.679, 0.438, 0.494, 0.715, 0.561, and 0.828; and in the validation set are 0.799, 0.740, 0.734, 0.406, 0.604, 0.843, 0.648, 0.939 (). The models constructed by RF and XGBoost algorithms have good predictive performance on the statistical metric of MCC. The AUC values were calculated based on the ROC curves. The AUC values (95% confidence interval) of CART, GBM, KNN, LR, NNet, RF, SVM, and XGBoost algorithms in the training set () were 0.899 (0.874, 0.923), 0.904 (0.879, 0.928), 0.929 (0.91, 0.948), 0.786 (0.748, 0.825), 0.826 (0.792, 0.86), 0.927 (0.906, 0.948), 0.834 (0.799, 0.869), and 0.982 (0.974, 0.989); the AUC values (95% confidence interval) in the validation set () were 0.971 (0.955, 0.988), 0.949 (0.924, 0.973), 0.929 (0.898, 0.96), 0.757 (0.692, 0.822), 0.88 (0.838, 0.923), 0.966 (0.946, 0.987), 0.869 (0.819, 0.919), 0.997 (0.955, 1) (). The ROC curves of the models constructed by each algorithm are shown in S2-S17. The model constructed by the XGBoost algorithm also shows the best performance in terms of ACC, SEN, SPE, and F1 score, which are statistical metrics (). The Kappa values of CART, GBM, KNN, LR, NNet, RF, SVM, and XGBoost algorithms in the training set are: 0.598, 0.667, 0.674, 0.437, 0.483, 0.706, 0.543, and 0.826 respectively; and in the validation set are, 0.799, 0.739, 0.733, 0.398, 0.591, 0.843, 0.646, 0.939 (). Only XGBoost algorithm has a good consistency performance in both training and validation sets. The calibration curves show that the models have good calibration in both the training set () and the validation set (). The calibration curves of the models constructed by each algorithm are shown in S18-33. The Brier Scores of CART, GBM, KNN, LR, NNet, RF, SVM, and XGBoost algorithms in the training set are: 0.128, 0.124, 0.114, 0.179, 0.163, 0.11, 0.17, 0.059, and in the validation set are: 0.071, 0.096, 0.119, 0.189, 0.137, 0.084, 0.059, respectively, 0.11, 0.17, 0.059; the Brier Scores in the validation set are: 0.071, 0.096, 0.119, 0.189, 0.137, 0.084, 0.171, 0.027, respectively (). The Brier Score of each model is below 0.25, indicating satisfactory overall performance for each model. The DCA curves show that in both the training set () and the validation set (), the models achieve higher net returns than the ‘all-intervention’ or ‘no-intervention’ strategies within a wide range of thresholds. The DCA curves of the models constructed by each algorithm are shown in S34-S49. Combining the results of the model performance evaluation, the models constructed by the XGBoost algorithm have the best performance. We further plotted a summary plot of SHAP values () to interpret the XGBoost model results. For each feature, one point corresponds to one patient. The position of the point on the x-axis (i.e. the actual SHAP value) indicates the effect of the feature on the model output for that particular patient. The results showed that Age, HB, and FNF were the top three important characteristics of perioperative blood transfusion for hip fractures in the elderly.
Figure 3. ROC curves, calibration curves, and DCA curves for each model in the training and validation sets. a: ROC curve in the training set; b: ROC curve in the validation set; c: Calibration curve in the training set; d: Calibration curve in the validation set; e: DCA curve in the training set; f: DCA curve in the validation set.
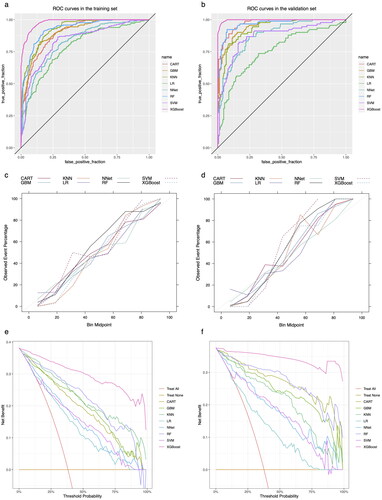
Figure 4. Summary plot of SHAP values for the model constructed by XGBoost algorithm. a: Summary plot of SHAP values in the training set; b: Summary plot of SHAP values in the validation set. The vertical coordinates show the importance of the features, sorted by the importance of the variables in descending order, with the upper variables being more important to the model. For the horizontal position ‘SHAP value’ shows whether the impact of the value is associated with a higher or lower prediction. The colour of each SHAP value point indicates whether the observed value is higher (purple) or lower (yellow).
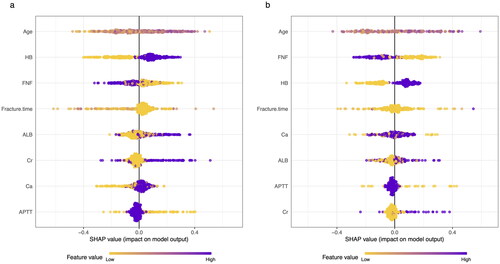
Table 2. Evaluation metrics of the models constructed by each algorithm.
4. Discussion
Despite improvements in modern surgical techniques within orthopaedics, hip fracture surgery is still associated with significant perioperative blood loss, which requires a blood transfusion [Citation26]. More than 10 million units of red blood cells were transfused in the United States in 2019, making transfusions one of the most common procedures during hospitalization and narrowing the gap between blood supply and demand [Citation27]. Forty-five percent of patients undergoing major orthopedic surgery receive perioperative red blood cell transfusions [Citation8]. However, high-quality evidence on the benefits and harms of red blood cell transfusion is limited [Citation28]. At the same time, in the context of public health crises such as the COVID-19 pandemic, there has been a decrease or delayed increase in blood donations and sometimes there may be a shortage of blood [Citation29,Citation30]. Therefore, early identification of patients at high risk for perioperative transfusion and immediate enrollment of high-risk patients into a PBM program to reduce transfusion requirements is essential [Citation31]. The use of intravenous iron supplementation, erythropoietin (EPO), and tranexamic acid are a part of the PBM program, and many studies show a reduced transfusion requirement for patients with hip fractures [Citation32–36].
In this study, we developed and validated multiple ML models to predict perioperative transfusion risk for hip fractures in the older adult. We screened eight features used to construct the predictive models: age, fracture time, FNF, HB, ALB, Cr, Ca+, and APTT. Numerous studies have indicated that both age and preoperative anemia are significant risk factors for perioperative transfusion in hip fractures [Citation37,Citation38]. A study by Adunsky et al. showed that low hemoglobin on admission would be the best predictor of perioperative transfusion and would increase the risk of transfusion by 5-fold [Citation39]. However, in contrast to the results of our study, on the variable of age, the results of this study by Adunsky et al. showed that age was not a risk factor for blood transfusion [Citation39]. This result is similarly supported by Desai et al. [Citation40]. This suggests that we need to view this result with more caution. Similar to our findings, Morris’ study showed that transfusion rates during hospital admission were significantly higher in patients with intertrochanteric femoral fractures than in patients with intracapsular fractures [Citation41]. Shokoohi’s study reported that the risk of transfusion for extracapsular fractures was 2.5 times higher than for intracapsular fractures [OR (95% CI): 2.5 (1.83, 3.45)] [Citation42]. This may be due to the fact that intertrochanteric femoral fractures have a greater bone surface area for blood loss and also do not have the presence of a joint capsule to contain the fracture hematoma and reduce bleeding by acting as a filler [Citation37,Citation41]. In a retrospective study of 583 patients with hip fractures, Wang et al. showed that hypocalcaemia was significantly associated with increased total blood loss and transfusion volume [Citation43]. Similarly, a study of 591 emergency trauma patients by Magnotti et al. showed that hypocalcemiaaemia on admission predicted the need for multiple and massive blood transfusions [Citation44]. Although hypocalcaemia is traditionally thought to be secondary to a blood transfusion, a growing body of data suggests that most trauma patients have hypocalcaemia before a blood transfusion [Citation44]. The possible factors leading to this condition are complex and include the production of lactate and calcium binding in trauma patients, impaired parathyroid and hormonal function, and calcium influx into cells during ischemia-reperfusion [Citation44–46]. Furthermore, the study by Wang et al. also focused on the variable of time from injury to hospital admission, similar to our study [Citation43]. Although in developed countries, the probability of delayed hospital admission after a hip fracture in older adults is very small. However, in less economically developed rural areas, there is still a proportion of elderly people who cannot be admitted to the hospital in time for treatment after a hip fracture. During this period, the patient’s fracture site continues to bleed, leading to an increase in blood loss and consequently an increased risk of transfusion [Citation18].
This study has several advantages. 1. It is the first study to apply the ML algorithm to predict perioperative transfusion in hip fracture patients, and the optimal model demonstrates excellent performance across all performance evaluations. 2. This study is the first to predict the risk of perioperative blood transfusion in older adults with hip fractures based on data collected at the time of admission. Using data collected early in the admission, it is possible to identify patients at high risk for perioperative transfusion early in the admission, to perform adequate PBM in advance, and to reduce perioperative transfusion. 3. No clinical interventions such as time of surgery and surgical modality were included, which to some extent avoided bias caused by interventions.
However, there are some limitations to our study. First and foremost, similar to the majority of predictive modelling studies, the data used in our study were sourced from a single centre. The primary limitation of this study is the lack of external data validation. Using data from a single center to train a machine learning model increases the risk of model overfitting and blood transfusions are significantly heterogeneous across hospitals and physician practices, which can lead to potentially limited the generalizability of the model [Citation47]. Therefore, model applications to other regions and populations should be treated with caution. Further validation of external data is needed to evaluate the performance of our model. Moreover, in the future, we can further utilize ensemble learning methods for model construction, as they not only enhance the model’s generalization ability but also improve its predictive performance [Citation48]. Second, this is a retrospective study, and thus some degree of selection and analysis bias may exist and further prospective studies are needed. Lastly, another limitation of this study is the insufficient sample size for constructing the machine learning models. Although our sample size was able to meet the minimum requirements for constructing the model [Citation49–51], the sample size included in the study was still not large enough, which may lead to insufficient robustness of the conclusions.
5. Conclusion
We constructed a prediction model based on an ML algorithm for predicting the risk of perioperative transfusion for hip fracture in elderly people. Using these eight features – age, fracture time, FNF, HB, ALB, Cr, Ca+, APTT – we constructed eight models, each employing one of the following eight machine learning algorithms: CART, GBM, KNN, LR, NNet, RF, SVM, XGBoost. After evaluating the performance of models on both the training and validation sets, the model constructed by the XGBoost algorithm demonstrated the best performance. We can utilize this model to identify high-risk patients for transfusion early upon admission, and providing comprehensive PBM to these high-risk patients can help reduce the risk of transfusion.
Acknowledgment
Thanks to Caiju Peng, Ru Dai, and Wei Li for their help and contributions during the data collection process.
Authors’ contributions
Jiale Guo contributed to the data collection, the data analysis, the software, and the writing the original draft, Qionghan He contributed to the software and writing the original draft, Yehai Li contributed to the project administration and the revision of the manuscript. All authors read and approved the final manuscript.
Ethics approval and consent to participate
The study was approved by the Ethics Review Committee of Chaohu Hospital of Anhui Medical University (Ethics No. KYXM-202302-010). An informed consent waiver was obtained because the study was retrospective and the patient’s personal information was withheld from the analysis. All procedures performed in this study were by the Declaration of Helsinki.
Consent for publication
This manuscript has not been published elsewhere and is not under consideration by another journal. All authors have approved the manuscript and agree with the submission.
Supplemental Material
Download MS Word (674.5 KB)Disclosure statement
The authors declare that the research was conducted in the absence of any commercial or financial relationships that could be construed as a potential conflict of interest.
Availability of data and materials
The datasets analysed during the current study are available from the corresponding author on reasonable request.
Additional information
Funding
References
- Johnell O, Kanis JA. An estimate of the worldwide prevalence, mortality and disability associated with hip fracture. Osteoporos Int. 2004;15(11):1–12. Nov doi: 10.1007/s00198-004-1627-0.
- Dong Y, Zhang Y, Song K, et al. What was the epidemiology and global burden of disease of hip fractures from 1990 to 2019? Results from and additional analysis of the global burden of disease study 2019. Clin Orthop Relat Res. 2022;481(6):1209–1220. Nov 2 doi: 10.1097/corr.0000000000002465.
- Beard JR, Officer A, de Carvalho IA, et al. The world report on ageing and health: a policy framework for healthy ageing. Lancet. 2016;387(10033):2145–2154. doi: 10.1016/s0140-6736(15)00516-4.
- Omsland TK, Magnus JH. Forecasting the burden of future postmenopausal hip fractures. Osteoporos Int. 2014;25(10):2493–2496. doi: 10.1007/s00198-014-2781-7.
- Ballane G, Cauley JA, Luckey MM, et al. Secular trends in hip fractures worldwide: opposing trends east versus west. J Bone Miner Res. 2014;29(8):1745–1755. doi: 10.1002/jbmr.2218.
- Wahlsten LR, Palm H, Gislason GH, et al. Sex differences in incidence rate, and temporal changes in surgical management and adverse events after hip fracture surgery in Denmark 1997-2017: a register-based study of 153,058 hip fracture patients. Acta Orthop. 2021;92(4):424–430. doi: 10.1080/17453674.2021.1923256.
- Sugand K, Ali R, Goodall R, et al. Trends in neck of femur fracture incidence in EU15+ countries from 1990-2017. Injury. 2023;54(2):645–651. doi: 10.1016/j.injury.2022.11.038.
- Spahn DR. Anemia and patient blood management in hip and knee surgery: a systematic review of the literature. Anesthesiology. 2010;113(2):482–495. doi: 10.1097/ALN.0b013e3181e08e97.
- Farrow L, Brasnic L, Martin C, et al. A nationwide study of blood transfusion in hip fracture patients: linked analysis from the scottish hip fracture audit and the scottish national blood transfusion service. Bone Joint J. 2022;104-b(11):1266–1272. doi: 10.1302/0301-620x.104b11.Bjj-2022-0450.R1.
- Jang SY, Cha YH, Yoo JI, et al. Blood transfusion for elderly patients with hip fracture: a nationwide cohort study. J Korean Med Sci. 2020;35(37):e313. doi: 10.3346/jkms.2020.35.e313.
- Vamvakas EC, Blajchman MA. Transfusion-related mortality: the ongoing risks of allogeneic blood transfusion and the available strategies for their prevention. Blood. 2009;113(15):3406–3417. doi: 10.1182/blood-2008-10-167643.
- Potter LJ, Doleman B, Moppett IK. A systematic review of pre-operative anaemia and blood transfusion in patients with fractured hips. Anaesthesia. 2015;70(4):483–500. doi: 10.1111/anae.12978.
- Beal EW, Bagante F, Paredes A, et al. Perioperative use of blood products is associated with risk of morbidity and mortality after surgery. Am J Surg. 2019;218(1):62–70. doi: 10.1016/j.amjsurg.2018.11.015.
- Bernard AC, Davenport DL, Chang PK, et al. Intraoperative transfusion of 1 U to 2 U packed red blood cells is associated with increased 30-day mortality, surgical-site infection, pneumonia, and sepsis in general surgery patients. J Am Coll Surg. 2009;208(5):931–937e2. 937e12; discussion 938-9. doi: 10.1016/j.jamcollsurg.2008.11.019.
- Ferraris VA, Davenport DL, Saha SP, et al. Surgical outcomes and transfusion of minimal amounts of blood in the operating room. Arch Surg. 2012;147(1):49–55. doi: 10.1001/archsurg.2011.790.
- Warner MA, Schulte PJ, Hanson AC, et al. Implementation of a comprehensive patient blood management program for hospitalized patients at a large United States medical center. Mayo Clin Proc. 2021;96(12):2980–2990. doi: 10.1016/j.mayocp.2021.07.017.
- Kim JH, Shin HJ, You HS, et al. Effect of a patient blood management program on the appropriateness of red blood cell transfusion and clinical outcomes in elderly patients undergoing hip fracture surgery. J Korean Med Sci. 2023;38(8):e64. doi: 10.3346/jkms.2023.38.e64.
- Puckeridge G, Terblanche M, Wallis M, et al. Blood management in hip fractures; are we leaving it too late? A retrospective observational study. BMC Geriatr. 2019;19(1):79. doi: 10.1186/s12877-019-1099-x.
- Beam AL, Kohane IS. Big data and machine learning in health care. Jama. 2018;319(13):1317–1318. doi: 10.1001/jama.2017.18391.
- Ogink PT, Groot OQ, Karhade AV, et al. Wide range of applications for machine-learning prediction models in orthopedic surgical outcome: a systematic review. Acta Orthop. 2021;92(5):526–531. doi: 10.1080/17453674.2021.1932928.
- Guo J, He Q, Peng C, et al. Machine learning algorithms to predict risk of postoperative pneumonia in elderly with hip fracture. J Orthop Surg Res. 2023;18(1):571. doi: 10.1186/s13018-023-04049-0.
- Zou H, Hastie T. Regularization and variable selection via the elastic net. Journal of the Royal Statistical Society Series B-Statistical Methodology. 2005;67(2):301–320. doi: 10.1111/j.1467-9868.2005.00503.x.
- Tibshirani R. Regression shrinkage and selection via the lasso. Journal of the Royal Statistical Society Series B-Methodological. 1996;58(1):267–288. doi: 10.1111/j.2517-6161.1996.tb02080.x.
- Chicco D, Jurman G. The advantages of the matthews correlation coefficient (MCC) over F1 score and accuracy in binary classification evaluation. BMC Genomics. 2020;21(1):6. doi: 10.1186/s12864-019-6413-7.
- Raj R, Skrifvars M, Bendel S, et al. Predicting six-month mortality of patients with traumatic brain injury: usefulness of common intensive care severity scores. Crit Care. 2014;18(2):R60. doi: 10.1186/cc13814.
- Sambandam B, Batra S, Gupta R, et al. Blood conservation strategies in orthopedic surgeries: a review. J Clin Orthop Trauma. 2013;4(4):164–170. doi: 10.1016/j.jcot.2013.11.002.
- Jones JM, Sapiano MRP, Mowla S, et al. Has the trend of declining blood transfusions in the United States ended? Findings of the 2019 national blood collection and utilization survey. Transfusion. Sep 2021;61(Suppl 2):S1–s10. doi: 10.1111/trf.16449.
- Carson JL, Grossman BJ, Kleinman S, et al. Red blood cell transfusion: a clinical practice guideline from the AABB*. Ann Intern Med. 2012;157(1):49–58. doi: 10.7326/0003-4819-157-1-201206190-00429.
- Rafiee MH, Kafiabad SA, Maghsudlu M. Analysis of blood donors’ characteristics and deferrals related to COVID-19 in Iran. Transfus Apher Sci. 2021;60(2):103049. doi: 10.1016/j.transci.2020.103049.
- Routray SS, Ray GK, Prakash S, et al. Impact of COVID-19 on blood donor deferral patterns during the COVID-19 pandemic: a retrospective analysis. Vox Sang. 2022;117(5):656–663. doi: 10.1111/vox.13240.
- Shander A, Goobie SM, Warner MA, et al. Essential role of patient blood management in a pandemic: a call for action. Anesth Analg. 2020;131(1):74–85. doi: 10.1213/ane.0000000000004844.
- Chen R, Li L, Xiang Z, et al. Association of iron supplementation with risk of transfusion, hospital length of stay, and mortality in geriatric patients undergoing hip fracture surgeries: a meta-analysis. Eur Geriatr Med. 2021;12(1):5–15. doi: 10.1007/s41999-020-00366-3.
- Blanco Rubio N, Llorens Eizaguerri M, Seral García B, et al. [Preoperative intravenous iron as a strategy for blood saving in surgery for hip fracture]. Med Clin (Barc). 2013;141(9):371–375. Hierro intravenoso preoperatorio como estrategia de ahorro de sangre en cirugía de fractura de cadera doi: 10.1016/j.medcli.2012.09.029.
- Cho BC, Serini J, Zorrilla-Vaca A, et al. Impact of preoperative erythropoietin on allogeneic blood transfusions in surgical patients: results from a systematic review and meta-analysis. Anesth Analg. 2019;128(5):981–992. doi: 10.1213/ane.0000000000004005.
- Rineau E, Chaudet A, Chassier C, et al. Implementing a blood management protocol during the entire perioperative period allows a reduction in transfusion rate in major orthopedic surgery: a before-after study. Transfusion. 2016;56(3):673–681. doi: 10.1111/trf.13468.
- Polanco-García M, Capielo AM, Miret X, et al. Effectiveness of a patient blood management protocol on reduction of allogeneic red blood cell transfusions in orthopedic surgery. Med Clin (Barc). 2019;152(3):90–97. Efectividad de un protocolo de ahorro de transfusión en la disminución de consumo de hematíes en cirugía protésica doi: 10.1016/j.medcli.2018.04.021.
- Dillon MF, Collins D, Rice J, et al. Preoperative characteristics identify patients with hip fractures at risk of transfusion. Clin Orthop Relat Res. 2005;439(&NA):201–206. doi: 10.1097/01.blo.0000173253.59827.7b.
- Bian FC, Cheng XK, An YS. Preoperative risk factors for postoperative blood transfusion after hip fracture surgery: establishment of a nomogram. J Orthop Surg Res. 2021;16(1):406. doi: 10.1186/s13018-021-02557-5.
- Adunsky A, Lichtenstein A, Mizrahi E, et al. Blood transfusion requirements in elderly hip fracture patients. Arch Gerontol Geriatr. 2003;36(1):75–81. doi: 10.1016/s0167-4943(02)00059-6.
- Desai SJ, Wood KS, Marsh J, et al. Factors affecting transfusion requirement after hip fracture: can we reduce the need for blood? Can J Surg. 2014;57(5):342–348. doi: 10.1503/cjs.030413.
- Morris R, Rethnam U, Russ B, et al. Assessing the impact of fracture pattern on transfusion requirements in hip fractures. Eur J Trauma Emerg Surg. 2017;43(3):337–342. doi: 10.1007/s00068-016-0655-8.
- Shokoohi A, Stanworth S, Mistry D, et al. The risks of red cell transfusion for hip fracture surgery in the elderly. Vox Sang. 2012;103(3):223–230. doi: 10.1111/j.1423-0410.2012.01606.x.
- Wang Z, Chen X, Chen Y, et al. Low serum calcium is associated with perioperative blood loss and transfusion rate in elderly patients with hip fracture: a retrospective study. BMC Musculoskelet Disord. 2021;22(1):1025. doi: 10.1186/s12891-021-04914-1.
- Magnotti LJ, Bradburn EH, Webb DL, et al. Admission ionized calcium levels predict the need for multiple transfusions: a prospective study of 591 critically ill trauma patients. J Trauma. 2011;70(2):391. discussion 395-7. doi: 10.1097/TA.0b013e31820b5d98.
- Vivien B, Langeron O, Morell E, et al. Early hypocalcemia in severe trauma. Crit Care Med. 2005;33(9):1946–1952. doi: 10.1097/01.ccm.0000171840.01892.36.
- Wray JP, Bridwell RE, Schauer SG, et al. The diamond of death: hypocalcemia in trauma and resuscitation. Am J Emerg Med. 2021;41:104–109. doi: 10.1016/j.ajem.2020.12.065.
- Grandone E, Mastroianno M, De Laurenzo A, et al. Mortality and clinical outcome of italian patients undergoing orthopaedic surgery: effect of peri-operative blood transfusion. Blood Transfus. 2021;19(4):284–291. doi: 10.2450/2020.0059-20.
- Zhang Z, Chen L, Xu P, et al. Predictive analytics with ensemble modeling in laparoscopic surgery: a technical note. Laparoscopic, Endoscopic and Robotic Surgery. 2022;/03/01/20225(1):25–34. doi: 10.1016/j.lers.2021.12.003.
- Riley RD, Ensor J, Snell KIE, et al. Calculating the sample size required for developing a clinical prediction model. BMJ. 2020;368:m441. doi: 10.1136/bmj.m441.
- Peduzzi P, Concato J, Feinstein AR, et al. Importance of events per independent variable in proportional hazards regression analysis. II. Accuracy and precision of regression estimates. J Clin Epidemiol. 1995;48(12):1503–1510. doi: 10.1016/0895-4356(95)00048-8.
- Concato J, Peduzzi P, Holford TR, et al. Importance of events per independent variable in proportional hazards analysis. I. Background, goals, and general strategy. J Clin Epidemiol. 1995;48(12):1495–1501. doi: 10.1016/0895-4356(95)00510-2.