Abstract
Background. Insulin resistance (IR) is frequently observed in patients with coronary artery disease (CAD).
Aim. To examine the association between IR and severity and extent of CAD.
Methods. Quantitative coronary angiography (QCA) was used to assess coronary atherosclerosis in 107 patients with clinically suspected CAD. QCA‐derived indexes reflecting CAD severity, extent, and overall atheroma burden were calculated for the entire coronary tree, and separately for different coronary segments. IR was quantified using the homeostasis model assessment insulin resistance index (HOMA IR). Nondiabetic subjects (n = 83) were divided into group 1 (n = 41) with HOMA IR <1.8 (the median value), and group 2 (n = 42) with HOMA IR ⩾1.8. Group 3 comprised diabetic subjects (n = 24).
Results. Global age‐ and gender‐adjusted indexes for severity (P = 0.007), extent (P = 0.038), and atheroma burden (P = 0.035) of CAD were higher in group 2 than in group 1. Similarly, the global severity (P = 0.027), extent (P = 0.090), and global atheroma burden (P = 0.024) indexes were higher in group 3 compared with group 1. IR was correlated with quantitative angiographic indexes for distal segments only, but not for proximal or mid segments of coronary vessels.
Conclusions. Patients with more severe degree of IR have a more severe, extensive, and distal type of CAD than patients with lower degree of IR.
| Abbreviations | ||
| BMI | = | body mass index |
| CAD | = | coronary artery disease |
| DM | = | diabetes mellitus |
| HDL | = | high‐density lipoprotein |
| HOMA | = | IR, the homeostasis model assessment insulin resistance index |
| IR | = | insulin resistance |
| LDL | = | low‐density lipoprotein |
| OGTT | = | oral glucose tolerance test |
| QCA | = | quantitative coronary angiography |
Introduction
Diabetes mellitus (DM) is well recognized as an important risk factor for coronary artery disease (CAD). Insulin resistance (IR), characterized by a diminished response to the biological effects of insulin, is a strong predictor of type 2 DM Citation1. In addition, IR has been associated with obesity, predominantly intra‐abdominal distribution of fat, hypertension, low high‐density lipoprotein (HDL) cholesterol, and hypertriglyceridemia, all of which are well known risk factors for CAD Citation2,3. Given that IR is related to cardiovascular risk factors, it seems reasonable to believe that IR should be strongly related to cardiovascular disease. In fact, some Citation4,5, but not all studies Citation6,7 have shown a positive association of IR with CAD. There are some reports available regarding the association between IR and the severity of CAD based on visual estimation of coronary angiograms Citation8–11.
The homeostasis model assessment insulin resistance index (HOMA IR) estimates insulin sensitivity and β‐cell function from fasting plasma insulin and glucose concentrations. HOMA IR has been shown to provide a reasonable estimate of peripheral tissue sensitivity to insulin, and it is widely used in clinical and epidemiological research Citation12.
Quantitative coronary angiography (QCA) was developed to overcome the limitations of visual interpretation of coronary angiograms. There is, however, limited information available about the connection between IR and the severity and extent of CAD estimated by QCA Citation13,14.
The present study was, therefore, undertaken to investigate, in a Finnish cohort of patients with clinically suspected CAD, the association between IR and anatomic distribution of coronary atheroma based on a computer‐assisted analysis of coronary angiograms.
Key messages
Disturbances in glucose metabolism play a pivotal role in pathogenesis of coronary atherosclerosis.
Insulin resistance is associated with an increased severity and extent of coronary atherosclerosis.
Insulin resistance is a stronger predictor of coronary atherosclerosis in the distal parts of the coronary tree than in the proximal and mid parts.
Methods
Study population
The study comprised 107 patients who underwent elective coronary angiography for evaluation of clinically suspected CAD at the Helsinki University Central Hospital in Finland. Patients with a history of coronary artery bypass grafting, percutaneous coronary intervention, and those with insulin‐dependent DM or significant renal failure (serum creatinine >150 µmol/L) were excluded. Written informed consent was obtained from all participants, and the study design was approved by the institutional ethics committee.
Quantitative analysis of coronary angiograms
Coronary angiography was performed by standard angiographic techniques and the angiograms were analyzed using third‐generation software, Cardiovascular Measurement System (QCA‐CMS) version 3.0 (Medis, Nuenen, the Netherlands). All QCA analyses were carried out by one investigator (MG). The QCA‐derived parameters were integrated into indexes, as reported elsewhere in detail Citation15. Briefly, the severity of CAD was defined as an average of the most severe percent diameter stenoses in the left main, the left anterior descending, the left circumflex, and the right coronary arteries. The extent index was calculated as the longitudinal percentage of coronary segments involved in stenoses [100×Σ(stenosis lengths)/Σ(segment lengths)). Based on plaque area (expressed in square millimeters], representing the QCA‐derived two‐dimensional projection of atheroma volume, and reflecting both severity and extent, the atheroma burden index was calculated as 100×Σ(plaque areas)/Σ(segment lengths). These three indexes were calculated for the entire coronary tree of each patient (global) and separately for the proximal, mid, and distal segments.
Biochemical investigations
Blood samples were collected one month after coronary angiography and after an overnight fast for analysis of total cholesterol, triglycerides, HDL cholesterol, LDL cholesterol, concentrations of apolipoproteins A‐I, A‐II, B (apoA‐I, apoA‐II, apoB), lipoprotein A‐I (LpA‐I), and lipoprotein A‐I/A‐II particles (LpA‐I/A‐II) Citation16,17. LDL peak particle diameter (LDL particle size) was determined using native gradient gel electrophoresis Citation18.
To avoid bias caused by medications, patients were requested to abstain from any lipid‐lowering drugs between the time of angiography and blood sampling; only highly cardioselective β‐blockers (mainly bisoprolol) were permitted.
Assessment of insulin resistance
All subjects underwent a 75‐g standard oral glucose tolerance test (OGTT) with specimens collected before, and 60 minutes and 120 minutes after loading for determination of plasma glucose and serum insulin concentrations. Fasting and postload glucose were measured by the hexokinase method (Roche Diagnostic Gluco‐quant) using either a Hitachi 917 or a Modular analyzer (Hitachi Ltd, Tokyo, Japan). Serum insulin concentrations were determined by double‐antibody radioimmunoassay (Pharmacia RIA kit, Pharmacia, Uppsala, Sweden) after precipitation with polyethylene glycol. Patients with a previously diagnosed DM or with fasting plasma glucose ⩾7 mmol/L or 2‐h plasma glucose ⩾11.1 mmol/L were classified as diabetic Citation19. We applied the HOMA IR in nondiabetic subjects (n = 83) using the following formula: HOMA IR = fasting insulin (mU/L)×fasting glucose (mmol/L)/22.5 Citation12.
Demographic variables
Hypertension was defined as current use of antihypertensive drugs. The patients were classified either as nonsmokers or as past or present smokers. The body mass index (BMI) was calculated by dividing weight in kilograms by height in meters squared (kg/m2). The waist circumference was used as a measure of intra‐abdominal fat deposition.
Statistical analyses
All statistical analyses were performed with SPSS 11.5 for Windows (SPSS Inc., Chicago, IL, USA). The subjects were categorized into three groups. Nondiabetic subjects (n = 83) were divided into group 1 (n = 41) with HOMA IR <1.8 (the median value), and group 2 (n = 42) with HOMA IR ⩾1.8. Diabetic subjects comprised group 3 (n = 24).
Data are presented as frequencies or percentages for categorical variables, as means±SD for normally distributed continuous variables, and as medians (interquartile ranges) for skewed variables. Normality of continuous variables was checked by the Kolmogorov‐Smirnov test. Logarithmic transformation of variables with skewed distribution was done before any statistical analyses. The values in text, tables, and figures are presented nontransformed. Between‐group differences were examined by one‐way analysis of variance followed by the Bonferroni post hoc test. Categorical data were compared by the chi‐square test. Analysis of covariance was applied to compare the means of the QCA‐derived indexes between groups with adjustment for age and gender. Levene's test was used to assess homogeneity of variances. Multivariate linear regression analysis was performed to assess predictors of global percent diameter stenosis index in the nondiabetic subjects (n = 83). To adjust for confounding, age and sex were included in the model. Moreover, we included the following variables linked to cardiovascular risk or IR: hypertension, smoking, triglycerides, waist circumference, LDL and HDL cholesterol. A P‐value <0.05 was considered significant.
Results
Baseline characteristics
Demographic and clinical characteristics of the study groups are presented in . Patients in groups 2 and 3 had higher BMI, waist circumference, and were more likely to be hypertensive compared with group 1.
Table I. Demographic and clinical characteristics of the study population (n = 107).
Biochemical and other study variables
Total cholesterol, LDL cholesterol, and apoB levels were similar among the three groups. Subjects in groups 2 and 3 had lower HDL cholesterol and apoA‐I levels than subjects in group 1. The triglyceride level did not differ significantly between the groups. LDL particle size was smaller in group 3 compared with group 1 ().
Table II. Biochemical characteristics and other study variables.
Insulin resistance and severity and extent of CAD
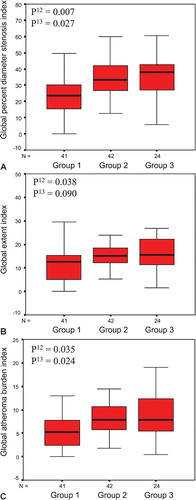
The age‐ and gender‐adjusted QCA‐derived global indexes for the severity, extent, and overall atheroma burden of CAD were significantly higher in group 2 than in group 1. Similarly, the global severity, extent, and atheroma burden indexes were higher in group 3 compared with group 1 ().
Figure 1. Box plots showing median(horizontal lines), 25th to 75th percentiles (boxes), and 95th percentiles (whiskers) in the different groups by global percent diameter stenosis index (A), global extent index (B), and global atheroma burden index (C), respectively. P12 value indicates comparison between group 1 (HOMA IR <1.8) and group 2 (HOMA IR ⩾1.8) and P13 value between group 1 (HOMA IR <1.8) and group 3 (diabetic subjects). P‐values from analysis of covariance with adjustment for age and gender. For definition of indexes, see Methods.
We found heterogeneity in associations between IR and CAD indexes according to the anatomical location of CAD. Compared with group 1, individuals in group 2 had more severe and extensive CAD in distal segments only, but not in the left main coronary artery, proximal, or mid coronary segments. Similar results were seen when group 3 was compared with group 1 ().
Table III. Quantitative coronary angiography results.
As outlined in , factors independently correlated with the global percent diameter stenosis index were gender, HOMA IR group, and to a lesser degree waist circumference. Together, these factors explained 29.7% of the severity of CAD. Age, hypertension, smoking status, triglycerides, and HDL and LDL cholesterols did not reach statistical significance in this model.
Table IV. Multivariate regression model of global percent diameter stenosis index.
Discussion
This study showed, in a cohort of patients undergoing elective coronary angiography, that IR, expressed as HOMA IR, was associated with quantitative angiographic indexes of severity, extent, and overall atheroma burden of CAD. In addition, IR seemed to be a stronger predictor of coronary atherosclerosis in the distal parts of the coronary tree than in the proximal and mid parts. In the multivariate analysis IR was a significant predictor of the severity of CAD.
The euglycemic hyperinsulinemic clamp technique has been regarded as the reference method for evaluating IR. However, this method is expensive, technically complex, and therefore unsuitable in clinical practice. In the present study the HOMA model was chosen because it is a widely used surrogate measure of IR. The HOMA method derives an estimate of insulin sensitivity from the mathematical modeling of fasting glucose and insulin concentrations Citation12. In comparison with the euglycemic clamp, the HOMA model is an easy, practical, and inexpensive method for assessing IR. The HOMA model has been shown to correlate moderately well with insulin sensitivity as measured using the euglycemic clamp technique Citation12. However, HOMA IR has been reported to reflect more closely hepatic IR than peripheral glucose uptake Citation20. Of note, hepatic IR can coexist with fatty liver and excess secretions of substances correlated with cardiovascular risk, such as very low‐density lipoprotein, C‐reactive protein, and antifibrinolytic and coagulation factors Citation21.
There is some information available about the association between IR and the characteristics of coronary atherosclerosis estimated by conventional visional interpretation of coronary angiography. Bressler and co‐workers Citation8 concluded in a small study comprising 13 normal glucose‐tolerant subjects that IR, as measured by the clamp technique, was positively correlated with the severity of CAD. Sasso et al. Citation9 showed that, in 234 men with normal glucose tolerance, the number of stenosed coronary vessels was correlated with HOMA IR. Moreover, Yanase and colleagues Citation10 reported that HOMA IR was an independent risk factor of a new cardiovascular event in patients with prior CAD and normal glucose tolerance. Conversely, Satoh et al. Citation11 did not find a significant relationship between HOMA IR and the number of diseased coronary arteries.
To our knowledge, only two studies have investigated the relationship between IR and coronary atherosclerosis utilizing quantitative imaging techniques. Korpilahti et al. Citation13 showed that, in a 5‐year follow‐up study of 228 coronary artery bypass surgery patients, IR determined as the insulin sensitivity index was associated with both progression of preoperative atherosclerotic lesions and development of new lesions. In studying a cohort of 95 nondiabetic Japanese subjects with CAD verified with semiquantitative coronary angiography, Tsuchihashi et al. Citation14 found that hyperinsulinemia was an important risk factor for CAD explaining the severity of coronary atherosclerosis.
Our study confirms these previous findings and extends them as: 1) our study population included men and women; 2) we encompassed a wide array of disease severity, ranging from angiographically normal coronaries to widespread CAD requiring bypass surgery; 3) our study comprised CAD patients with normal and abnormal responses to a 75‐g OGTT; 4) we used detailed computer‐assisted scoring of CAD; and 5) we found a positive relationship between age‐ and gender‐adjusted severity of IR and coronary atherosclerosis. In fact, nondiabetic subjects with a HOMA IR score above the upper median level of 1.8 were comparable with diabetic subjects in terms of severity and extent of CAD.
Consistent with other reports we found that, besides having a more severe and extensive CAD, type 2 diabetic patients more frequently had lesions located on distal arteries than nondiabetic patients Citation22,23. In addition our data show that even nondiabetic subjects with a more severe degree of IR had a more distal type of CAD compared with individuals with a lower degree of IR. To the best of our knowledge, this has not been previously published.
The process of lesion formation in CAD is complex. Endothelial dysfunction, an imbalance between endothelium‐derived vasodilative (e.g. nitric oxide) and vasoconstrictive (e.g. endothelin‐1) factors, is regarded as an early pivotal event in atherogenesis and cardiovascular disease, and is closely linked to obesity and IR Citation24. In addition, obesity, IR, and endothelial dysfunction coexist, and they can all be identified in individuals with type 2 DM as well as in various groups at risk for type 2 DM, such as in individuals with impaired glucose tolerance, family history of type 2 DM, hypertension and dyslipidemia Citation25. Recently, Prior and co‐workers Citation26 demonstrated that, even in the absence of traditional coronary risk factors, the greatest loss in nitric‐oxide‐mediated, endothelium‐dependent flow occurred when IR was the only abnormality, and this seemed to worsen progressively with more severe states of IR.
During the development of coronary atherosclerosis, compensatory arterial enlargement preserves the intraluminal space and delays clinically important lumen stenosis Citation27,28. The mechanism for compensatory enlargement is thought to be predominantly mediated by the vascular endothelium in response to changes in the hemodynamic, shear‐stress, and humoral changes in the vessel lumen Citation29. This coronary artery remodeling has been shown to be inadequate or negative in diabetic patients Citation30,31. Arterial remodeling, however, is not a homogeneous process within the vessel wall. Interestingly, Nishioka et al. Citation32 reported that, despite a similar degree of luminal narrowings, the proximal coronary segments showed more prominent compensatory enlargement than the distal arterial segments. Recently, Fischer et al. Citation33 found that, in families with myocardial infarction, coronary artery stenoses are particularly heritable at proximal localizations, whereas no heritability was found for distal disease. In our study the reason for a different impact of IR on anatomic characteristics of coronary atherosclerosis remains unclear, but our results support a regional heterogeneity in remodeling responses.
Study limitations
The present study was only of moderate size, however, comparatively homogenous, comprising patients referred for coronary angiography. In addition, a high percentage of patients was already receiving medical treatment for traditional CAD risk factors, which may have overshadowed the relationship between IR and the severity and extent of CAD. On the other hand, all patients were rigorously characterized for coronary angiographic phenotype. Furthermore, this study has by nature a cross‐sectional design showing factors associated with CAD. Thus, it is not possible to draw definite conclusions regarding independent risk factors for CAD.
Conclusions
We observed, in subjects with clinically suspected CAD, that IR is associated with an increased severity and extent of coronary atherosclerosis. This relationship appeared to be more prominent in distal coronary segments. Our results suggest that disturbances in glucose metabolism play a pivotal role in pathogenesis of coronary atherosclerosis. In view of our results, it seems appropriate to intensify efforts to identify insulin‐resistant individuals so that efficient treatment strategies can be directed to lower their risk of CAD and to delay the onset of type 2 DM.
Conflict of interests
Dr Taskinen has received honoraria and consulting fees from Merck Sharp and Dome, Pfizer, Laboratoires Fournier, GlaxoSmithKline, Bristol‐Myers Squibb, Takeda, Sanofi‐Aventis, and research support from Laboratoires Fournier, Eli Lilly, and Novartis.
Acknowledgements
This work was supported by grants from Helsinki University Central Hospital Research Foundation, the Finnish Foundation for Cardiovascular Research, the Aarne Koskelo Foundation, and the Wilhelm and Else Stockmann Foundation.
The authors thank Tina Svahn, Hannele Hildén, and Helinä Perttunen‐Nio for their excellent technical assistance.
References
- Lillioja S., Mott D. M., Spraul M., Ferraro R., Foley J. E., Ravussin E., et al. Insulin resistance and insulin secretory dysfunction as precursors of non‐insulin‐dependent diabetes mellitus: prospective studies of Pima Indians. N Engl J Med 1993; 329: 1988–92
- Reaven G. M. Banting Lecture 188. Role of insulin resistance in human disease. Diabetes 1988; 37: 1595–607
- DeFronzo R. A., Ferrannini E. Insulin resistance: A multifaceted syndrome responsible for NIDDM, obesity, hypertension, dyslipidemia, and atherosclerotic cardiovascular disease. Diabetes Care 1991; 14: 173–94
- Howard G., O'Leary D. H., Zaccaro D., Haffner S., Rewers H., Hamman R., et al. Insulin sensitivity and atherosclerosis. The Insulin Resistance Atherosclerosis Study (IRAS) Investigators. Circulation 1996; 93: 1809–17
- Despres J. P., Lamarche B., Mauriege P., Cantin B., Dagenais G. R., Moorjani S., et al. Hyperinsulinemia as an independent risk factor for ischemic heart disease. N Engl J Med 1996; 334: 952–7
- Welin L., Eriksson H., Larsson B., Ohlson L. O., Svardsudd K., Tibblin G. Hyperinsulinaemia is not a major coronary risk factor in elderly men: The study of men born in 1913. Diabetologia 1992; 35: 766–70
- Ferrara A., Barrett‐Connor E. L., Edelstein S. L. Hyperinsulinemia does not increase the risk of fatal cardiovascular disease in elderly men or women without diabetes: the Rancho Bernardo Study. Diabetologia 1992; 35: 766–70
- Bressler P., Bailey S. R., Matsuda M., DeFronzo R. A. Insulin resistance and coronary artery disease. Diabetologia 1996; 39: 1345–50
- Sasso F. C., Carbonara O., Nasti R., Campana B., Marfella R., Torella., et al. Glucose metabolism and coronary heart disease in patients with normal glucose tolerance. JAMA 2004; 291: 1857–63
- Yanase M., Takatsu F., Tagawa T., Kato T., Arai K., Koyasu M., et al. Insulin resistance and fasting hyperinsulinemia are risk factors for new cardiovascular events in patients with prior coronary artery disease and normal glucose tolerance. Circ J 2004; 68: 47–52
- Satoh H., Terada H., Uehara A., Katoh H., Matsunaga M., Yamazaki K., et al. Post‐challenge hyperinsulinemia rather than hyperglycemia is associated with the severity of coronary artery disease in patients without a previous diagnosis of diabetes mellitus. Heart 2005; 91: 731–6
- Wallace T. M., Levy J. C., Matthews D. R. Use and abuse of HOMA modeling. Diabetes Care 2004; 27: 1487–95
- Korpilahti K., Syvanne M., Engblom E., Hamalainen H., Puukka P., Ronnemaa T. Components of the insulin resistance syndrome are associated with progression of atherosclerosis in non‐grafted arteries 5 years later after coronary artery bypass surgery. Eur Heart J 1998; 19: 711–9
- Tsuchihashi K., Hikita N., Hase M., Agata J., Saitoh S., Nakata T., et al. Role of hyperinsulinemia in atherosclerotic coronary arterial disease: studies of semi‐quantitative coronary angiography. Intern Med 1999; 38: 691–7
- Pajunen P., Nieminen M. S., Taskinen M. R., Syvänne M. Quantitative comparison of angiographic characteristics of coronary artery disease in patients with noninsulin‐dependent diabetes mellitus compared with matched nondiabetic control subjects. Am J Cardiol 1997; 80: 550–6
- Taskinen M. R., Kuusi T., Helve E., Nikkila E. A., Yki‐Järvinen H. Insulin therapy induces antiatherogenic changes of serum lipoproteins in noninsulin‐dependent diabetes. Arteriosclerosis 1988; 8: 168–77
- Parra H. J., Mezdour H., Ghalim N., Bard J. M., Fruchart J. C. Differential electroimmunoassay of human LpA‐I lipoprotein particles on ready‐to use plates. Clin Chem 1990; 36: 1431–5
- Vakkilainen J., Jauhiainen M., Ylitalo K., Nuotio I. O., Viikari J. S., Ehnholm C., et al. LDL particle size in familial combined hyperlipidemia: effects of serum lipids, lipoprotein‐modifying enzymes, and lipid transfer proteins. J Lipid Res 2002; 43: 598–603
- World Health Organization. World Health Organization, Geneva 1999, Definition, diagnosis and classification of diabetes mellitus and its complications. Report of a WHO consultation. Part 1: diagnosis and classification of diabetes mellitus. WHO/NCD/NCS/99.2
- Tripathy D., Almgren P., Tuomi T., Groop L. Contribution of insulin‐stimulated glucose uptake and basal hepatic insulin sensitivity to surrogate measures of insulin sensitivity. Diabetes Care 2004; 27: 2204–10
- Yki‐Järvinen H. Fat in the liver and insulin resistance. Ann Med 2005; 37: 347–56
- Henry P., Makowski S., Richard P., Beverelli F., Casanova S., Louali A., et al. Increased incidence of moderate stenosis among patients with diabetes: substrate for myocardial infarction?. Am Heart J 1997; 134: 1037–43
- Thomas C. S., Cherian G., Hayat N., Varma L. K. Angiographic comparison of coronary artery disease in Arab women with and without type II diabetes mellitus. Med Princ Pract 2002; 11(Suppl 2)63–8
- Steinberg H. O., Chaker H., Leaming R., Johnson A., Brechtel G., Baron A. Obesity/insulin resistance is associated with endothelial function. J Clin Invest 1996; 97: 2601–10
- Caballero A. E. Endothelial dysfunction in obesity and insulin resistance: a road to diabetes and heart disease. Obesity Res 2003; 11: 1278–89
- Prior J. O., Quinones M. J., Hernandez‐Pampaloni M., Facta A. D., Schindler T. H., Sayre J. W., et al. Coronary circulatory dysfunction in insulin resistance, impaired glucose tolerance, and type 2 diabetes mellitus. Circulation 2005; 111: 2291–8
- Glagov S. G., Weisenberg E., Zarins C. K., Stankunavicius R., Kolettis G. J. Compensatory enlargement of human atherosclerotic coronary arteries. N Engl J Med 1987; 316: 1371–5
- Stiel G. M., Stiel L. S. G., Schofer J., Donath K., Mathey D. G. Impact of compensatory enlargement of atherosclerotic coronary arteries on angiographic assessment of coronary heart disease. Circulation 1989; 80: 1603–9
- Gibbons G. H., Dzau V. J. The emerging concept of vascular remodeling. N Engl J Med 1994; 330: 1431–8
- Vavuranakis M., Stefanadis C., Toutouzas K., Pitsavos C., Spanos V., Toutouzas P. Impaired compensatory artery enlargement in atherosclerosis contributes to the development of coronary artery stenosis in diabetic patients. An in vivo intravascular ultrasound study. Eur Heart J 1997; 18: 1090–4
- Kornowski R., Mintz G. S., Lansky A. J., Hong M. K., Kent K. M., Pichard A. D., et al. Paradoxic decreases in atherosclerotic plaque mass in insulin‐treated diabetic patients. Am J Cardiol 1998; 81: 1298–304
- Nishioka T., Nagai T., Luo H., Kitamura K., Hakamata N., Katsushika S., et al. Coronary remodeling of proximal and distal stenotic atherosclerotic plaques within the same artery by intravascular ultrasound study. Am J Cardiol 2001; 87: 387–91
- Fischer M., Broeckel U., Holmer S., Baessler A., Hengstenberg C., Mayer B., et al. Distinct heritable patterns of angiographic coronary artery disease in families with myocardial infarction. Circulation 2005; 111: 855–62