Abstract
Aim. The differentiation efficiencies of human embryonic stem cell (hESC) lines differ from each other. To assess this in more detail we studied the cardiac differentiation of eight hESC lines derived in the same laboratory.
Results. Substantial variation in growth and in the ability to form beating areas was seen between the different hESC lines; line HS346 gave the best efficiency (9.4%), while HS293 did not differentiate into beating colonies at all. Nine germ layer and differentiation markers were quantified during early differentiation in four hESC lines. The expression levels of Brachyury T, MESP1 and NKX2.5 were highest in the most efficient cardiac line (HS346). A systematic characterization of the beating cells revealed proper cardiac marker expression, electrophysiological activity, and pharmacological response.
Conclusions. The hESC lines derived in the same laboratory varied considerably in their potential to differentiate into beating cardiomyocytes. None of the expression markers could clearly predict cardiac differentiation potential, although the expression of early cardiomyogenic genes was upregulated in the best cardiac line. The proper cardiomyocyte characteristics and pharmacological response indicate that these cells could be used as a model for human cardiomyocytes in pharmacological and toxicological analyses when investigating new heart medications or cardiac side-effects.
Introduction
Advancements in stem cell research have introduced new potential tools for pharmacological and toxicological studies as well as raised hopes for new treatments for diseases resulting from tissue damage in organs that have a limited capacity for self-renewal. The first permanent human embryonic stem cell (hESC) line was derived in 1998 Citation[1]. Since then many hESC lines have been established, and culture systems have been developed Citation[2]. All hESC lines express pluripotent markers and have the ability to self-renew and differentiate into all three germ layers Citation[3]. However, there are also differences in the growth rate, genotype, and gene expression patterns, as well as in the differentiation capacity of different hESC lines Citation[4–8].
Cardiomyocyte differentiation is mostly achieved through spontaneous differentiation as embryoid bodies (EB) Citation[9]. Another method is to co-culture hESC with a mouse visceral endodermal cell line (END-2) Citation[10]. The reported cardiac differentiation efficiencies of the hESC lines vary markedly, but usually only one line has been used for subsequent studies.
Key messages
Human embryonic stem cell lines derived in the same laboratory vary considerably in their potential to differentiate into beating cardiomyocytes.
Differentiated cardiomyocytes obtained in a co-culture with END-2 (mouse visceral endodermal cell line) cells express proper markers for human cardiac cells.
Human embryonic stem cell-derived cardiomyocytes have properly functioning L-type Ca2 + channels and a β-adrenoreceptor system indicating that these cells could be used as a cell model for pharmacological studies.
Feeder cells, culturing media, and passaging methods and number have been suggested as reasons for the observed variation in differentiation capacities Citation[11]; also genetic and epigenetic variation between hESC lines could influence differentiation Citation[12]. In order to better understand the biology and differentiation potential of hESCs, more lines should be studied in a systematic way. In addition, to design more efficient cardiomyocyte differentiation protocols it is important to develop a screening method for identifying hESC lines with good differentiation potential.
Abbreviations
In this study we have systematically compared the cardiac differentiation of eight hESC lines: HS181, HS237, HS293, HS346, HS360, HS362, HS368, and HS401. Differentiation was induced by the END-2 co-culture method. We then further analyzed the germ layer and differentiation marker expression levels during early differentiation in four hESC lines with either good, intermediate, or poor cardiac differentiation potential. In addition, differentiated beating cells were characterized in detail by molecular biological and electrophysiological methods. For supplementary material please see online version, http://www.informaworld.com/10.1080/07853890802609542.
Materials and methods
Cell culture
Eight hESC lines, HS181, HS237, HS293, HS346, HS360, HS362, HS368, and HS401 (), derived at the Fertility Unit of Karolinska University Hospital, Huddinge (Karolinska Institutet, Stockholm, Sweden) were used in this study. The derivation team had approval from the Ethics Committee of Karolinska Institutet for the derivation, characterization, and differentiation of hESC lines. REGEA, Institute of Regenerative Medicine, University of Tampere, Finland, has the support of the Ethical Committee of Pirkanmaa Hospital District to culture hESC lines derived at the Karolinska Institute. The lines were cultured on a feeder cell layer of irradiated human fibroblasts (American Type Culture Collection, Manassas, VA, USA), as previously described Citation[13], Citation[14]. The hESC culture medium consisted of Knockout DMEM (Invitrogen, Carlsbad, CA, USA), 20% serum replacement (SR) (Invitrogen), 2 mM GlutaMax (Invitrogen), 1% non-essential amino acids (Cambrex Bio Science Inc., Walkersville, MD, USA), 50 U/mL penicillin/streptomycin (Cambrex Bio Science Inc.), 0.1 mM 2-mercaptoethanol (Invitrogen), and 8 ng/mL basic fibroblast growth factor (bFGF) (R&D Systems, Minneapolis, MN, USA). Colonies were passaged mechanically on a weekly basis. The undifferentiated state of the colonies was confirmed daily by morphologic analysis, and periodic testing for the expression of the stem cell markers NANOG, POU5F1 (POU class 5 homeobox 1), SSEA4 (stage-specific embryonic antigen 4), and TRA-1-60 (tumor rejection antigen-1-60) was carried out. The differentiation ability of the lines has been tested in vivo and in vitro.
Table I. Comparison of differentiation in human embryonic stem cell lines.
Differentiation of cardiomyocytes
Cardiomyocyte differentiation was carried out by co-culturing hESC with mouse visceral endodermal-like (END-2) cells, which were a kind gift from Professor Mummery, Humbrecht Institute, Utrecht, The Netherlands. END-2 cells were cultured as described earlier Citation[15]. To initiate cardiomyocyte differentiation, undifferentiated hESC colonies were dissected mechanically into aggregates containing a few hundred cells and placed on the top of plated END-2 cells in hESC culture medium (described above) without serum, serum replacement, or bFGF Citation[16]. Differentiating cell colonies were monitored by microscopy daily, and the medium was changed after 5 days of culturing. After 8 or 12 days the 10% SR was added to the medium.
Estimation of differentiation efficiency
We cultivated altogether eight different hESC lines and studied their efficiency to form beating areas. The differentiation efficiency was calculated by dividing the number of beating areas by the total number of hESC colony pieces plated on END-2 cells.
Dissociation of beating cells
The beating areas of the cell colonies were first cut with a scalpel and then dissected by collagenase II treatment Citation[10]. Dissociated cells were plated on 0.1% gelatin-coated cover-slips in a medium containing 7.5% fetal bovine serum (FBS).
Assessment of the germ layer markers by quantitative RT-PCR
Quantitative reverse transcriptase polymerase chain reaction (qRT-PCR) was performed according to standard protocols on an Abi Prism 7300 instrument (Applied Biosystems, Foster City, CA, USA). Human embryonic stem cells were co-cultured with END-2 cells on 12-well-plates as described above. All cell aggregates from 4–6 wells were collected at time points of 3 and 6 days after co-culture initiation. Total-RNA was isolated with the RNAeasy mini plus kit including a DNAse treatment (Qiagen, Valencia, CA, USA). The concentration and quality of RNA was monitored spectroscopically (Nanodrop, Wilmington, DE, USA), and 0.2 µg of total RNA was transcribed to cDNA in a total volume of 20 µL. The PCR reaction consisted of 0.25 µL of cDNA, 7.5 µL of 2 × SYBR green PCR mastermix (Applied Biosystems, Foster City, CA, USA) and 200 µM of each primer (Supplementary ).
The expression levels of nine germ layer and differentiation markers were evaluated: Brachyury (T), mesoderm posterior 1 (MESP1), cardiac lineage marker NKX2.5, Islet-1 (ISL-1), bone morphogenic protein-4 (BMP-4), kinase insert domain receptor (KDR), alphafetoprotein (AFP), and SRY sex-determining region Y-box 1 (SOX1) and 17 (SOX17). Peptidyl-prolyl isomerase G (PPIG), which is known to have constant expression in our hESC lines (data not shown), was used as an internal control.
Cτ values were determined for every reaction, and the relative quantification was calculated with the 2-ΔΔCτ method Citation[17]. The data were normalized to the expression of the housekeeping gene PPIG, and the 3-day sample of the line HS346 was used as the calibrator. Two biological replicates from each line were analyzed as triplicates. Results are shown as the average values of both biological replicates.
RT-PCR
Total RNA from beating areas was isolated as described above. The cDNA was synthesized by Sensiscript reverse transcriptase (Qiagen) with 10 µM oligo-dT primers (Fermentas Inc., Burlington, Canada). PCR was performed using Phusion DNA polymerase (Finnzymes, Espoo, Finland) with 0.2 µM of primers (Supplementary ) and 1 µL of cDNA as a template. The amplification program included the initial denaturation step at 98°C for 30 seconds followed by 32 cycles of 10 seconds at 98°C, 30 seconds at 63°C, and 30 seconds at 72°C. Commercial heart RNA (Ambion, Austin, TX, USA) was used as a positive control.
The expression of SOX1, Brachyury T, BMP-4, AFP, and KDR in the undifferentiated hESC was also examined as described above.
Immunocytochemistry and microscopy
Quantification of cardiomyocytes
The percentage of troponin-positive cells versus the total number of cells in the beating aggregates was determined. Beating aggregates were dissociated 10 days after plating on END-2 cells. Immunocytochemistry was performed as previously described Citation[18]. Cells were incubated overnight at +4°C with anti-cardiac troponin T (1:500) (Abcam, Cambridge, UK), and Alexa Fluor 568 (Invitrogen) (1:400) conjugated to an anti-mouse antibody was used as secondary antibody.
The total number of cells was determined by counting the number of 4’,6 diamidino-2-phenylindole (DAPI)-stained nuclei. Cells were counted from multiple areas, which were randomly selected with the 20× magnification.
Characterization of beating cells
Beating areas were either fixed 6 days after plating on END-2 cells, or they were dissociated from co-cultures 14–25 days after plating. Dissociated cells were fixed 4–7 days after dissociation. Immunocytochemical stainings were performed with primary antibodies including anti-ISL-1 (1:500) (Developmental Studies Hybridoma Bank, The University of Iowa, Iowa City, IA, USA), anti-BMP-4 (1:100) (Abcam), anti-Brachyury T (1:100) (Abcam), anti-NKX2.5 (1:300) (Santa Cruz Biotech, CA, USA), α-actinin (Sigma) (1:1500), anti-cardiac troponin T (1:500) (Abcam), α-myosin heavy chain (1:50), anti-cardiac troponin I (1:500), anti-connexin-43 (1:2000), and anti-Ki67 (1:400) (Chemicon Temecula, CA, USA). Secondary antibodies used were either rhodamine red (Jackson ImmunoResearch Laboratories Inc., West Grove, PA) (1:800), or Alexa Fluor 488 or 568 (Invitrogen) (1:400) conjugated to anti-mouse or anti-rabbit antibodies. Omitting the primary antibody from the immunocytochemical protocol resulted in the disappearance of all positive staining.
Electron microscopy and immunoelectron microscopy
For electron microscopy cells were fixed with 2.5% glutaraldehyde overnight and subsequently postfixed with 1% osmium tetroxoide for 1 h. Cells were dehydrated and embedded in Epon. Ultrathin sections were counterstained with 1% uranyl acetate (30 minutes) and with lead citrate (5 minutes). For immunoelectron microscopy 22-day-old cells were fixed with a mixture of 4% paraformaldehyde and 0.2% glutaraldehyde in phosphate-buffered saline solution (PBS) (0.2 M) for 15 minutes. Immunocytochemistry was performed using the ABC method (Vectastain ABC Elite Kit, Vector Laboratories). The cells were incubated overnight with a mouse monoclonal antibody to troponin I (diluted 1:100 in PBS containing 1% bovine serum albumin (BSA) and 0.1% saponin) followed by incubation with a biotinylated sheep anti-mouse antibody (GE Healthcare, Bio-Sciences AB, Uppsala, Sweden) and the ABC complex for 60 minutes each. Diaminobenzidine was used as a chromogen to visualize the sites expressing troponin I immunoreactivity. Cells were postfixed with 2.5% glutaraldehyde (15 minutes) and 1% osmium tetroxide (30 minutes). The samples were dehydrated and embedded in Epon. Ultrathin sections were examined with a Jeol 1200EX electron microscope (Jeol USA, Peabody, MA).
Electrophysiology
Microelectrode array (MEA)
The electrical activity of beating cells from HS346 was monitored using the microelectrode array (MEA) system (Multi Channel Systems MCS GmbH, Reutlingen, Germany). Dissociated cells were plated on FBS and gelatin-coated MEA chambers (type: 500/30iR-Ti), and measurements were made at +37°C. Signals were recorded for 4 minutes via every microelectrode. The sampling frequency was 20 kHz, and the signal frequency band was limited to 1 Hz–8 kHz.
Chronotropic response characterization was performed using dissociated cells from line HS346. Twenty-two-day-old cells were in a MEA chamber for 14 days before the addition of the pharmacological agents. The effect of verapamil, a specific L-type Ca2 + channel blocker (Verpamil, Orion, Espoo, Finland), was tested at a concentration of 2.5 µg/mL. To increase the beating rate, a β-adrenoreceptor system activator, isoprenaline (Isuprel, SA Abbot NW, Ottignies, Belgium), was added (0.017 µg/mL) to the cells. Finally, a cardioselective β-antagonist, esmolol (Breviblock, Baxter Healthcare Group, Deefield, IL, USA) (0 µg/mL, 14.3 µg/mL, or 25.0 µg/mL) was tested without washing off the isoprenaline.
Statistical analysis
The qRT-PCR data are represented as mean values ± standard deviation. For determining statistical significance the one-way ANOVA test and student's t test were used. For the t test, significance was accepted with the P-value <0.05 when two samples were compared. In addition, the Bonferroni correction was used when all four lines were compared and the P-value <0.008 was considered statistically significant.
Results
Cardiomyocyte differentiation
Considerable variation in the differentiation efficiencies between different hESC lines was seen (). Of the hESC lines studied, the most efficient in cardiac differentiation was line HS346 producing on average 9.4% beating areas of all aggregates, whereas cell line HS293 did not differentiate into beating cells at all. Substantial variation in cardiac differentiation within individual lines was also observed, but this variation did not correlate with the passage number. Beating areas were observed from day 6 onwards. After day 20 the number of beating areas did not increase. The average percentage of troponin-positive cells versus the total number of cells in beating aggregates was 13% (range 6%–19%). If the aggregates did not beat, troponin-positive cells could not be identified.
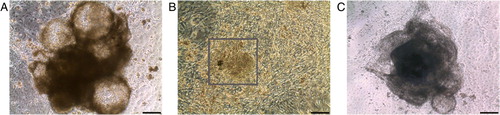
All undifferentiated hESC colonies grew as thick regular-shaped colonies. However, variation in the morphology of differentiating cell aggregates was observed. Most cell lines formed compact three-dimensional structures during differentiation. However, the cell lines HS293 and HS401 with poor or no differentiation into beating cells formed more hollow-like cystic structures compared to other cell lines (Supplementary A). In addition to these three-dimensional beating areas, the hESC lines HS237 and HS346 also formed beating areas that were flat (Supplementary B, C).
Preliminary cultivations were carried out with all eight hESC lines, and four lines were then selected for further studies: HS346 with the best, HS181 and HS368 with intermediate, and HS293 with no cardiac differentiation potential.
Expression of germ layer markers
To investigate the expression of germ layer markers in lines HS181, HS293, HS346, and HS368, the relative expression levels of differentiation and germ layer markers were compared (Brachyury T, MESP1, NKX2.5, ISL-1, BMP-4, KDR, AFP, SOX17, and SOX1). Differentiating cell aggregates were pooled from four or six 12-well-plate wells at time points of 3 and 6 days. For every cell line, two cell pools were collected from distinct differentiation experiments.
The expression of mesoderm marker Brachyury T was upregulated on day 3 and downregulated on day 6 in all four lines (A). The highest expression on day 3 was observed in HS346 when compared to HS293 and HS181 (P < 0.01, t test). The expression of cardiac mesoderm marker MESP1 (B) and Brachyury T had similar expression patterns. In all lines MESP1 expression was higher on day 3 compared to day 6.
Figure 1. Relative gene expression levels for Brachyury T (A), mesoderm posterior 1 (MESP1) (B), cardiac lineage marker NKX2.5 (C), Islet-1 (ISL-1) (D) in HS181, HS293, HS346, and HS368 on days 3 and 6.
In HS346, the NKX2.5 expression increased vastly from day 3 to day 6 (C) and was more than three times higher on day 6 in HS346 compared to the other lines (P < 0.00005, t test). ISL-1, a LIM homeodomain transcription factor reported as a cardiac progenitor marker, behaved differently compared to the other markers reported to associate with cardiac differentiation. On day 3 ISL-1 was significantly more expressed in HS293 than in the other lines (P < 0.0005, t test) (D). The expression of the mesodermal marker BMP-4 increased in all four lines from day 3 to day 6 (Supplementary A). KDR, another mesoderm marker, was decreased in HS181 but also in HS346 (Supplementary B).
AFP expression (Supplementary C) increased significantly from day 3 to day 6 in HS293, HS346, and HS368 (P < 0.05), and the same trend was observed with HS181 cells. The expression of another endodermal marker SOX17 did not differ between the four lines (Supplementary D).
The expression of the ectoderm marker SOX1 was the lowest in HS346, both on day 3 and 6, and highest in HS181 (Supplementary E). There was also a significant difference in the expression of SOX1 between HS293 and HS346 on day 6 (P < 0.05, t test).
To support the gene expression studies, the expression of Brachyury T, BMP-4, ISL-1 and NKX2.5 on day 6 was also studied at the protein level by immunocytochemistry in HS346 and HS293. NKX2.5, BMP-4, and Brachyury gave a more intense staining in HS346 than in HS293. With ISL-1, expression levels were similar in the two lines (data not shown).
Characterization of differentiated beating cells
Immunocytochemistry
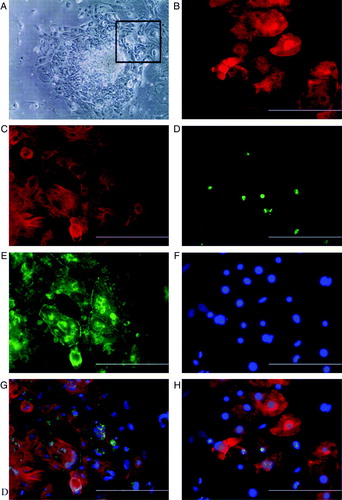
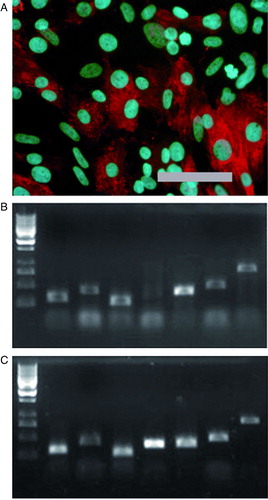
The differentiated cardiac cells stained positively with several cardiac markers, including α-actinin, cardiac troponin T, connexin-43 (), α-myosin heavy chain (Supplementary A), and cardiac troponin I (data not shown). Connexin-43 was localized between the actinin or troponin-positive cells, indicating that the beating cells have gap junctions between them (C, D). According to immunostaining with a Ki67 antibody (a marker for proliferating cells) some of the dissociated cardiomyocytes were in the cell cycle at least 6 days after replating (F).
Figure 2. A: Beating area in an END-2 co-culture plate from HS346. B: Beating cells are troponin T-positive; C: connexin-43 is located in the contact surfaces of beating cells. D: The merged picture of B and C with DAPI (4′,6 diamidino-2-phenylindole) staining. E: Beating cells are also sarcomeric α-actinin-positive. F: Some of the cells are proliferative as shown with Ki67 staining. G: The same cells stained with DAPI (4’,6 diamidino-2-phenylindole). H: The merged picture of E, F, and G. The scale-bar is 200 µm.
Electronmicroscopy
In electronmicroscopy the cardiac cells showed a variable degree of differentiation. In a large number of cells, bundles of myofibrils could be seen. In most of the cells, bundles were randomly distributed; however, in some cells, clearly differentiated sarcomeres with Z lines were seen (Supplementary A). Also intercalated disks were seen between adjacent cells. Cells contained several mitochondria, which were often situated close to sarcomeres, and numerous polyribosomes. Immunoelectron microscopy revealed troponin I immunoreactivity in the myofibrils (Supplementary B). The immunoreactivity was unevenly localized along the myofibrils. Strong immunoreactivity was detected in areas probably representing I bands, while H bands were not labeled.
RT-PCR
Differentiated cells expressed cardiac marker genes such as α-myosin heavy chain, atrial myosin light chain, ventricular myosin light chain, troponin T type 2, GATA-4 (GATA binding protein 4), and connexin-45 at levels comparable to commercial adult heart RNA (Supplementary B-C).
Electrophysiological measurements
Electrical activity was monitored in dissociated beating cells. Beating in the cardiomyocyte culture ceased approximately 2 minutes after the administration of 2.5 µg/mL verapamil (data not shown). Thereafter, the culture was washed with medium, and a re-establishment of consistent beating was observed both visually and electrically. The adding of isoprenaline (0.017 µg/mL) increased the average beating rate (ABR) about 50% (A, a-b) and this effect could be reversed by adding esmolol in a dose-dependent manner (A, c-d). After the measurements, the culture was washed, and the reversibility of the drug effects was confirmed (data not shown). Based on the MEA measurements, we also observed conduction of electrical activation between beating colonies (B, C).
Figure 3. A: A Microelectrode array-recording recording of isoprenaline and esmolol effects. Signal a: no treatment, average beating rate (ABR) 24 beats/min; b: 0.017 µg/mL isoprenaline, ABR 36 beats/min; c: 0.017 µg/mL isoprenaline and 14.3 µg/mL esmolol, ABR 24 beats/min; and d: 0.017 µg/mL isoprenaline and 25.0 µg/mL esmolol, ABR 6 beats/min. With both 0.017 µg/mL isoprenaline and 25.0 µg/mL of esmolol in the medium, clear beating was observed at only one microelectrode, whereas in the other cases beating was recorded via six or seven electrodes. All beat rates differed statistically significantly form each other (P < 0.001), and the beat rates observed during treatment were statistically significantly different from the beat rate without treatment by P < 0.0001, as given by the two-sample t test. B and C: An example of conduction of electrical activation in an HS346-derived cardiomyocyte culture. B: A microscope image of a part of the culture and nine microelectrodes. The inter-electrode distance is 500 µm and electrode diameter 30 µm. C: Single beats recorded via the electrodes a, b, c, and d, marked in B. The electrical activation is conducted from cells near the electrode a, via the vicinity of the electrode b, to cells near the electrodes c and d. The signals seen in A and C were low-pass filtered in Matlab (The MathWorks, Inc., Natick, MA, USA) with a passband end frequency of 100 Hz for plotting.
Discussion
The study presented here is the first to compare the cardiac differentiation potential of several individual hESC lines using the END-2 co-culture method for differentiation. Considerable variation was found between cardiomyocyte differentiation in different hESC lines derived in one laboratory and maintained with similar culturing and passaging methods. Some of the lines were clearly more efficient in forming beating areas than others, but variation in cardiac differentiation potential within individual lines was also observed. One of the hESC lines, HS293, completely lacked the ability to form beating areas.
The differentiation efficiencies of our hESC lines ranged from 0% to 9.4%. Variation in the differentiation potential of individual hESC lines has been reported earlier Citation[6], Citation[19], Citation[20]. Human embryonic stem cell differentiation to cardiomyocytes has been analyzed in many reviews comparing individual studies Citation[21], Citation[22], but usually only one hESC line has been used in a study Citation[23–25]. The cardiac differentiation efficiency in these studies has varied enormously (8.1%–70%). In a recent report on 17 individual hESC lines Citation[26] the variation in cardiac differentiation potential was analyzed by comparing the expression levels of cardiac markers (NKX2.5 and troponin T). The percentage of EBs containing cells positive for either cardiac marker was 10% (for the worst cell line) and 44% (for the best), while the frequency of beating EBs was only 2.9% and 13.6%, respectively Citation[26].
Another study compared the cardiac differentiation of four different hESC lines derived in three different laboratories and maintained with two different passaging methods Citation[12]. The percentage of beating EBs varied between 1.6% and 9.5%, and the authors concluded that the variation was due to derivation in different laboratories Citation[12]. Our results do not confirm this conclusion. All our hESC lines were derived in the same laboratory, and six of them were initiated with the same derivation method Citation[13]. Two of the lines (HS181 and HS237) were derived in FBS but then transferred to serum replacement medium. Culture conditions cannot explain the differences either, since all the cells lines were cultured and passaged identically. It is noteworthy that HS293 and HS346 were derived using exactly the same method but gave the most substantial difference in their cardiac differentiation potential.
The major difference between previous studies and ours is the differentiation method; we induced differentiation in co-culture with END-2 cells as originally described by Mummery et al.Citation[10] who reported the average number of beating areas per 12-well-plate to be 32.7 and corresponding to 16,600 cardiomyocytes. Since the starting number of cells was not stated in their work and since we have not determined the total number of cardiomyocytes in our beating areas, a comparison of results is difficult. It is, however, evident that we could not achieve corresponding differentiation efficiencies. The best differentiation efficiency (HS346) was 9.4% corresponding to 17 beating areas per 12-well-plate. Another major difference between the previous reports and ours is that we have used human fibroblasts as feeders for hESC while others have used mouse embryonic fibroblasts (MEF). However, regardless of the differentiation protocol, our results as well as the previous studies demonstrate a large variation in the differentiation capacity of different hESC lines, which highlights the importance of the cell line used for differentiation studies.
The gender and the karyotype of the hESC line have also been thought to play a role in determining differentiation capacity Citation[7], Citation[20], Citation[25]. A hESC line having an altered karyotype (trisomy 12, 17, and XXX) has been reported to differentiate normally into cardiomyocytes Citation[25], while in another study an altered karyotype was shown to affect differentiation in general Citation[20]. Neither gender nor karyotype can explain our results. We used both XX and XY cell lines with no correlation with cardiac differentiation potential. In addition, the karyotypes of our cell lines have been checked regularly and found to be normal.
Our results support the suggestion that individual cells of the inner cell mass are the most critical factor for the basic differentiation capacity. Mechanical splitting of a single inner cell mass has been reported to produce multiple ESC lines with dissimilar differentiation capacities Citation[27]. Furthermore, two hESC lines have been shown to differ in their gene expression profiles of mesoderm and early cardiac markers at the undifferentiated state, but after cardiac differentiation both expressed cardiac markers and engrafted into mouse myocardium Citation[28]. In our cell lines the basal expression levels of germ layer markers were undetectable or low and did not differ between the lines (data not shown). Thus, our results confirm the previous report that basal germ layer expression levels do not explain the variation in differentiation potential.
The lines used in this study have been analyzed for the expression of pluripotent markers, and they have been seen to differentiate into all germ layers in vitro and in vivo. The morphologies of the undifferentiated colonies of all eight hESC lines were similar. However, when differentiated, cell lines with good or intermediate cardiac differentiation efficiency formed more compact three-dimensional structures on END-2 cells when compared to lines with lower efficiency. This is in line with previous results, as sharp-edged three-dimensional structures have been reported to be favorable for the formation of beating areas Citation[16].
Many transcription factors and other proteins controlling germ layer and cardiac differentiation could serve as markers for identifying cardiac mesoderm and developing cardiomyocytes in a differentiating culture. They could also be useful in studying the kinetics of differentiation. Human embryonic stem cells co-cultured with END-2 cells have been reported to preferentially differentiate towards mesoderm and endoderm derivates Citation[29]. Hence, we hypothesized that the lines, which had a better intrinsic cardiac differentiation capacity, would have higher levels of the endoderm and mesoderm/cardiac mesoderm marker genes expressed during early differentiation. The expression of the mesoderm marker Brachyury T was indeed induced significantly at day 3 in the best cardiac line (HS346) compared to the other lines. A similar trend in expression profile was observed with cardiac mesoderm marker MESP1, although without statistical significance. Brachyury T and MESP1 have earlier been shown to express at their highest levels at day 3, with expression decreasing towards day 6 Citation[26], Citation[30] as was also demonstrated with our lines.
ISL-1 has been suggested to identify a cardiac progenitor population contributing to the majority of the cells in the heart Citation[31]. The expression of ISL-1 was unexpectedly the highest in our worst cardiac line, HS293, on day 3. However, the difference was no longer significant on day 6. It has been shown that ISL-1 expression increases continuously from day 3 to day 12 during END-2 co-culture Citation[29], and thus it is possible that our time-frame was not sufficient to detect the highest levels in ISL-1 expression. The expression of the cardiac lineage marker NKX2.5 increases after 4 days of differentiation Citation[30], and this was clearly observed with our best cardiac line (HS346). Its expression was significantly higher in HS346 on day 6 when compared to the other lines, indicating more efficient cardiac lineage differentiation. It is noteworthy that the expression of NKX2.5 was low not only in the worst cardiac line HS293, but also in the intermediate cardiac lines. Osafune and co-workers reported recently similarly that NKX2.5 expression could not necessarily determine the cardiac differentiation potential of their cell lines Citation[26].
We also analyzed two other mesoderm differentiation markers, KDR and BMP-4, but there was no consistency in their expression patterns with regard to cardiac differentiation capacity. This is not necessarily surprising, since studies in mice have shown that KDR, also known as VEGFR-2 (vascular endothelial growth factor receptor 2) or FLK-1, is expressed on the surface of different progenitor cells that may differentiate not only into cardiac cells but also into vascular and hematopoietic lineages (for review, see Citation[32]).
The levels of endodermal markers, especially AFP, were low in the best cardiac line, HS346, contradictorily to previous findings Citation[29]. This suggests that a higher number of visceral endodermal cells in differentiating hESC is not decisive for more effective cardiomyocyte differentiation, although visceral endoderm is known to have an important regulatory role in cardiac development Citation[33] as the use of END-2 cells indicates.
The ectoderm marker SOX1 Citation[34], Citation[35] was expressed at low levels in both our best (HS346) and worst (HS293) cardiac lines when compared to the two intermediate lines, allowing us to conclude that the differentiation towards ectodermal lineage does not necessarily prevent cardiac differentiation. Nor does it explain the inability of one of our lines to differentiate into cardiac cells.
Cardiomyocytes were connected to each other via gap junctions as demonstrated by the presence of connexin-43 between cells. The striation pattern of the cells could be seen with immunocytochemistry (data not shown) as was also evident from the presence of Z bands as seen in electron microscopy. Various degrees of myofibrillar organization could be observed, which is consistently characteristic of early-stage cardiomyocytes Citation[9], Citation[36].
According to Ki67 stainings, a portion of differentiated cardiomyocytes was not yet fully matured, as has been reported earlier Citation[36]. The observation that cardiomyocytes differentiated in vitro have not matured completely could be beneficial for future cell therapy experiments, since the unmatured cells might survive better and could still have the capacity to divide and be influenced by the surroundings in the recipient heart Citation[21]. Supporting the earlier studies Citation[9], Citation[10], Citation[23], Citation[37], the electrical activity and chronotropic response characterization revealed that the functional adrenergic mechanisms as well as L-type Ca2 + channels were present in cardiomyocytes derived from hESCs
In conclusion, we found significant differences between the cardiac differentiation potentials of different hESC lines even though the cell lines were derived and maintained in a similar fashion. This suggests that the embryo or the part of inner cell mass that contributes to the cell line could already be committed to certain lineages. It is thus likely that the number of hESC lines needed to cover all human leukocyte antigen (HLA) types is going to be large Citation[38] due to a limited differentiation capacity of some lines. None of the differentiation markers studied were clearly indicative of good cardiac differentiation capacity, although Brachyury T and NKX2.5 were significantly upregulated in the best cardiac line, HS346. One of our cell lines was especially interesting, since it did not form beating areas at all indicating that it either has something that inhibits cardiomyocyte differentiation or it lacks something essential for the process. The differentiated cardiomyocytes obtained in co-culture with END-2 cells express proper cardiac markers and have properly functioning L-type Ca2 + channels and a β-adrenoreceptor system, indicating that these cells could be used as a cell model for human cardiomyocytes in pharmacological, toxicological, and cell therapy trials in the future.
Acknowledgements
We thank the personnel of REGEA for their support in stem cell research, especially the heart team and the ladies in the hESC production laboratory. We thank Professor Outi Hovatta for the hESC lines and Professor Christine Mummery for providing the END-2 cells. This study was funded by the Academy of Finland, Finnish Heart Research Foundation, Finnish Cultural Foundation, the Competitive Research Funding of Pirkanmaa Hospital District, Kalle Kaihari Foundation, and Ida Montin Foundation. The MEA system was funded by BioneXt Tampere. Declaration of interest: The authors report no conflicts of interest. The authors alone are responsible for the content and writing of the paper. Mari Pekkanen-Mattila and Erja Kerkelä contributed equally to the writing of this article.
Supplementary Material
Download PDF (7.8 KB)Supplementary Material
Download MS Word (22 KB)Supplementary Material
Download JPEG Image (60.4 KB)
Supplementary Material
Download JPEG Image (103 KB)
Supplementary Material
Download JPEG Image (36.6 KB)
Supplementary Material
Download JPEG Image (205 KB)
References
- Thomson JA, Itskovitz-Eldor J, Shapiro SS, Waknitz MA, Swiergiel JJ, Marshall VS, et al. Embryonic stem cell lines derived from human blastocysts. Science. 1998; 282: 1145–7
- Skottman H, Narkilahti S, Hovatta O. Challenges and approaches to the culture of pluripotent human embryonic stem cells. Regen Med. 2007; 2: 265–73
- Hoffman LM, Carpenter MK. Characterization and culture of human embryonic stem cells. Nat Biotechnol. 2005; 23: 699–708
- Cowan CA, Klimanskaya I, McMahon J, Atienza J, Witmyer J, Zucker JP, et al. Derivation of embryonic stem-cell lines from human blastocysts. N Engl J Med. 2004; 350: 1353–6
- Hoffman LM, Carpenter MK. Human embryonic stem cell stability. Stem Cell Rev. 2005; 1: 139–44
- Lee JB, Kim JM, Kim SJ, Park JH, Hong SH, Roh SI, et al. Comparative characteristics of three human embryonic stem cell lines. Mol Cells. 2005; 19: 31–8
- Adewumi O, Aflatoonian B, Ahrlund-Richter L, Amit M, Andrews PW, Beighton G, et al. Characterization of human embryonic stem cell lines by the International Stem Cell Initiative. Nat Biotechnol. 2007; 25: 803–16
- Skottman H, Mikkola M, Lundin K, Olsson C, Strömberg A-M, Tuuri T, et al. Gene expression signatures of seven individual human embryonic stem cell lines. Stem Cells. 2005; 23: 1343–56
- Kehat I, Kenyagin-Karsenti D, Snir M, Segev H, Amit M, Gepstein A, et al. Human embryonic stem cells can differentiate into myocytes with structural and functional properties of cardiomyocytes. J Clin Invest. 2001; 108: 407–14
- Mummery C, Ward-van Oostwaard D, Doevendans P, Spijker R, van den Brink S, Hassink R, et al. Differentiation of human embryonic stem cells to cardiomyocytes: role of coculture with visceral endoderm-like cells. Circulation. 2003; 107: 2733–40
- Allegrucci C, Young LE. Differences between human embryonic stem cell lines. Hum Reprod Update. 2007; 13: 103–20
- Burridge PW, Anderson D, Priddle H, Barbadillo Munoz MD, Chamberlain S, Allegrucci C, et al. Improved human embryonic stem cell embryoid body homogeneity and cardiomyocyte differentiation from a novel V-96 plate aggregation system highlights interline variability. Stem Cells. 2007; 25: 929–38
- Hovatta O, Mikkola M, Gertow K, Stromberg AM, Inzunza J, Hreinsson J, et al. A culture system using human foreskin fibroblasts as feeder cells allows production of human embryonic stem cells. Hum Reprod. 2003; 18: 1404–9
- Inzunza J, Gertow K, Stromberg MA, Matilainen E, Blennow E, Skottman H, et al. Derivation of human embryonic stem cell lines in serum replacement medium using postnatal human fibroblasts as feeder cells. Stem Cells. 2005; 23: 544–9
- Mummery CL, van Achterberg TA, van den Eijnden-van Raaij AJ, van Haaster L, Willemse A, de Laat SW, et al. Visceral-endoderm-like cell lines induce differentiation of murine P19 embryonal carcinoma cells. Differentiation. 1991; 46: 51–60
- Passier R, Oostwaard DW, Snapper J, Kloots J, Hassink RJ, Kuijk E, et al. Increased cardiomyocyte differentiation from human embryonic stem cells in serum-free cultures. Stem Cells. 2005; 23: 772–80
- Livak KJ, Schmittgen TD. Analysis of relative gene expression data using real-time quantitative PCR and the 2(-Delta Delta C(T)) Method. Methods. 2001; 25: 402–8
- Rajala K, Hakala H, Panula S, Aivio S, Pihlajamaki H, Suuronen R, et al. Testing of nine different xeno-free culture media for human embryonic stem cell cultures. Hum Reprod. 2007; 22: 1231–8
- Kim SE, Kim BK, Gil JE, Kim SK, Kim JH. Comparative analysis of the developmental competence of three human embryonic stem cell lines in vitro. Mol Cells. 2007; 23: 49–56
- Mikkola M, Olsson C, Palgi J, Ustinov J, Palomaki T, Horelli-Kuitunen N, et al. Distinct differentiation characteristics of individual human embryonic stem cell lines. BMC Dev Biol. 2006; 6: 40
- Mummery C. Cardiomyocytes from human embryonic stem cells: more than heart repair alone. Bioessays. 2007; 29: 572–9
- Devine SM, Bartholomew AM, Mahmud N, Nelson M, Patil S, Hardy W, et al. Mesenchymal stem cells are capable of homing to the bone marrow of non-human primates following systemic infusion. Exp Hematol. 2001; 29: 244–55
- Xu C, Police S, Rao N, Carpenter MK. Characterization and enrichment of cardiomyocytes derived from human embryonic stem cells. Circ Res. 2002; 91: 501–8
- He J-Q, Ma Y, Lee Y, Thomson JA, Kamp TJ. Human embryonic stem cells develop into multiple types of cardiac myocytes: action potential characterization. Circ Res. 2003; 93: 32–9
- Pal R, Khanna A. Similar pattern in cardiac differentiation of human embryonic stem cell lines, BG01V and ReliCellhES1, under low serum concentration supplemented with bone morphogenetic protein-2. Differentiation. 2007; 75: 112–22
- Osafune K, Caron L, Borowiak M, Martinez RJ, Fitz-Gerald CS, Sato Y, et al. Marked differences in differentiation propensity among human embryonic stem cell lines. Nat Biotechnol. 2008; 26: 313–5
- Lauss M, Stary M, Tischler J, Egger G, Puz S, Bader-Allmer A, et al. Single inner cell masses yield embryonic stem cell lines differing in lifr expression and their developmental potential. Biochem Biophys Res Commun. 2005; 331: 1577–86
- Tomescot A, Leschik J, Bellamy V, Dubois G, Messas E, Bruneval P, et al. Differentiation in vivo of cardiac committed human embryonic stem cells in postmyocardial infarcted rats. Stem Cells. 2007; 25: 2200–5
- Beqqali, A, Kloots, J, Ward-van Oostwaard, D, Mummery, C, Passier, R. Genome-wide transcriptional profiling of human embryonic stem cells differentiating to cardiomyocytes. Stem Cells. 2006:1956–67.
- Graichen R, Xu X, Braam SR, Balakrishnan T, Norfiza S, Sieh S, et al. Enhanced cardiomyogenesis of human embryonic stem cells by a small molecular inhibitor of p38 MAPK. Differentiation. 2008; 76: 357–70
- Cai CL, Liang X, Shi Y, Chu PH, Pfaff SL, Chen J, et al. Isl1 identifies a cardiac progenitor population that proliferates prior to differentiation and contributes a majority of cells to the heart. Dev Cell. 2003; 5: 877–89
- Filipczyk AA, Passier R, Rochat A, Mummery CL. Regulation of cardiomyocyte differentiation of embryonic stem cells by extracellular signalling. Cell Mol Life Sci. 2007; 64: 704–18
- Hosseinkhani M, Hosseinkhani H, Khademhosseini A, Bolland F, Kobayashi H, Gonzalez SP. Bone morphogenetic protein-4 enhances cardiomyocyte differentiation of cynomolgus monkey ESCs in knockout serum replacement medium. Stem Cells. 2007; 25: 571–80
- Pevny LH, Sockanathan S, Placzek M, Lovell-Badge R. A role for SOX1 in neural determination. Development. 1998; 125: 1967–78
- Kan L, Israsena N, Zhang Z, Hu M, Zhao LR, Jalali A, et al. Sox1 acts through multiple independent pathways to promote neurogenesis. Dev Biol. 2004; 269: 580–94
- Snir M, Kehat I, Gepstein A, Coleman R, Itskovitz-Eldor J, Livne E, et al. Assessment of the ultrastructural and proliferative properties of human embryonic stem cell-derived cardiomyocytes. Am J Physiol Heart Circ Physiol. 2003; 285: H2355–63
- Norstrom A, Akesson K, Hardarson T, Hamberger L, Bjorquist P, Sartipy P. Molecular and pharmacological properties of human embryonic stem cell-derived cardiomyocytes. Exp Biol Med (Maywood) 2006; 231: 1753–62
- Denning C, Allegrucci C, Priddle H, Barbadillo-Munoz MD, Anderson D, Self T, et al. Common culture conditions for maintenance and cardiomyocyte differentiation of the human embryonic stem cell lines, BG01 and HUES-7. Int J Dev Biol. 2006; 50: 27–37
Supplementary Table 1. Primer sequenses.
Supplementary Figure 1. Co-cultures of human embryonic stem cells with mouse visceral endodermal cells (END-2 cells). A: HS293 forms cystic structures that grow upwards from the bottom of the well. B: HS346 forms layer-like beating areas (marked by square), as well as compact three-dimensional beating areas (C). Scale-bar 200 µm.
Supplementary Figure 2. Relative gene expression of bone morphogenic protein-4 (BMP-4) (A), kinase insert domain receptor (KDR)(B), alphafetoprotein (AFP) (C), and SRY sex-determining region Y-box 1 (SOX1) (D) and SRY sex-determining region Y-box 17 (SOX17) (E) in HS181, HS293, HS346, and HS368 at day 3 and 6. QPCR protocol was 10 minutes at + 95°C followed by 40 cycles of 15 seconds at + 95°C and 60 seconds at + 60°C. At the end of the program a dissociation curve protocol was performed to demonstrate that the results are not due to the primer-dimers or non-specific PCR products. From both time points we had two biological replicates which were run as triplicates. For every PCR plate, negative control reactions without cDNA were run to monitor the reliability of the test.
Supplementary Figure 3. A: Differentiated cells stain positively for anti-α-myosin heavy chain. Scale-bar 200 µm. B: Differentiated cells (line HS181 p83) express same cardiac markers compared to commercial heart RNA. C: Size estimation was done with GeneRuler 1 kb DNA Ladder (Fermentas, USA); four smallest fragments are 250, 500, 750, and 1000 bp. Markers from left are β-actin (control), α-myosin heavy chain, atrial myosin light chain, ventricular myosin light chain, troponin T type 2, GATA-4, and connexin-45.
Supplementary Figure 4. A: Electron micrograph showing longitudinally organized myofibrils (arrows). Arrowheads point to developing Z lines (m = mitochondria; pr = polyribosomes; l = lipid droplets). B: Immunoelectron micrograph showing troponin I immunoreactivity in myofibrils (arrows). Arrowheads point to non-labeled area probably representing H band. Scale-bar 500 nm.