?Mathematical formulae have been encoded as MathML and are displayed in this HTML version using MathJax in order to improve their display. Uncheck the box to turn MathJax off. This feature requires Javascript. Click on a formula to zoom.
ABSTRACT
Contingent valuation is used to elicit irrigators’ willingness to pay for soil moisture tools in irrigation schemes in Africa, with various econometric methods employed to mitigate potential bias. Key results include that there is a neighbourhood effect influencing adoption, and that being located downstream and spending more on irrigation water positively and statistically significantly influenced willingness to pay for tools. The result suggests that although focusing on economic incentives and promoting farmer learning by those using the tools may promote greater adoption, there is likely to still be a need for co-investment by other bodies.
Introduction
Agriculture is the highest fresh-water-extracting sector in sub-Saharan Africa (SSA), accounting for 79% of the region’s fresh water withdrawal, with most of this used for irrigation (Food and Agriculture Organization of the United Nations [FAO], Citation2016a), with the industrial and municipal sectors consuming only 5% and 16%, respectively. SSA’s population is predicted to increase from about 13% of the world’s population in 2015 to nearly 22% by the mid-twenty-first century (United Nations Department of Economic and Social Affairs, Citation2017), and thus agricultural crop production demand will increase (Van Ittersum et al., Citation2016). However, the availability of water resources has deteriorated over time (FAO, Citation2016b), mainly driven by climate change along with the growing population (Besada & Werner, Citation2015).
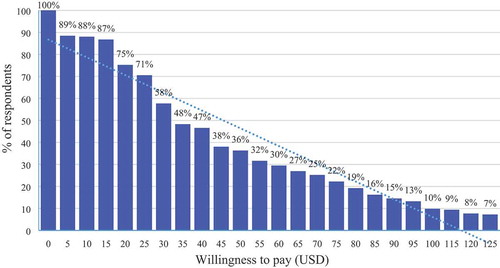
Figure 1. Commutative distribution of irrigators’ WTP for a sensor array and reader (n = 234).
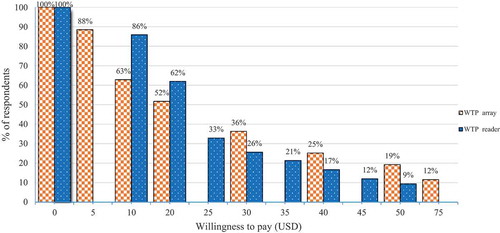
Figure 2. Irrigators’ stated reasons for their WTP for soil moisture monitoring tools.
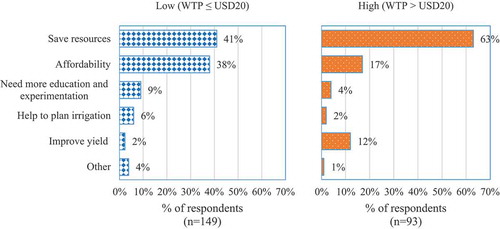
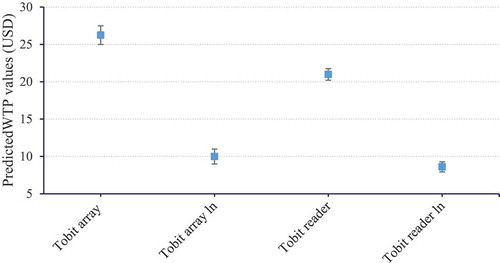
Figure 3. Expected WTP for sensor array and reader (95% confidence interval).
The potential productivity increase of irrigated over rainfed agriculture is one of the reasons it is expected to play a fundamental role in producing food for the growing population (Faurès et al., Citation2007). Many argue that irrigation is not used fully enough across SSA (You, Citation2008) and that there is considerable scope for improving the efficiency of irrigation management. SSA has a low share of irrigated agriculture in total crop production, with 3.4% of its cultivated area irrigated (FAO, Citation2016c). Many small-scale irrigation schemes in SSA perform well below expectations (Bjornlund et al., Citation2018; Stirzaker & Pittock, Citation2014; Sullivan & Pittock, Citation2014) mainly because of poor operation and maintenance (Moyo et al., Citation2017). Also contributing to the failure of irrigation in the region are the lack of appropriate extension services, technical support, institutions, stakeholder empowerment, training and education (for stakeholders such as farmers, communities, extension agents and water user associations), credit and market access (Bjornlund et al., Citation2017; Mwamakamba et al., Citation2017; Pittock et al., Citation2017; Wheeler et al., Citation2017). One current technique to improve irrigation management includes soil moisture monitoring technology, to manage irrigation water losses and provide farmers with data to make better-informed decisions about when to irrigate and for how long (Bjornlund et al., Citation2018; Pittock et al., Citation2018; Stirzaker et al., Citation2017).
This study investigates which farmers are willing to pay for soil moisture monitoring technologies in south-eastern Africa, and how this willingness to pay (WTP) relates to current market prices, to help determine the economic feasibility of broader uptake of monitoring tools in developing countries. The potential for bias in irrigators’ answers is also investigated. The research questions include: What are the socio-economic, demographic and location variables influencing irrigators’ WTP for access to soil water monitoring tools?; And, how much are farm households willing to pay to access these tools? The present research uses cross-sectional data collected across four irrigation schemes in three countries: Kiwere in Tanzania, Mkoba and Silalatshani in Zimbabwe and 25 de Setembro in Mozambique (see Chilundo et al., Citation2020; Mdemu et al., Citation2020; Moyo et al., Citation2020 for details of each scheme). This study uses contingent valuation (CV) to elicit irrigators’ WTP for the tools and uses insights from the agricultural innovation adoption literature (e.g. Akrofi et al., Citation2019; Bennett & Balcombe, Citation2012; Hill et al., Citation2013; Wanyoike et al., Citation2019). CV is a well-known technique used to value resources that are not traded in markets, but, it is susceptible to a multitude of issues (Carson & Groves, Citation2007). Partly this is because of the inability of a constructed imaginary market to represent practical/real exchange between buyers and sellers of goods and services. In this study, we attempted to reduce the inherent defects with the CV method by using ex post remedying techniques – econometric methods: logarithmic transformation and censored least absolute deviations models.
The rest of the article is arranged in the following way. The next section provides an overview of water scarcity and policies, technology adoption decision, monitoring technologies and issues associated with valuation techniques. In the third section, we describe the data and methodology. Key findings and discussions are presented in the fourth section. In the final section, we offer concluding remarks.
Literature review
Water scarcity and policies
Water management policy alternatives to deal with water scarcity are categorized as ‘supply-side’ or ‘demand-side’ instruments (FAO, Citation2012). Supply-side management polices focus on building or upgrading water infrastructure, such as desalination plants and dams, to collect and transfer water resources (Bates et al., Citation2008; Gleick, Citation2003). However, structural management approaches to water scarcity are subject to growing challenges, as many countries have physical limits on surface and groundwater resources but face large increases in water demand in all sectors (Gleick, Citation2000; Koundouri et al., Citation2006). For this reason, since the end of the twentieth century there has been increasing attention to demand-side management to address water scarcity (Gleick, Citation2000).
Demand-side water management policy tries to optimize the utilization of water resources through modernizing water management and governance, adjusting water use timing, encouraging the uptake of water saving innovations and water use productivity. It focuses on institutional, regulatory, research, educational and economic strategies to deal with the challenges of scarcity (Gleick, Citation2003; Grafton & Wheeler, Citation2015).
Agricultural technology adoption theory
New agricultural innovations are key for improving productivity and profitability and achieving sustainable development (Channa et al., Citation2019), especially in developing countries (Doss, Citation2006; Feder et al., Citation1985). Studies suggest that the uptake of innovation is a dynamic process through which individuals gradually learn about an innovation and adopt it (Baumüller, Citation2012). A wide range of empirical literature has studied what drives or constrains agricultural innovation adoption (Dinar & Yaron, Citation1992; Koundouri et al., Citation2006). The adoption behaviour of farmers is conditioned by economic factors, such as credit access, technology costs, input and output prices, wealth, income, labour availability and information access (Dinar et al., Citation1992; Feder et al., Citation1985; Foster & Rosenzweig, Citation2010; Wheeler et al., Citation2017). Studies have considered farmers’ characteristics, such as education, training, gender and farming experience, and farm-specific features like plot size, soil (quality, type and slope) and distance to market centre, to explain technology adoption decisions (Abdulai & Huffman, Citation2005, Citation2014; Haensch et al., Citation2019). These decisions are also constrained by climatic and geographical factors like water access and weather (Baumüller, Citation2012). Adoption choice is also significantly influenced by geographical proximity (the neighbourhood effect), which accelerates information flow through interpersonal dialogue and communication within the farming society (Case, Citation1992; Haensch et al., Citation2019).
The features of an innovation, such as its comparative benefit, suitability to the prevailing system, simplicity to learn, use and operate, and visibility of outcomes are also important in facilitating adoption (Pannell et al., Citation2006; Rogers, Citation1983). There have also been a growing number of studies on the influence of social capital in stimulating the uptake of an innovation (Bandiera & Rasul, Citation2006; Haensch et al., Citation2019). Social capital is usually associated with tradition, beliefs and values, which assist communal decision making within a social system (Woolcock & Narayan, Citation2000).
In understanding the adoption of agricultural innovations, careful consideration must be given to the type of innovation itself. Wheeler et al. (Citation2017) distinguish between the adoption of ‘hard’ innovations (e.g. improved seed varieties) and ‘soft’ ones (e.g. farm management) and show that various attributes have differing influences. Innovations that are predominantly knowledge based, and those that have a public-good element (either in their provision or in the externalities associated with their use) are significantly different from innovations that have more private farm benefits. Water-management-based farm innovations such as the one we are investigating here in this study are knowledge-based (soft) technologies with a considerable public-good element. It is known that for such types of innovations, strong institutional arrangements and networks can be essential for sustainable agricultural adoption (Hounkonnou et al., Citation2012; Wheeler et al., Citation2017). Ostrom (Citation1990) outlined key lessons for common governance innovations, which are useful for insights for this study. Part of the reason water-saving technology may be under-adopted in Africa is a complex combination of institutions, public-good issues and governance.
Soil moisture monitoring technologies: the Chameleon
Understanding soil water content is essential for efficient irrigation practice, as over-irrigation wastes private farm agricultural inputs and micro- and macronutrients and hence, potentially reduces agricultural output (Barton & Colmer, Citation2006; Fiebig & Dodd, Citation2016; Lizarraga et al., Citation2003; Vories et al., Citation2017). Under-irrigation, on the other hand, increases crop stress and thus can reduce agricultural return (Lizarraga et al., Citation2003). However, it is also critical to note the difference between water consumption and water extraction, and the consequences for private-public water resource availability (Grafton et al., Citation2018).
A variety of soil moisture monitoring technologies, including tensiometers, gravimetric, psychrometers and neutron probes, can help farmers decide when to irrigate and for how long (Jones, Citation2004). However, the adoption of these techniques is low in Africa (Annandale et al., Citation2011; Myeni et al., Citation2019). One reason for this may be inadequate extension services and information dissemination (Stevens, Citation2006). In response to this low rate of adoption, the Commonwealth Scientific and Industrial Research Organization developed a moisture monitoring tool which is easy to use, provides critical data for farmer learning and is less expensive, to help resource-poor farmers make optimal and efficient watering decisions in the field (Stirzaker et al., Citation2014, Citation2017). It represents both a ‘hard’ and a ‘soft’ innovation, as it involves both technology adoption and management expertise (Wheeler et al., Citation2017).
The Chameleon measures soil water suction at the root zone. It includes a reader and a sensor array, with three moisture sensors which are buried in the soil at varying depths. Each array can be connected to a reader, which depicts the outcome visually, in a way that is easy for small-scale farmers to understand and that facilitates learning about ‘soil-water and nutrient dynamics’ to improve irrigation management decisions. The Chameleon does this by measuring the stress intensity at the specified soil depth of each sensor array and revealing the reading outcome as blue if soil is wet, green if it is moist, and red if it is dry. This provides helpful information to farmers to decide when and how much to irrigate; if used correctly, it minimizes both under-irrigation and over-irrigation. It also helps farmers plan fertilizer application and agronomic practices (see Stirzaker et al., Citation2017, and Virtual Irrigation Academy, Citation2019, for more details).
This study aims to understand African irrigators’ WTP for Chameleon soil moisture monitoring tools. Given that monitoring tools were introduced for the first time in the study area by the project, we used CV to estimate irrigators’ WTP for these technologies. The next section provides an overview of the method.
Valuation techniques
In resource valuation studies, there are two main valuation methods, namely revealed preference and stated preference techniques, that practitioners and scholars frequently use to collect crucial information regarding the approximate value of commodities or services that do not have monetary prices in conventional markets (Adamowicz et al., Citation1994). Revealed preference methods (e.g. travel cost, hedonic method, averting behaviour) tries to measure the prices of non-tradable goods and services by directly assessing the behavioural responses of an economic agent in a practical context (Willis, Citation2014). They can be used to quantify direct use values and have the advantage that people’s responses are not susceptible to a constructed scenario. However, they do not estimate non-use or indirect values. Stated preference approaches (e.g. CV, contingent behaviour, choice modelling, conjoint analysis) attempt to estimate the monetary value of non-tradable items by presenting a simulation-based imaginary market with survey questionnaires. Their ability to capture some non-use and indirect values of public resources (Arrow et al., Citation1993) is the main benefit of these approaches, but their estimates are highly vulnerable to bias (Gregg & Wheeler, Citation2018; Willis, Citation2014).
In particular, CV is one of the most common valuation approaches, often used as a ‘pre-test’ of commodities that would have prices in the conventional system (Cameron et al., Citation2002). CV uses survey questions, in either a close-ended or open-ended format (Arrow et al., Citation1993), to elicit the maximum amount of money targeted respondents are willing to pay to improve the provision/establishment of communal resources, or the minimum amount of money respondents are willing to accept for a decline in the provision/availability of goods and services (Arrow et al., Citation1993). In the CV approach, individual respondents are asked to reveal their preference for a specific commodity contingent on the hypothetically established market/scenario. The method has been used around the world to estimate farmers’ WTP for a variety of services and products (e.g. Akrofi et al., Citation2019; Bennett & Balcombe, Citation2012; Masud et al., Citation2015; Poudel & Johnsen, Citation2009; Wanyoike et al., Citation2019).
In this study, a payment card CV format was adopted to elicit irrigators’ WTP for access to Chameleon soil moisture monitoring technology. In payment card elicitation (Mitchell & Carson, Citation1981), an interviewer gives study participants a card showing alternative bid values arranged in ascending order and asks them to tick the amount they would be willing to pay for provision of or access to goods or services. The bids start with 0 and would change sequentially at constant intervals. The payment card technique is a standard format whereby respondents consider the listed prices of the good in question and say whether they would buy it at those prices (Kerr, Citation2001).
Although CV is a well-known valuation technique and has been used for decades, it is subject to a growing number of shortcomings (Champ & Bishop, Citation2001; Mitchell & Carson, Citation1981). Among others, hypothetical, strategic and instrumental bias have been extensively discussed in the literature (Gregg & Wheeler, Citation2018; Mitchell & Carson, Citation1981). Hypothetical bias occurs when the stated WTP in hypothetical markets does not match WTP values in regular markets, which involve practical transactions between market players (Champ & Bishop, Citation2001). Strategic bias is related to ‘non-excludability’ aspects associated with communal resources, and is where participants purposefully distort their valuation answers with the notion to affect the availability of a good or service (Mitchell & Carson, Citation1981), either overstating or understating WTP. Instrumental bias occurs where WTP data collection instruments are not properly designed and so do not reflect the full picture of the commodity being valued. It is related to the applicability of the proposed payment method (e.g. tax, fee or donation), the clarity of the preference question, and the question’s placement in the survey (Mitchell & Carson, Citation1981).
Certainty scale, inferred valuation, consequential design and cheap talk are some approaches widely employed to deal with hypothetical bias (Carson & Groves, Citation2007; Cummings & Taylor, Citation1999; Gregg & Wheeler, Citation2018; Li & Mattsson, Citation1995; Lusk & Norwood, Citation2009). The certainty scale is a post-preference question used to alleviate potential bias in resource valuation (Li & Mattsson, Citation1995). In this method, study participants are asked to endorse their level of assurance that they would pay the bid value they have already mentioned in a simulation-based theoretical market. Inferred valuation is a new method used to minimize parts of the CV method’s potential defect by inviting an economic agent for interview to estimate others’ preferences (Lusk & Norwood, Citation2009). A valuation design is said to be consequential if targeted respondents have understood that their answers determine the intended aims of the proposed policy change and that the policy outcome would influence their utility. Under such a valuation design, respondents are assumed to make a rational decision, with little or no incentive to provide biased responses for valuation questions (Carson & Groves, Citation2007). ‘Cheap talk’ design refers to a pre-survey interaction between the investigator and the respondents with the aim of reducing the bias associated with the constructed imaginary market (Cummings & Taylor, Citation1999). Median estimation and logarithmic transformation have also been used to reduce hypothetical bias (Gregg & Wheeler, Citation2018).
In the context of this study, it is important to understand that while there were no market prices for the monitoring tools in local shops, farmers had used the tools for four years and seemed to understand their value in the form of greater yields and less labour (Chilundo et al., Citation2020; Mdemu et al., Citation2020; Moyo et al., Citation2020). When the project originally started, farmers were unwilling to express a WTP. Even midway through the project, when they recognized how much their yield had improved and how much time they had saved, they still did not want to state a WTP. However, after four years of use (monitoring technologies were given to farmers freely by the project), farmers started to be willing to express an amount. This WTP has been further confirmed in recent focus groups during phase two of the project. Hence, we suggest that there is potential for both hypothetical and strategic bias in the answers. Strategic bias could be present in either an understatement or overstatement of WTP by irrigators, depending on their views on subsidized prices, future provision and neighbour’s responses. Hence, we report WTP estimated by two different methods, as explained next.
Data and methodology
Data collection
This research uses data from an Australian Centre for International Agricultural Research project ‘Increasing Irrigation Water Productivity in Mozambique, Tanzania and Zimbabwe through On-Farm Monitoring, Adaptive Management and Agricultural Innovation Platforms’. The project, started in 2013, aims to ‘improve the productivity and profitability’ of SSA small-scale irrigation through soil water management, ‘agricultural innovation platforms’ and policy reforms (Pittock et al., Citation2017; Van Rooyen et al., Citation2017). In 2014 and 2015, the project introduced Chameleon soil moisture monitoring tools across five schemes: Kiwere in Tanzania, Mkoba and Silalatshani in Zimbabwe, and 25 de Setembro (Boane) and Khanimambo in Mozambique (Bjornlund et al., Citation2018). In each sample irrigation site, the project selected 20 irrigators to use the soil moisture monitoring tool in their field to learn about irrigation water and micronutrient management for efficient irrigation practice. Each farmer received a sensor array, which was installed in their plot for free (Stirzaker et al., Citation2017). The project also deployed two Chameleon readers in each scheme, as well as a wetting front detector (Bjornlund et al., Citation2018). The project employed field personnel and trained them to monitor tool installation, measurement, data recording and reporting. Soil moisture readings were initially taken weekly, and recorded in farmers’ field books, so the farmers could see changes over time and adjust their irrigation practice accordingly (Stirzaker et al., Citation2017). At the beginning of the project, the irrigation infrastructure in Khanimambo was damaged by flooding, and irrigation largely ceased, so that scheme was excluded from this analysis.
This study uses face-to-face farm survey data collected from four irrigation schemes in Mozambique, Zimbabwe and Tanzania. A pilot survey was conducted to ensure the validity and consistency of survey instruments across schemes, and questionnaires were refined before the actual fieldwork. In total, 266 households were surveyed in March–May 2017, with complete responses available from 234 respondents across the four schemes, which were used for modelling for this study.
Data were collected on socio-economic and demographic characteristics, agricultural input and output prices, marketing and institutional variables, monitoring tools, irrigation practices, perception of changes that have taken place during the project, decision making, and irrigators’ WTP for access to monitoring tools. Interviews were conducted with either the household head or other key decision-making household members. A payment card was used to elicit irrigators’ WTP for the monitoring tools. Respondents were shown bids ranging from 0 to USD75 for the sensor array, and from 0 to USD50 for permanent access to a sensor reader on a weekly basis.
Econometric methodology
Given the nature of our survey data, a Tobit model was chosen as the best method to estimate the determinants of farmers’ WTP for the sensor array and for weekly access to the reader. Zero-WTP responses are common in CV studies, and the Tobit model is one of the regression methods most suitable for analyzing data with censored responses (Tobin, Citation1958). The unique feature of the Tobit model is that it attempts to incorporate each piece of information (censoring values as well as values greater than censoring point) into the investigation (Tobin, Citation1958). In our survey, there are farmers with WTP responses clustered at 0 (bottom limit) for both sensor array and reader, and WTP values of USD75 and USD50 as an upper censoring response for sensor array and reader, respectively, so the Tobit method was appropriate.
For individual irrigation farm households, WTPi* is the latent (unobserved) WTP for access to soil monitoring tools (both sensor array and reader); it is a linear function of independent variables and a normally distributed stochastic term:
Then observed maximum WTP (with a censoring point at zero for the lower limit and 75 and 50 for upper limits for sensor array and reader, respectively) is defined as
where represents a set of covariates that influence WTP,
is unknown coefficients, and
is the stochastic term.
As a form of sensitivity analysis, we also tested other methodologies and compared their results against the Tobit results. For example, as well as employing ordinary least squares (OLS), we also tested censored least absolute deviations (CLAD) and natural logarithmic transformation methods to minimize the potential hypothetical bias related to the CV approach. The CLAD model is an estimation approach that uses median values instead of mean values. Estimates based on CLAD are robust to non-homoscedastic error terms (Powell, Citation1984) and outliers (Gregg & Wheeler, Citation2018). Given the performance (coefficients) and test statistics (e.g. based on Akaike and Bayesian information criteria , AIC and BIC) of the models, only Tobit and natural logarithmic transformation results are reported here, as these models provided the best fit compared to the OLS and CLAD models (both in level and natural logarithmic transformation) estimates. For the CLAD model in particular, most of the estimated coefficients of independent variables (e.g. gender, plot location within the scheme, knowledge of monitoring tools) had a statistically insignificant influence on WTP for both the sensor array and reader. In contrast, most of the significant covariates in the Tobit model had similar effects on irrigators’ WTP in the OLS model. However, given that the OLS method fails to recognize the inherent clustering and censoring nature of our data, a limitation the Tobit method overcomes (Amemiya, Citation1973), then the OLS method may provide biased outcomes. Thus, the AIC and BIC tests suggest that the Tobit model is more suitable for our data than OLS. The Tobit model (natural logarithmic transformed) also provides conservative estimates of average WTP values for both the sensor array and the reader, which the resource valuation literature (Arrow et al., Citation1993; Gregg & Wheeler, Citation2018) suggests should be a criterion for method choice.
Based on the literature (Akrofi et al., Citation2019; Bennett & Balcombe, Citation2012; Masud et al., Citation2015; Poudel & Johnsen, Citation2009; Qaim & De Janvry, Citation2003; Wanyoike et al., Citation2019), socio-economic, demographic and location variables were hypothesized to influence WTP and hence were included in our models. We conducted multicollinearity diagnostics using variance inflation factors and correlation coefficients. These tests found that gender and marital status of head were highly collinear (0.8), so marital status was excluded. We added 0.1 to the value of all observations in order to allow natural log transformation estimation for zero-WTP responses. Finally, we used robust standard errors to account for potential heteroscedasticity ().
Table 1. Descriptive statistics (n = 234).
Table 2. Tobit model WTP estimated results for tool adoption across four irrigation schemes.
Results and discussion
Descriptive results
Summary statistics are provided in . Approximately 75% of respondents were male, and the mean age of household head was about 56. The mean family size is approximately six, and 29% of heads had attended secondary school or above. The median irrigated land size was 0.8 hectare. On average, farmers’ annual gross farm income (crop and livestock) was USD1230 per year, and they spent USD40 per year on irrigation water (including water fee, maintenance and pump fuel). Nearly three-quarters of respondents knew what the monitoring tools measure and the benefits of adopting them.
Summary statistics of the WTP answers on access to monitoring technologies are shown in Appendix A. About 89% and 86% of the irrigators have positive WTP responses for the Chameleon sensor array and access to the reader, respectively. Scheme-level responses indicate that 100% and 96% of 25 de Setembro farmers have non-zero WTP for sensor array and reader, respectively, compared to 81% and 79% for Silalatshani farmers. This might be because irrigators in 25 de Setembro are charged for pump fuel proportional to water use and so may be more financially motivated and willing to pay for the uptake of moisture monitoring technology. The percentage of irrigators willing to pay for access to a sensor reader is slightly smaller than that for buying a sensor array, for both pooled and disaggregated scheme-level data (Appendix A). However, a sensor array has no value without access to a reader. This difference probably reflects that farmers are willing to pay for the sensor array, which they need to have installed in their own field, but hope the irrigation association or somebody else will pay for the reader.
shows the cumulative distribution of WTP for a sensor array and weekly access to a reader. WTP response is a decreasing function of price, consistent with the theory of demand. Around 63% of respondents were willing to pay USD10 for a sensor array, compared to 86% for weekly access to the reader. More than half were willing to pay USD20 for a sensor array, and nearly two-thirds for weekly access to the sensor reader at this price. About 12% and 9% of farmers were willing to pay the maximum listed bid for access to a sensor array and reader, respectively.
Irrigators’ stated reasons for their WTP for monitoring tools
Farmers were asked why they would be willing to pay for monitoring tools (). For comparison, respondents who answered this question were categorized into two groups: low WTP (bids of USD20 or less) and high WTP (bids over USD20). Saving resources, such as water, fertilizer and labour, was the most frequently mentioned reason, in both the low-WTP group (41%) and the high-WTP group (63%). Affordability was cited by 38% of the low-WTP group and 17% of the high-WTP group. About 12% of the high-WTP group cited better yield, compared to 2% of the low-WTP group. Irrigation-planning benefits were cited by 6% of the low-WTP irrigators and 2% of high-WTP irrigators.
Determinants of WTP for access to monitoring tools
The regression results of farmers’ WTP for the adoption of the monitoring tools are presented in . Along with the Tobit regression, we used natural log transformed WTP to mitigate hypothetical bias (as suggested by Gregg & Wheeler, Citation2018). The AIC and BIC for Tobit models showed that the model with natural log transformation better fit the survey data, so coefficient interpretation in this study is based on the transformed Tobit model ().
For clearer presentation of the key findings, we categorize them under subheadings, such as household and scheme/location characteristics.
Household characteristics
Gender of the household head was associated with WTP for access to the sensor reader at the 10% significance level, with a male household head having a lower WTP. This could be because women do most of the irrigation work, and perhaps that female-headed households have less access to man-power, and an inequitable share of water resources, and thus benefit more from access to a sensor reader, as it reduces the labour needed for irrigation and makes the water supply more reliable. This finding could also partly be attributed to the unequal productive resource distribution between male-headed and female-headed farm households. The research of Hite et al. (Citation2002) in Mississippi documented similar effects of gender on WTP for technology adoption, although Hill et al. (Citation2013) found that female heads have a lower WTP for the adoption of insurance innovation.
Knowledge of the uses of the tools was another statistically significant (10% level) influence on irrigator WTP for weekly access to a sensor reader, suggesting that respondents with better knowledge of the function and use of tools were willing to pay more for access to them. It seems that innovation adoption decisions are strongly influenced by farmers’ exposure to and awareness of the benefits of the technology (Rogers, Citation1983). Our finding is consistent with Channa et al. (Citation2019) and Qaim and De Janvry (Citation2003). For the sensor arrays, however, the estimated coefficients for tool knowledge were insignificant. This may mean that the knowledge of how to use the tool was associated with how to interpret and respond to the display on the reader.
Findings from the linear Tobit model (although not the preferred model) showed that age and access to information influenced WTP for the sensor reader. Older farmers had a lower WTP for a sensor reader, maybe because they are more risk averse and thus reluctant to pay for new technologies. This is consistent with the findings of Hill et al. (Citation2013). Farmers who accessed information by attending farm/field days had a higher WTP for monitoring tools than those who did not, presumably because it improved their practical knowledge of agronomic issues and/or their understanding of the tools’ benefits. This is consistent with the findings of Toma et al. (Citation2018).
The regression results also showed that male household heads with secondary or greater education have a significant (5%) positive influence on WTP for the sensor reader. This might be because education improves farmers’ understanding of the overall benefits of the tools. This is consistent with the findings of both Abdulai and Huffman (Citation2014) and Koundouri et al. (Citation2006).
Irrigation scheme and location
The cost of water, which includes a water fee, maintenance, pump fuel, and other related costs, was a key influence on WTP for the monitoring tools. The price a farmer paid for water positively and significantly influenced WTP. In Mozambique (25 de Setembro) this makes intuitive sense because farmers’ payments are related to water volume via the cost of diesel pumping. In the other schemes it is less obvious, as they pay a fixed cost per area, and farmers have much the same area under irrigation. The results could reflect that, particularly at the beginning of the project, many did not pay for water or contribute labour for maintenance. This could suggest that those who did pay and contribute were willing to pay more, as they are likely to be more productive and more profitable, and thus see the benefits more clearly. This shows a clear link between economic incentives and tool adoption. Irrigators have experienced that monitoring tools reduce the cost of fertilizer, labour (money and time), pump fuel, maintenance and other input costs (Chilundo et al., Citation2020; Mdemu et al., Citation2020; Moyo et al., Citation2020), and they may also have perceived that access to the tools reduced production loss from either under- or over-irrigation. These results are consistent with Frisvold and Bai (Citation2016) and Moreno and Sunding (Citation2005), who showed that high water costs and pricing drove adoption of water-saving irrigation innovations.
Distance to the nearest installed sensor array had a strong negative influence on farmers’ WTP; the further the respondent’s plot was from the nearest tool, the less they were willing to pay for the sensor array and reader. This could be because nearness to the installed tool increases farmer-to-farmer learning and the understanding of the benefits. This finding is consistent with Schmidtner et al. (Citation2011) regarding the contribution of proximity in technology adoption, and Haensch et al. (Citation2019) regarding the influence of neighbours for selling permanent water in Australia.
The farmer’s plot location within the scheme also influenced WTP. Having a downstream plot raised farmers’ WTP for a sensor array and reader, significant at the 10% level. This may reflect inequitable water distribution due to poor infrastructure, unsatisfactory maintenance and obsolete canal design (African Center for Economic Transformation, Citation2017). Another reason might be that farmers at the head end of canals use too much water through ignorance. In such irrigation systems, water access and distribution are uneven, with downstream irrigators regularly denied access to reliable and fair irrigation water supply, which is clearly illustrated in all the schemes included in this study (Chilundo et al., Citation2020; Mdemu et al., Citation2020; Moyo et al., Citation2020). Water inequality is often worse during the dry period, resulting in water use competition, conflict, yield loss and many plots remaining fallow (Mdemu et al., Citation2017; Ostrom, Citation1990). Consequently, downstream farmers might have a higher WTP for the access to tools because it enables better management of their less reliable water supply. These farmers have also experienced substantial improvements to their water supply since the project intervention, and a significant reduction in conflicts over water access (Chilundo et al., Citation2020; Mdemu et al., Citation2020; Moyo et al., Citation2020), because of upstream farmers irrigating less due to learning from the tools. Thus, these farmers see greater benefits from the overall adoption of the tools, as they ensure more equitable and reliable water distribution throughout the irrigation season. This is consistent with findings in the Indus Basin, Pakistan, where Hussain et al. (Citation2004) found a significant difference between upstream and downstream farmers in terms of water access and wheat productivity. Manero et al. (Citation2019) also found that both upstream and downstream farmers had low agricultural output, compared to midstream farmers, in Tanzania. It is also possible that this finding that downstream irrigators have higher WTP for the tools reflects an element of strategic bias, where irrigators deliberately overstate their WTP in order to encourage the use of the tools across the whole irrigation scheme, particularly by upstream irrigators. Finally, irrigators in 25 de Setembro were willing to pay more for sensor arrays than irrigators in Silalatshani (significant at 5%). This might be because farmers in the former scheme pay for pump fuel (i.e. they have an incentive for efficient water application because it will save fuel).
presents the estimated mean WTP for access to monitoring tools for irrigated farming households, derived from the regressions. Per our Tobit model (linear), expected WTP for sensor array and weekly access to sensor reader in the sample households was USD26 and USD21, respectively. The Tobit model with transformation (employed to reduce hypothetical bias) produced estimates of only USD10 for a sensor array and USD9 for a reader, less than half of the estimates from the linear Tobit model ( and ). This comparison suggests that the application of natural log transformation to CV estimation is an efficient and alternative way to remedy the problem of hypothetical bias, as Gregg and Wheeler (Citation2018) found. There are also questions regarding strategic bias in our results, which could lead to both either under- or over-statement of WTP. Further comparison of the adoption of soil moisture monitoring tools in the African situation over time will provide more insights into the robustness of our WTP findings.
Table 3. Expected WTP for soil moisture monitoring tools (95% confidence interval).
Currently, the Chameleon moisture monitoring tool in its prototype manufacturing stage; it is produced in Australia and South Africa and supplied to the market through the Virtual Irrigation Academy (Citation2019). A Chameleon sensor array (three sensors) and one card reader currently can be bought for USD68.35 (exchange rate: AUD1 = USD0.6904, Reserve Bank of Australia, Citation2019), excluding taxes, duties and transportation. However, commercial production and wholesaling could add costs. Note that this is not the reader farmers in the project used, though it has the same functionality, so this was the most appropriate price for comparison. Around 25% of our survey respondents were willing to pay the online price to get the full set of moisture monitoring tools (a combination of reader and array; see Appendix B). This finding implies that the adoption of this technology by small-scale farmers could be significant in the future and that farmers are willing to at least co-contribute within schemes. Our study also suggests a significant spread of learning among farmers with the adoption of the tools. Twice as many farmers reported changing their farming practices, and benefitting thereby, as had access to the tools (Chilundo et al., Citation2020; Mdemu et al., Citation2020; Moyo et al., Citation2020).
However, there are several reasons why adoption over time might be different from the preferences expressed by farmers in this study. There is a broader question of why, after more than 50 years of trying and billions of dollars of donor funding, is almost no water-saving technology evident in small-scale schemes in Africa? That water management tools are a knowledge-based innovation with public-good elements is part of the reason, while the other part is the failure of institutions and governance. This suggests that the tools need to be part of a wider learning system. Parry et al. (Citation2020) emphasized farmer-to-farmer learning and the broader uptake of the lessons from the tools. Other issues include tool warranty, longevity and maintenance, a learning system for extension officers, and the involvement of public-sector stakeholders. Further investigation is warranted of farmers’ adoption of tools, its public-good benefits, and the institutional conditions of schemes that promote adoption.
Conclusion
Agriculture is the largest water-extracting sector in SSA, and agricultural water productivity is low. Adoption of soil moisture monitoring tools could play an instrumental role to improve on-farm water use productivity. Understanding the willingness of irrigators to pay for soil moisture monitoring tools to reduce water use and increase farm profitability is important for decision making when planning new schemes or refurbishing old schemes. This will help decision makers design appropriate policy instruments for wider uptake of monitoring tools by resource-poor small-scale farmers.
This study examined the factors influencing WTP and farm households’ mean WTP for monitoring tools using CV methodology and various econometric techniques (e.g. CLAD and log transformation) to reduce hypothetical bias.
We find that being closer to installed tools (the ‘neighbourhood effect’), being located downstream, and paying more for irrigation water positively and significantly affected the willingness of irrigators to pay for a sensor array. For the sensor reader, WTP was positively and significantly influenced by farmers’ knowledge of the use and benefits of the tools, geographical proximity to installed tools (the 'neighbourhood effect'), being located downstream, having a female household head, and male heads with higher education. Most farmers stated a non-zero WTP for the sensor array and access to a reader, although there is probably still a need for co-investment by public bodies. Our results suggest that there is a demand for monitoring tools, and focusing on economic incentives and encouraging farmer learning may promote greater tool adoption by small-scale irrigators, though there are still considerable issues to investigate further regarding the link between institutional scheme characteristics and farmer adoption.
Although the findings of this research offer essential insights for decision making regarding the uptake of water use productivity enhancing innovations, care must be taken in making certain inferences from this study. Because sample size is too small for country/scheme–level analysis, the results are dependent on pooled data across three SSA countries with diverse institutional structures, farmer education levels and behaviours, and working environments, so additional investigations with country/scheme–level data are necessary to check for country/scheme–level heterogeneity. It is also well known that respondents in CV studies often overstate their WTP, as compared to prices in a real market context, mainly due to hypothetical bias. This highlights the need for future research in this area, especially in the context of agriculture in the SSA.
Acknowledgments
The Australian Centre for International Agricultural Research financed this research through the Transforming Irrigation in Southern Africa (TISA) projects FSC/2013/006 and LWR/2016/137. We also thank all TISA project team members from Australia, Tanzania, Zimbabwe and Mozambique for collecting the survey data and other contributions. Constructive comments from two anonymous reviewers are also gratefully acknowledged.
Disclosure statement
No potential conflict of interest was reported by the authors.
Additional information
Funding
References
- Abdulai, A., & Huffman, W. (2014). The adoption and impact of soil and water conservation technology: An endogenous switching regression application. Land Economics, 90(1), 26–43. https://doi.org/10.3368/le.90.1.26
- Abdulai, A., & Huffman, W. E. (2005). The diffusion of new agricultural technologies: The case of crossbred cow technology in Tanzania. American Journal of Agricultural Economics, 87(3), 645–659. https://doi.org/10.1111/j.1467-8276.2005.00753.x
- Adamowicz, W., Louviere, J., & Williams, M. (1994). Combining revealed and stated preference methods for valuing environmental amenities. Journal of Environmental Economics and Management, 26(3), 271–292. https://doi.org/10.1006/jeem.1994.1017
- African Center for Economic Transformation. (2017). African transformation report 2017: Agriculture powering Africa’s economic transformation. ACET. Retrieved March 9, 2018, from http://acetforafrica.org/acet/wp-content/uploads/publications/2017/10/ATR17-full-report.pdf
- Akrofi, N. A., Sarpong, D. B., Somuah, H. A., & Osei-Owusu, Y. (2019). Paying for privately installed irrigation services in Northern Ghana: The case of the smallholder Bhungroo irrigation technology. Agricultural Water Management, 216, 284–293. https://doi.org/10.1016/j.agwat.2019.02.010
- Amemiya, T. (1973). Regression analysis when the dependent variable is truncated normal. Econometrica: Journal of the Econometric Society, 41(6), 997–1016. https://doi.org/10.2307/1914031
- Annandale, J. G., Stirzaker, R., Singels, A., Van der Laan, M., & Laker, M. C. (2011). Irrigation scheduling research: South African experiences and future prospects. Water SA, 37(5), 751–764. https://doi.org/10.4314/wsa.v37i5.12
- Arrow, K., Solow, R., Portney, P., Leamer, E. E., Radner, R., & Schuman, H. (1993). Report of the NOAA panel on contingent valuation. Federal Register, 58(10), 4601–4614. Retrieved March 24, 2020, from http://citeseerx.ist.psu.edu/viewdoc/download?doi=10.1.1.129.2114&rep=rep1&type=pdf
- Bandiera, O., & Rasul, I. (2006). Social networks and technology adoption in northern Mozambique. Economic Journal, 116(514), 869–902. https://doi.org/10.1111/j.1468-0297.2006.01115.x
- Barton, L., & Colmer, T. D. (2006). Irrigation and fertiliser strategies for minimising nitrogen leaching from turfgrass. Agricultural Water Management, 80(1–3), 160–175. https://doi.org/10.1016/j.agwat.2005.07.011
- Bates, B. C., Kundzewicz, Z. W., Wu, S., & Palutikof, J. P. (eds). (2008). Climate change and water: Technical paper of the Intergovernmental Panel on Climate Change. IPCC Secretariat. Retrieved April 4, 2019, from https://www.ipcc.ch/publication/climate-change-and-water-2/
- Baumüller, H. (2012). Facilitating agricultural technology adoption among the poor: The role of service delivery through mobile phones (ZEF working paper 93). University of Bonn.
- Bennett, R., & Balcombe, K. (2012). Farmers’ willingness to pay for a tuberculosis cattle vaccine. Journal of Agricultural Economics, 63(2), 408–424. https://doi.org/10.1111/j.1477-9552.2011.00330.x
- Besada, H., & Werner, K. (2015). An assessment of the effects of africa's water crisis on food security and management. International Journal of Water Resources Development, 31(1), 120–133. doi:10.1080/07900627.2014.905124
- Bjornlund, H., Parry, K., Pittock, J., Stirzaker, R., Van Rooyen, A., Moyo, M., Mdemu, M., de Sousa, W., Cheveia, E., Munguambe, P., Kimaro, E., Kissoly, L., Chilundo, M., Zuo, A., & Ramshaw, P. (2018). Transforming smallholder irrigation into profitable and self-sustaining systems in Southern Africa. Retrieved January 29, 2019, from https://www.iwra.org/wpcontent/uploads/2018/11/8-SWM-Africa.pdf
- Bjornlund, H., Van Rooyen, A., & Stirzaker, R. (2017). Profitability and productivity barriers and opportunities in small-scale irrigation schemes. International Journal of Water Resources Development, 33(5), 690–704. https://doi.org/10.1080/07900627.2016.1263552
- Cameron, T. A., Poe, G. L., Ethier, R. G., & Schulze, W. D. (2002). Alternative non-market value elicitation methods: Are the underlying preferences the same? Journal of Environmental Economics and Management, 44(3), 391–425. https://doi.org/10.1006/jeem.2001.1210
- Carson, R. T., & Groves, T. (2007). Incentive and informational properties of preference questions. Environmental and Resource Economics, 37(1), 181–210. https://doi.org/10.1007/s10640-007-9124-5
- Case, A. (1992). Neighborhood influence and technological change. Regional Science and Urban Economics, 22(3), 491–508. https://doi.org/10.1016/0166-0462(92)90041-X
- Champ, P. A., & Bishop, R. C. (2001). Donation payment mechanisms and contingent valuation: An empirical study of hypothetical bias. Environmental and Resource Economics, 19(4), 383–402. https://doi.org/10.1023/A:1011604818385
- Channa, H., Chen, A. Z., Pina, P., Ricker-Gilbert, J., & Stein, D. (2019). What drives smallholder farmers’ willingness to pay for a new farm technology? Evidence from an experimental auction in Kenya. Food Policy, 85, 64–71. https://doi.org/10.1016/j.foodpol.2019.03.005
- Chilundo, M., de Sousa, W., Christen, E. W., Faduco, J., Bjornlund, H., Cheveia, E., Munguambe, P., Jorge, F., Stirzaker, R., & Van Rooyen, A. F. (2020). Do agricultural innovation platforms and soil moisture and nutrient monitoring tools improve the production and livelihood of smallholder irrigators in Mozambique? International Journal of Water Resources Development. doi:10.1080/07900627.2020.1760799
- Cummings, R. G., & Taylor, L. O. (1999). Unbiased value estimates for environmental goods: A cheap talk design for the contingent valuation method. American Economic Review, 89(3), 649–665. https://doi.org/10.1257/aer.89.3.649
- Dinar, A., Campbell, M. B., & Zilberman, D. (1992). Adoption of improved irrigation and drainage reduction technologies under limiting environmental conditions. Environmental and Resource Economics, 2(4), 373–398. https://doi.org/10.1007/BF00304968
- Dinar, A., & Yaron, D. (1992). Adoption and abandonment of irrigation technologies. Agricultural Economics, 6(4), 315–332. https://doi.org/10.1111/j.1574-0862.1992.tb00191.x
- Doss, C. R. (2006). Analyzing technology adoption using microstudies: Limitations, challenges, and opportunities for improvement. Agricultural Economics, 34(3), 207–219. https://doi.org/10.1111/j.1574-0864.2006.00119.x
- Faurès, J. M., Svendsen, M., Turral, H., Berkhoff, J., Bhattarai, M., Caliz, A., Darghouth, S., Doukkali, M., El-Kady, M., Facon, T., Gopalakrishnan, M., Groenfeldt, D., Hoanh, C. T., Hussain, I., Jamin, J. Y., Konradsen, F., Leon, A., Meinzen-Dick, R. S., Miller, K., Mirza, M., ... Zhanyi, G. (2007). Reinventing irrigation. In D. Molden (Ed.), Water for food, water for life: A comprehensive assessment of water management in agriculture (pp. 353–394). IWMI, Earthscan. Retrieved May 15, 2019, from https://hdl.handle.net/10568/36873
- Feder, G., Just, R. E., & Zilberman, D. (1985). Adoption of agricultural innovations in developing countries: A survey. Economic Development and Cultural Change, 33(2), 255–298. https://doi.org/10.1086/451461
- Fiebig, A., & Dodd, I. C. (2016). Inhibition of tomato shoot growth by over‐irrigation is linked to nitrogen deficiency and ethylene. Physiologia Plantarum, 156(1), 70–83. https://doi.org/10.1111/ppl.12343
- Food and Agriculture Organization of the United Nations. (2012). Coping with water scarcity: An action framework for agriculture and food security (FAO water report 38). FAO. Retrieved April 15, 2019, from http://www.fao.org/3/a-i3015e.pdf
- Food and Agriculture Organization of the United Nations. (2016a). Water withdrawal by sector, around 2010. AQUASTAT database. FAO. Retrieved April 10, 2019, from http://www.fao.org/nr/water/aquastat/tables/WorldData-Withdrawal_eng.pdf
- Food and Agriculture Organization of the United Nations. (2016b). AQUASTAT main database. FAO. Retrieved June 18, 2019, from http://www.fao.org/nr/water/aquastat/data/query/results.html
- Food and Agriculture Organization of the United Nations. (2016c). AQUASTAT database: Area equipped for irrigation and percentage of cultivated land. FAO. Retrieved June 6, 2019, from http://www.fao.org/nr/water/aquastat/tables/WorldData-Irrigation_eng.pdf
- Foster, A. D., & Rosenzweig, M. R. (2010). Microeconomics of technology adoption. Annual Review of Economics, 2(1), 395–424. https://doi.org/10.1146/annurev.economics.102308.124433
- Frisvold, G., & Bai, T. (2016). Irrigation technology choice as adaptation to climate change in the western United States. Journal of Contemporary Water Research and Education, 158(1), 62–77. https://doi.org/10.1111/j.1936-704X.2016.03219.x
- Gleick, P. H. (2000). A look at twenty-first century water resources development. Water International, 25(1), 127–138. https://doi.org/10.1080/02508060008686804
- Gleick, P. H. (2003). Global freshwater resources: Soft-path solutions for the 21st century. Science, 302(5650), 1524–1528. https://doi.org/10.1126/science.1089967
- Grafton, R. Q., & Wheeler, S. A. (2015). Water economics. In R. Halvorsen & D. Layton (Eds.), Handbook on the Economics of Natural Resources (1st ed., pp. 401–420). Edward Elgar.
- Grafton, R.Q., Williams, J., Perry, C. J., Molle, F., Ringler, C., Steduto, P., Udall, B., Wheeler, S. A., Wang, Y., Garrick, D., & Allen, R. G. (2018). The paradox of irrigation efficiency. Science, 361(6404), 748–750. doi:10.1126/science.aat9314
- Gregg, D., & Wheeler, S. A. (2018). How can we value an environmental asset that very few have visited or heard of? Lessons learned from applying contingent and inferred valuation in an Australian wetlands case study. Journal of Environmental Management, 220, 207–216. https://doi.org/10.1016/j.jenvman.2018.04.116
- Haensch, J., Wheeler, S. A., & Zuo, A. (2019). Do neighbors influence irrigators’ permanent water selling decisions in Australia? Journal of Hydrology, 572, 732–744. https://doi.org/10.1016/j.jhydrol.2019.03.023
- Hill, R. V., Hoddinott, J., & Kumar, N. (2013). Adoption of weather‐index insurance: Learning from willingness to pay among a panel of households in rural Ethiopia. Agricultural Economics, 44(4–5), 385–398. https://doi.org/10.1111/agec.12023
- Hite, D., Hudson, D., & Intarapapong, W. (2002). Willingness to pay for water quality improvements: The case of precision application technology. Journal of Agricultural and Resource Economics, 27(2), 433–449. doi:10.22004/ag.econ.31120
- Hounkonnou, D., Kossou, D., Kuyper, T., Leeuwis, C., Nederlof, E. S., Röling, N., Sakyi-Dawson, O., Traoré, M., & Van Huis, A. (2012). An innovation systems approach to institutional change: Smallholder development in West Africa. Agricultural Systems, 108, 74–83. https://doi.org/10.1016/j.agsy.2012.01.007
- Hussain, I., Mudasser, M., Hanjra, M. A., Amrasinghe, U., & Molden, D. (2004). Improving wheat productivity in Pakistan: Econometric analysis using panel data from Chaj in the upper Indus basin. Water International, 29(2), 189–200. https://doi.org/10.1080/02508060408691768
- Jones, H. G. (2004). Irrigation scheduling: Advantages and pitfalls of plant based methods. Journal of Experimental Botany, 55(407), 2427–2436. https://doi.org/10.1093/jxb/erh213
- Kerr, G. (2001) Contingent valuation elicitation effects: Revisiting the payment card. Paper presented at the 45th Australian agricultural and resource economics society conference, January 23–25, Adelaide, Australia. Retrieved February 8, 2019, from https://ideas.repec.org/p/ags/aare01/125686.html
- Koundouri, P., Nauges, C., & Tzouvelekas, V. (2006). Technology adoption under production uncertainty: Theory and application to irrigation technology. American Journal of Agricultural Economics, 88(3), 657–670. https://doi.org/10.1111/j.1467-8276.2006.00886.x
- Li, C. Z., & Mattsson, L. (1995). Discrete choice under preference uncertainty: An improved structural model for contingent valuation. Journal of Environmental Economics and Management, 28(2), 256–269. https://doi.org/10.1006/jeem.1995.1017
- Lizarraga, A., Boesveld, H., Huibers, F., & Robles, C. (2003). Evaluating irrigation scheduling of hydroponic tomato in Navarra, Spain. Irrigation and Drainage, 52(2), 177–188. https://doi.org/10.1002/ird.86
- Lusk, J. L., & Norwood, F. B. (2009). An inferred valuation method. Land Economics, 85(3), 500–514. https://doi.org/10.3368/le.85.3.500
- Manero, A., Wheeler, S. A., Zuo, A., & Mdemu, M. (2019). Exploring the head versus tail‐end dichotomy on yield and farm incomes in smallholder irrigation schemes in Tanzania. Water Resources Research, 55(5), 4322–4342. doi:10.1029/2018WR023483
- Masud, M. M., Junsheng, H., Akhtar, R., Al-Amin, A. Q., & Kari, F. B. (2015). Estimating farmers’ willingness to pay for climate change adaptation: The case of the Malaysian agricultural sector. Environmental Monitoring and Assessment, 187(38), 1–12. https://doi.org/10.1007/s10661-014-4254-z
- Mdemu, M., Kissoly, L., Bjornlund, H., Kimaro, E., Christen, E. W., Van Rooyen, A., Stirzaker, R., & Ramshaw, P. (2020). The role of soil water monitoring tools and agricultural innovation platforms in improving food security and income of farmers in smallholder irrigation schemes in Tanzania. International Journal of Water Resources Development. doi:10.1080/07900627.2020.1765746
- Mdemu, M. V., Mziray, N., Bjornlund, H., & Kashaigili, J. J. (2017). Barriers to and opportunities for improving productivity and profitability of the Kiwere and Magozi irrigation schemes in Tanzania. International Journal of Water Resources Development 33(5), 725–739. doi:10.1080/07900627.2016.1188267
- Mitchell, R. C., & Carson, R. T. (1981). An experiment in determining willingness to pay for national water quality improvements (Draft report to the US Environmental Protection Agency). Retrieved January 15, 2019, from https://www.epa.gov/sites/production/files/2017-12/documents/ee-0011_1-5.pdf
- Moreno, G., & Sunding, D. L. (2005). Joint estimation of technology adoption and land allocation with implications for the design of conservation policy. American Journal of Agricultural Economics, 87(4), 1009–1019. https://doi.org/10.1111/j.1467-8276.2005.00784.x
- Moyo, M., Van Rooyen, A., Bjornlund, H., Parry, K., Stirzaker, R., Dube, T., & Maya, M. (2020). The dynamics between irrigation frequency and soil nutrient management: Transitioning small scale irrigation towards more profitable and sustainable systems in Zimbabwe. International Journal of Water Resources Development. doi:10.1080/07900627.2020.1739513
- Moyo, M., Van Rooyen, A., Moyo, M., Chivenge, P., & Bjornlund, H. (2017). Irrigation development in Zimbabwe: Understanding productivity barriers and opportunities at Mkoba and Silalatshani irrigation schemes. International Journal of Water Resources Development, 33(5), 740–754. https://doi.org/10.1080/07900627.2016.1175339
- Mwamakamba, S. N., Sibanda, L. M., Pittock, J., Stirzaker, R., Bjornlund, H., Van Rooyen, A., Munguambe, P., Mdemu, M. V., & Kashaigili, J. J. (2017). Irrigating Africa: Policy barriers and opportunities for enhanced productivity of smallholder farmers. International Journal of Water Resources Development, 33(5), 824–838. https://doi.org/10.1080/07900627.2017.1321531
- Myeni, L., Moeletsi, M., & Clulow, A. (2019). Present status of soil moisture estimation over the African continent. Journal of Hydrology: Regional Studies, 21, 14–24. doi:10.1016/j.ejrh.2018.11.004
- Ostrom, E. (1990). Governing the commons: The evolution of institutions for collective action. Cambridge University Press. Retrieved December 18, 2019, from https://wtf.tw/ref/ostrom_1990.pdf
- Pannell, D. J., Marshall, G. R., Barr, N., Curtis, A., Vanclay, F., & Wilkinson, R. (2006). Understanding and promoting adoption of conservation practices by rural landholders. Australian Journal of Experimental Agriculture, 46(11), 1407–1424. https://doi.org/10.1071/EA05037
- Parry, K., Van Rooyen, A., Bjornlund, H., Kissoly, L., Moyo, M., & de Sousa, W. (2020). The importance of learning processes in transitioning small scale irrigation schemes. International Journal of Water Resources Development. doi:10.1080/07900627.2020.1767542
- Pittock, J., Bjornlund, H., Stirzaker, R., & Van Rooyen, A. (2017). Communal irrigation systems in South-Eastern Africa: Findings on productivity and profitability. International Journal of Water Resources Development, 33(5), 839–847. https://doi.org/10.1080/07900627.2017.1324768
- Pittock, J., Ramshaw, P., Bjornlund, H., Kimaro, E., Mdemu, M., Moyo, M., Ndema, S., Van Rooyen, A., Stirzaker, R., & de Sousa, W. (2018). Transforming smallholder irrigation schemes in Africa (ACIAR monograph no. 202). Australian National University. Retrieved February 26, 2019, from https://www.aciar.gov.au/publication/Transforming-smallholder-irrigation-schemes-Africa
- Poudel, D., & Johnsen, F. H. (2009). Valuation of crop genetic resources in Kaski, Nepal: Farmers’ willingness to pay for rice landraces conservation. Journal of Environmental Management, 90(1), 483–491. https://doi.org/10.1016/j.jenvman.2007.12.020
- Powell, J. L. (1984). Least absolute deviations estimation for the censored regression model. Journal of Econometrics, 25(3), 303–325. https://doi.org/10.1016/0304-4076(84)90004-6
- Qaim, M., & De Janvry, A. (2003). Genetically modified crops, corporate pricing strategies and farmers’ adoption: The case of Bt cotton in Argentina. American Journal of Agricultural Economics, 85(4), 814–828. https://doi.org/10.1111/1467-8276.00490
- Reserve Bank of Australia. (2019). Exchange rates. RBA. Retrieved November 5, 2019, from https://www.rba.gov.au/statistics/frequency/exchange-rates.html
- Rogers, E. M. (1983). Diffusion of innovations (3rd ed.). The Free Press. Retrieved June 10, 2019, from https://teddykw2.files.wordpress.com/2012/07/everett-m-rogers-diffusion-of-innovations.pdf
- Schmidtner, E., Lippert, C., Engler, B., Häring, A. M., Aurbacher, J., & Dabbert, S. (2011). Spatial distribution of organic farming in Germany: Does neighbourhood matter? European Review of Agricultural Economics, 39(4), 661–683. https://doi.org/10.1093/erae/jbr047
- Stevens, J. B. (2006). Adoption of irrigation scheduling methods in South Africa. University of Pretoria.
- Stirzaker, R., Car, N., & Chilundo, M. (2014). A traffic light soil water sensor for resource poor farmers: Proof of concept (Final report FSC/2013/002). ACIAR. Retrieved February 11, 2019, from https://www.aciar.gov.au/node/12191
- Stirzaker, R., Mbakwe, I., & Mziray, N. R. (2017). A soil water and solute learning system for small-scale irrigators in Africa. International Journal of Water Resources Development, 33(5), 788–803. https://doi.org/10.1080/07900627.2017.1320981
- Stirzaker, R., & Pittock, J. (2014). The case for a new irrigation research agenda for sub-Saharan Africa. In J. Pittock, R. Q. Grafton, & C. Whit (Eds.), Water, food and agricultural sustainability in Southern Africa (1st ed., pp. 91–107). Tilde Publishing and Distribution.
- Sullivan, A., & Pittock, J. (2014). Agricultural policies and irrigation in Africa. In J. Pittock, R. Q. Grafton, & C. White (Eds.), Water, food and agricultural sustainability in Southern Africa (1st ed., pp. 30–54). Tilde Publishing and Distribution.
- Tobin, J. (1958). Estimation of relationships for limited dependent variables. Econometrica, 26(1), 24–36. https://doi.org/10.2307/1907382
- Toma, L., Barnes, A., Sutherland, L.-A., Thomson, S., Burnett, F., & Mathews, K. (2018). Impact of information transfer on farmers’ uptake of innovative crop technologies: A structural equation model applied to survey data. Journal of Technology Transfer, 43(4), 864–881. https://doi.org/10.1007/s10961-016-9520-5
- United Nations Department of Economic and Social Affairs. (2017). World population prospects: The 2017 revision, volume I: Comprehensive tables (ST/ESA/SER.A/399). UNDESA. Retrieved January 24, 2019, from https://esa.un.org/unpd/wpp/publications/Files/WPP2017_Volume-I_Comprehensive-Tables.pdf
- Van Ittersum, M. K., Van Bussel, L. G., Wolf, J., Grassini, P., Van Wart, J., Guilpart, N., Claessens, L., de Groot, H., Wiebe, K., Mason-D’Croz, D., Yang, H., Boogaard, H., Van Oort, P. A., Van Loon, M. P., Saito, K., Adimo, O., Adjei-Nsiah, S., Agali, A., Bala, A., Chikowo, R., ... Cassman, K. G. (2016). Can sub-Saharan Africa feed itself? Proceedings of the National Academy of Sciences, 113(52), 14964–14969. https://doi.org/10.1073/pnas.1610359113
- Van Rooyen, A. F., Ramshaw, P., Moyo, M., Stirzaker, R., & Bjornlund, H. (2017). Theory and application of agricultural innovation platforms for improved irrigation scheme management in Southern Africa. International Journal of Water Resources Development, 33(5), 804–823. https://doi.org/10.1080/07900627.2017.1321530
- Virtual Irrigation Academy. (2019). The tools. VIA. Retrieved June 14, 2019, from https://via.farm/the-tools/
- Vories, E., Stevens, W., Rhine, M., & Straatmann, Z. (2017). Investigating irrigation scheduling for rice using variable rate irrigation. Agricultural Water Management, 179, 314–323. https://doi.org/10.1016/j.agwat.2016.05.032
- Wanyoike, F., Mtimet, N., & Bett, B. (2019). Willingness to pay for a Rift valley fever (RVF) vaccine among Kenyan cattle producers. Preventive Veterinary Medicine, 171, 104763. https://doi.org/10.1016/j.prevetmed.2019.104763
- Wheeler, S. A., Zuo, A., Bjornlund, H., Mdemu, M. V., Van Rooyen, A., & Munguambe, P. (2017). An overview of extension use in irrigated agriculture and case studies in South-Eastern Africa. International Journal of Water Resources Development, 33(5), 755–769. https://doi.org/10.1080/07900627.2016.1225570
- Willis, K. G. (2014). The use of stated preference methods to value cultural heritage. In V. A. Ginsburgh & D. Throsby (Eds.), Handbook of the Economics of Art and Culture (Vol. 2, pp. 145–181). Elsevier.
- Woolcock, M., & Narayan, D. (2000). Social capital: Implications for development theory, research, and policy. World Bank Research Observer, 15(2), 225–249. https://doi.org/10.1093/wbro/15.2.225
- You, L. Z. (2008). Africa: Irrigation investment needs in sub-Saharan Africa: Africa infrastructure country diagnostic background paper no. 9. World Bank. Retrieved March 8, 2018, from http://hdl.handle.net/10986/7870
Appendix A.
Summary statistics of WTP for access to monitoring tools
Appendix B.
Cumulative distribution of irrigators’ total WTP for monitoring tools (n = 234)