Abstract
Objective. The interaction between left ventricular (LV) apical rotation, blood pressure (BP) and body mass in elderly females may reveal mechanisms involved in the syndrome of diastolic heart failure. Methods. Thirty‐one healthy females, age 69–84 years, were studied with echocardiography, ambulatory BP and an exercise capacity (VO2peak) test. Results. LV apical short‐axis loops were eligible for speckle tracking analysis in 27 subjects. Peak apical rotation (PAR) correlated inversely with diastolic BP (r = −0.47, p = 0.01). PAR correlated positively with stroke volume and body weight (p<0.05), but not with VO2peak (n = 19, p = ns). PAR also correlated with peak rotation velocity in systole (r = 0.76, p<0.0001) and in diastole (r = 0.58, p = 0.001). Diastolic peak rotation velocity correlated with mitral E wave peak velocity (r = 0.48, p = 0.01). There was a significant reduction in LV volumes during the 4 years of follow‐up. Conclusions. In healthy elderly females, there seems to be an interaction between LV apical rotation, BP and body mass. Peak apical rotation and peak diastolic rotation velocity correlate with indices of LV filling and ejection, indicating that suction, a crucial element for effective early LV filling, may be preserved in healthy elderly subjects. Suction deteriorates with elevations of the arterial BP. An age‐ and BP‐related reduction in LV end‐diastolic volume may represent an additional impediment to LV filling. Both features may contribute to the development of LV diastolic dysfunction and to episodes of diastolic heart failure.
Introduction
Left ventricular (LV) torsion, the opposite rotation of apical with respect to basal LV segments, is an important determinant of LV filling and emptying Citation[1–3]. The non‐invasive assessment of rotation can be accomplished both with magnetic resonance imaging (MRI) Citation[4], and with echocardiographic techniques Citation[5], Citation[6]. Tissue Doppler imaging (TDI) has good temporal resolution, but the results are angle‐dependent. Two‐dimensional (2D) speckle tracking Citation[7–11] is especially suitable for the analysis of LV short‐axis images, since it is angle‐independent. Although there is accumulating evidence on how aging and disease influence LV torsion Citation[12–15], the relationship between the arterial blood pressure (BP) and LV torsion has not been studied previously. The interaction between the arterial BP and indices of LV function in elderly females may throw light on mechanisms involved in the syndrome of diastolic heart failure Citation[16].
In the present study, we used echocardiography to assess LV myocardial motion patterns in elderly females. The aim was to explore mechanisms involved in LV filling and relate such mechanisms to BP and exercise capacity. In an effort to reduce the influence of confounding factors, a homogeneous group of participants was selected.
Methods
Study participants
The first phase of this study, which was conducted 4 years earlier, included healthy females (n = 35), 65–80 years of age, 160–170 cm in height, and weighing 60–70 kg, who had no known disease and did not take any medications Citation[17]. In the present study, which is a follow‐up study, four participants were excluded for the following reasons: (i) unwillingness to participate, (ii) one participant had developed cancer, (iii) one participant developed permanent atrial fibrillation, and (iv) one participant had aortic insufficiency that increased since the first phase of the study. The remaining 31 participants, 69–84 years of age, constituted the study group. High BP was not considered an exclusion criterion. Blood tests ruled out diabetes mellitus or renal failure in all of the participants. Each study participant gave written informed consent. The study was approved by the local scientific ethical committee.
Echocardiography
The performance of the echocardiographic study has been described earlier Citation[17]. In this follow‐up study, there was special emphasis on recording high quality 2D grey‐scale images for the purpose of speckle tracking analysis; 2D images, colour TDI, and pulsed‐wave Doppler recordings of aortic and transmitral flow velocities were obtained from the parasternal and apical windows. Short‐axis recordings of the LV base were obtained between the tip of the papillary muscles and the mitral valve. In some participants, a slightly more apical level was necessary to optimize image quality. Apical recordings were obtained at a level where the lumen was almost obliterated during contraction. A Vivid 7 ultrasound machine with a M3S or M4S probe (GE Vingmed, Horten, Norway) was used for recordings and EchoPAC software; version 6.1.0 (GE Vingmed, Horten, Norway) was used for analysis.
Analysis of conventional Doppler echocardiography
LV dimensions were measured on 2D parasternal long‐axis images. LV ejection fraction (EF) was measured on apical four‐chamber images using the Simpson method. Ejection time (ET) and stroke volume (SV) were calculated from Doppler recordings of the maximal velocity of aortic root flow and averaged in at least three cardiac cycles. The peak velocities of early (E) and late (A) transmitral flow, and the peak velocity of systolic (S) and diastolic (D) pulmonary venous flow were measured. The onset of the QRS signal or a defined point close to the onset of the QRS was used for estimating the following time sequences: the time to start (TsE) and the time to peak (TpE) early transmitral flow. The acceleration time of early transmitral flow was calculated as the difference between TpE and TsE. The acceleration of early transmitral flow was calculated as the ratio of the peak E velocity and the E acceleration time. The deceleration time of early transmitral flow velocity (E‐dec) was measured. The time difference between start of flow and peak flow defined the acceleration time of aortic root flow. All measures were averaged in three cardiac cycles.
Analysis with 2D speckle tracking
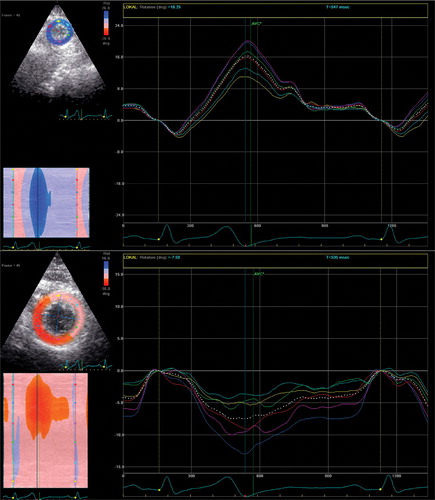
Speckle tracking analysis of 2D echocardiographic images Citation[7–13] was performed on high frame rate (80–110 frames/s) parasternal short‐axis images of the LV basal and apical segments. When viewed from the apex, anti‐clockwise rotation was defined as positive (Figure ). One cardiac cycle was selected for analysis. The endocardial border of the end‐systolic frame on each short‐axis plane was traced manually. The region of interest included the entire LV wall thickness. The software divides each LV short‐axis plane automatically into six segments. Each segment is assigned a colour code, indicating whether the quality is acceptable. All segments were, in addition, assessed visually. Subsequently the software calculated the circumferential rotation and rotation rates for each segment. Averaged rotation and rotation rate from the six segments was used for the calculation of peak rotation and peak velocity of rotation in systole and in diastole.
Figure 1 Speckle tracking analysis of short‐axis images showing anti‐clockwise (positive) rotation in the LV apical region (top) and clockwise (negative) rotation in the basal region (bottom).
Analysis of tissue Doppler echocardiography
Myocardial motion was assessed by measuring velocities on colour TDI with frame rates of 100–180/s. The peak myocardial long‐axis velocities in systole (Sm), early diastole (Em) and late diastole were averaged in the six basal segments of the standard 16‐segment LV model. The time to start (TsEm) and the time to peak (TpEm) LV lengthening were assessed in the basal segments.
Blood pressures
Ambulatory BP monitoring (SunTech's Accutracker II, SunTech Medical Instruments Inc., Raleigh, NC, USA) was performed in all study participants. Ambulatory daytime BP was calculated as the average of measurements performed two times each hour between 06:00 and 23:00 h. BPs were also measured by a nurse using a mercury sphygmomanometer and a cuff on the right arm.
Exercise testing
After a 10‐min warm‐up period, a peak aerobic oxygen (VO2peak) test (using MetaMax II Cortex, Leipzig, Germany) was performed using an individualized treadmill ramp protocol with an individualized constant band speed and increased inclination by 2% when oxygen uptake stabilized at each workload until VO2peak was reached. A levelling‐off of oxygen uptake despite an increased workload and a respiratory exchange ratio>1.05 were used as criteria for maximal oxygen uptake Citation[18]. The results are by definition the peak oxygen uptake (VO2peak).
Statistics
Data are presented as mean±standard deviation. Relationships between variables were tested with linear regression analysis and Pearson's coefficient of correlation. Differences between groups were tested by a two‐tailed Student t‐test for unpaired and paired data once normality was demonstrated; otherwise, a non‐parametric test was used. Intra‐ and inter‐observer variability was assessed by determining the coefficient of variation, i.e. repeated and independent speckle tracking analysis of the apical short‐axis loops of the 27 participants with satisfactory recordings.
Results
Characteristics of study participants
Group characteristics are provided in Table . The range of LV EF was 52–85%.
Table I. Characteristics of study subjects (n = 31).
Time sequences in the cardiac cycle
The time sequences were as follows (mean±SD): the time to peak basal rotation, 356±38 ms; the time to aortic valve closure (TAVC), 372±27 ms; the time to peak apical rotation (PAR), 382±38 ms; the TsEm, 454±36 ms; and the TsE, 463±35 ms.
Correlations with PAR and PAR‐velocity
Echocardiographic recordings of the LV basal and apical short‐axis were eligible for speckle tracking analysis in 23 and 27 participants, respectively. PAR correlated inversely with peak basal rotation (r = −0.47, p = 0.04) and with ambulatory (Figure ) and conventional diastolic BP (DBP; r = −0.46, p = 0.03), but not significantly with the respective systolic BP (SBP). PAR correlated with SV (Figure ), peak velocity of aortic root flow (r = 0.40, p = 0.045), aortic root flow velocity time integral (VTI; r = 0.44, p = 0.023) and acceleration time of early transmitral flow (Figure ), but not significantly with peak mitral E wave velocity (r = 0.34, p = 0.08) or peak velocity of early LV lengthening (Em) or with E/Em. PAR correlated significantly with body weight (r = 0.55, p = 0.003) and with body surface area (BSA), but not with body height. There was a significant correlation between body weight and SV (r = 0.5, p = 0.004).
Figure 2 Correlation between peak apical rotation and acceleration time of early transmitral flow, TpE–TsE (top left), stroke volume, SV (top right), ambulatory diastolic blood pressure, Amb DBP (bottom left), and body surface area, BSA (bottom right).
PAR also correlated with systolic and diastolic PAR‐velocity (r = 0.76, p<0.0001 and r = 0.58, p = 0.001). Systolic PAR‐velocity correlated with diastolic PAR‐velocity (r = 0.53, p = 0.003). Diastolic PAR‐velocity correlated with peak mitral E wave velocity (r = 0.48, p = 0.01), E/A (r = 0.43, p = 0.03), peak velocity of diastolic pulmonary venous flow (r = 0.38, p = 0.048), and inversely with the time difference between aortic valve closure and the start of LV lengthening (TsEm‐TAVC; r = −0.44, p = 0.02), and with LV septal thickness (r = −0.43, p = 0.03), but did not correlate significantly with Em (r = 0.33, p = 0.09).
Correlations with age
Age correlated with ambulatory SBP and DBP (r = 0.36, p = 0.049 and r = 0.37, p = 0.043), LV end‐diastolic diameter (r = −0.48, p = 0.006), TsE (r = 0.44, p = 0.01), peak velocity of late transmitral flow (A; r = 0.51, p = 0.003), E/A (r = −0.48, p = 0.007), peak velocity of diastolic pulmonary venous flow (D; r = −0.44, p = 0.01), S/D (r = 0.43, p = 0.02), time difference between aortic valve closure and TsEm‐TAVC (r = 0.41, p = 0.02), TsEm (r = 0.48, p = 0.006), peak velocity of early LV long‐axis lengthening (Em; r = −0.44, p = 0.01), and with E/Em (r = 0.37, p = 0.04).
Aerobic exercise capacity
Nine participants were, for varying reasons, not willing to participate in the aerobic exercise capacity test. The analysis was based on the results of the 19 subjects who performed a maximum test Citation[18]. Mean age, mean ambulatory and mean cuff BP were lower in these subjects compared to the subjects who did not perform the test or did not achieve a maximum test (n = 12; 73 vs 77 years and 130/71 mmHg vs 138/76 mmHg, p<0.05). The groups did not differ concerning BSA, E/Em and Sm (p = ns). The VO2peak (n = 19) correlated positively with the acceleration time of aortic root flow (r = 0.46, p = 0.04) and inversely with the peak velocity of LV long‐axis shortening (Sm; r = −0.48, p = 0.036), the peak velocity of systolic pulmonary venous flow (S; r = −0.73, p<0.0001), and the acceleration of early mitral flow (r = −0.5, p = 0.03). There was no significant correlation of VO2peak with E/Em or PAR (p = ns).
Differences between the first phase and follow‐up
A comparison of values obtained in the first phase and in the follow‐up study was performed for the following parameters (mean±SD): body weight (1.1±4.5 kg, p = ns), ambulatory daytime SBP and DBP (7±13 mmHg, p = 0.007 and 2.8±7.5 mmHg, p = 0.049), LV end‐diastolic volume (−9.7±12 ml, p<0.0001), LV end‐systolic volume (−8.6±8.9 ml, p<0.0001), SV (0.5±12 ml, p = ns), peak velocity of mitral E wave (−6.4±12 cm/s, p = 0.005), peak velocity of early LV lengthening (Em; 0.1±1.7 cm/s, p = ns), E/Em (−2.2±5.2, p = 0.03).
Repeatability analysis
The intra‐observer coefficient of variation (%CV) obtained by comparison of the repeated analysis of PAR was 12%. The corresponding inter‐observer CV was 29%. The mean difference between the assessments obtained by two observers was 0.4±5°, p = ns.
Discussion
In the present study, LV apical rotation was used as a surrogate for LV torsion. One reason was the substantially larger portion of high quality recordings of the apex compared to the base. Another reason was the assumption that apical rotation is the more important determinant of LV global function. The different quality of apical and basal recordings may be a consequence of the vicinity of the apex to the chest wall and the fact that the apex is fixed while the basis moves in and out of the image plane during the cardiac cycle.
At the end of contraction, the LV tends to expand due to restoring forces Citation[1–4], Citation[19–24]. During isovolumetric relaxation, LV expansion seems to progress from the apex towards the base Citation[25], Citation[26], with redistribution of blood from the base towards the apex. With mitral valve opening, blood is sucked into the LV, causing rapid acceleration and high velocity of transmitral flow (E wave), which is typical for young subjects Citation[27], Citation[28]. Since, in our study, peak apical rotation correlated with SV, it could be argued that a high degree of apical rotation is associated with increased venous return, which is most probably due to suction and not to an augmented filling pressure. This view is supported by the correlation between the peak diastolic rotation velocity and the peak E wave velocity Citation[29]. Hence, suction may contribute to LV filling also in the elderly and a high E/A ratio in elderly subjects should not always be interpreted as a sign of increased filling pressures.
It is our hypothesis that the LV SV links apical rotation to body weight Citation[30]. In distinction to young subjects, who may increase SV by increasing end‐diastolic volume, LV dilatation may be inhibited in the elderly because of stiffer myocardium. The need for a larger SV in elderly subjects thus depends more on ventricular emptying, thereby explaining a higher degree of peak apical rotation in elderly subjects with larger body mass. Increased emptying of a small LV may also explain the high EF frequently observed in elderly females. It is noteworthy that LV end‐diastolic volume decreased significantly during 4 years of follow‐up. The significant inverse correlation between LV end‐diastolic diameter and age in the follow‐up study is also of note. A reduction of LV compliance, due to an age‐related reduction of LV cavity dimensions, may contribute to the development of diastolic heart failure Citation[16].
The attempt to interpret a potential influence of the arterial BP on LV function in a clinical setting is challenging. The effect of arterial stiffening on the pulse pressure must, for example, be regarded Citation[31]. Hence, for a given SV, an elevation of the systolic pressure is accompanied by a reduction in the diastolic pressure Citation[31]. Variations in the SV may complicate the matter further. Although stiffening of the arterial wall is accepted as the main reason for a wider pulse pressure in elderly subjects, the SV may play an additional role. Indeed, the relationship between LV peak apical rotation and the arterial BP could be influenced by alterations in the SV. Other determinants of the pulse pressure, like the geometry of the proximal aorta, should also be considered. It is also necessary to consider the discrepancy between the instantaneous pressure in the proximal aortic and the average daytime brachial artery pressure.
With these considerations in mind, it may be discussed whether the finding of an inverse correlation between peak apical rotation and the DBP indicates an interaction between apical rotation and afterload. It is of note that peak apical rotation correlated significantly with DBP obtained with two independent methods. It is intriguing, however, that the correlation was significant for the DBP and not for the SBP, since the systolic pressure is a more important determinant of afterload Citation[32], Citation[33]. An alternative explanation is that the DBP is a marker of LV remodelling in this particular population. The influence of afterload on LV torsion has been investigated in several earlier studies Citation[34–38]. A reduced untwisting velocity associated with LV hypertrophy that has been found in some recent studies Citation[14], Citation[39] is in agreement with the inverse correlation between LV septal thickness and diastolic apical rotation velocity in the present study. Hence, increased arterial BP and the associated LV remodelling contribute to impede early LV filling. Acute elevations in the arterial BP and tachyarrhythmias, especially rapid atrial fibrillation, may aggravate LV filling disorders and thereby inducing acute heart failure.
LV peak apical rotation was not a predictor of peak aerobic exercise capacity in the group of subjects that completed the exercise test in our study. It may also be of interest that the VO2peak did not correlate with resting indices of LV filling pressures, such as E/Em Citation[40]. The physiological meaning of the relative strong inverse correlation between peak apical rotation and the peak velocity of systolic pulmonary venous flow velocity is uncertain. In fact, it is important to emphasize that resting indices of LV function that are commonly interpreted as evidence of excellent myocardial contractility, such as a well preserved SV and EF, could be a result of increased inotropic stimulation or a higher demand. However, the number of subjects that completed the exercise test was small and the results need to be confirmed in a larger study.
Limitations of the study
Several limitations of the study deserve comments. The small study population is of concern. It was not the intention to perform a large study since only one investigator should do all the echocardiographic examinations, i.e. the same investigator performed all examinations both in the first phase and in the follow‐up study. The intention was to include at least 50 subjects into the study. The estimation of that sample size was partly based on the assumption that there would be large variations in BP between healthy elderly females. In fact, we were surprised to find that a large part of the study subjects were normotensive. An additional reason for the limited sample size was that relative few subjects responded to our advertisement.
The weak correlations obtained in the study limit the predictive value of parameters for individual patients. It was, however, not the intention to derive values that could be used for individual subjects. In fact, we consider it a pilot study. The assumptions, suggestions, hypothesis and explanations that we have proposed must be seen in that light. It is our hope that some of the findings may be further explored for physiological and clinical relevance in future studies.
The lack of a control group could also be of concern. The most important reason for not including a control group was, in addition to factors mentioned above, that the aim of the study was to compare characteristics of LV function in a homogeneous group of untreated healthy elderly females.
The varying frame rates used in different recordings and by using different echocardiographic techniques may represent a potential source of error. Differences in frame rate may especially influence the estimation of the time sequences. The time sequences measured with by speckle tracking are, for example, less accurate than time sequences measured with TDI. Variations in heart rate between recordings represent a similar problem.
In the present study, we used E/Em as a surrogate for E/Ea Citation[40]. Whereas Em, as used in this study, is the peak velocity measured in the basal LV segments using colour TDI, the Ea is the peak velocity of the mitral annulus using spectral TDI. Although there is reason to anticipate that these variables are expressions of similar physiological properties, there is a need to underline that only E/Ea has been validated as an index of LV filling pressure Citation[40].
Spectral Doppler measures peak velocities and colour Doppler, using a method called autocorrelation, measures mean velocities Citation[41], Citation[42]. Since we used both methods in 30 subjects in the first phase of this project, we found that colour TDI, compared to spectral TDI, underestimated Sm and Em in septal and lateral segments, by 20% and 37% and by 20% and 31%, respectively. Although these differences are important for the estimated peak velocities and for the calculation of E/Em, it is unclear how they relate to the assessment of time sequences. However, the start of Em is possibly better defined with colour TDI than with spectral TDI. In the cases where the start of the time sequence is poorly defined, colour TDI allows to slide the region of interest along the wall in an effort to define the starting point more clearly, also during post processing.
In the first phase of this study, we used M‐mode echocardiography for the estimation of LV dimensions, except for LV volumes. In the follow‐up study, all dimensions were calculated with 2D echocardiography because of difficulties achieving M‐mode perpendicular to the LV walls. Comparison of LV short‐axis dimensions and LV mass between the first phase and the follow‐up must therefore be performed with this in mind.
In conclusion, in healthy elderly females, there seems to be an interaction between LV apical rotation, BP and body mass. Peak apical rotation and peak diastolic rotation velocity correlate with indices of LV filling and ejection, indicating that suction, a crucial element for effective early LV filling, may be preserved in healthy elderly subjects. Suction deteriorates with elevations of the arterial BP. An age‐ and BP‐related reduction in LV end‐diastolic volume may represent an additional impediment to LV filling. Both features may contribute to the development of LV diastolic dysfunction and to episodes of diastolic heart failure.
Acknowledgements
We thank Brage Amundsen, MD, for his contribution to the speckle tracking analysis of echocardiographic data.
References
- Rademakers F. E., Buchalter M. B., Rogers W. J., Zerhouni E. A., Weisfeldt M. L., Weiss J. L., et al. Dissociation between left ventricular untwisting and filling: Accentuation by catecholamines. Circulation 1992; 85: 1572–81
- Bell S. P., Nyland L., Tischler M. D., McNabb M., Granzier H., LeWinter M. M. Alterations in the determinants of diastolic suction during pacing tachycardia. Circ Res 2000; 87: 235–40
- Ashikaga H., Criscione J. C., Omens J. H., Covell J. W., Ingels N. B Jr. Transmural left ventricular mechanics underlying torsional recoil during relaxation. Am J Physiol 2004; 286: H640–7
- Dong S. J., Hees P. S., Siu C. O., Weiss J. L., Shapiro E. P. MRI assessment of LV relaxation by untwisting rate: A new isovolumic phase measure of tau. Am J Physiol Heart Circ Physiol 2001; 281: H2002–9
- Rothfeld J. M., LeWinter M. M., Tischler M. D. Left ventricular systolic torsion and early diastolic filling by echocardiography in normal humans. Am J Cardiol 1998; 81: 1465–9
- Notomi Y., Martin‐Miklovic M. G., Oryszak S. J., Shiota T., Deserranno D., Popovic Z. B., et al. Enhanced ventricular untwisting during exercise: A mechanistic manifestation of elastic recoil described by Doppler tissue imaging. Circulation 2006; 113: 2524–33
- Leitman M., Lysyansky P., Sidenko S., Shir V., Peleg E., Binenbaum M., et al. Two‐dimensional strain‐a novel software for real‐time quantitative echocardiographic assessment of myocardial function. J Am Soc Echocardiogr 2004; 17: 1021–9
- Helle‐Valle T., Crosby J., Edvardsen T., Lyseggen E., Amundsen B. H., Smith H. J., et al. New noninvasive method for assessment of left ventricular rotation: Speckle tracking echocardiography. Circulation 2005; 112: 3149–56
- Amundsen B. H., Helle‐Valle T., Edvardsen T., Torp H., Crosby J., Lyseggen E., et al. Noninvasive myocardial strain measurement by speckle tracking echocardiography: Validation against sonomicrometry and tagged magnetic resonance imaging. J Am Coll Cardiol 2006; 47: 789–93
- Notomi Y., Lysyansky P., Setser R. M., Shiota T., Popovic Z. B., Martin‐Miklovic M. G., et al. Measurement of ventricular torsion by two‐dimensional ultrasound speckle tracking imaging. J Am Coll Cardiol 2005; 45: 2034–41
- Kim H. K., Sohn D. W., Lee S. E., Choi S. Y., Park J. S., Kim Y. J., et al. Assessment of left ventricular rotation and torsion with two‐dimensional speckle tracking echocardiography. J Am Soc Echocardiogr 2007; 20: 45–53
- Nakai H., Takeuchi M., Nishikage T., Kokumai M., Otani S., Lang R. M. Effect of aging on twist‐displacement loop by 2‐dimensional speckle tracking imaging. J Am Soc Echocardiogr 2006; 19: 880–5
- Takeuchi M., Nishikage T., Nakai H., Kokumai M., Otani S., Lang R. M. Age‐related changes in left ventricular twist assessed by two‐dimensional speckle‐tracking imaging. J Am Soc Echocardiogr 2006; 19: 1077–84
- Nagel E., Stuber M., Burkhard B., Fischer S., Scheidegger M., Boesiger P., et al. Cardiac rotation and relaxation in patients with aortic valve stenosis. Eur Heart J 2000; 21: 582–9
- Tibayan F. A., Rodriguez F., Langer F., Zasio M. K., Bailey L., Liang D., et al. Alterations in left ventricular torsion and diastolic recoil after myocardial infarction with and without chronic ischemic mitral regurgitation. Circulation 2004; 110: II109–14
- Paulus W. J., Tschöpe C., Sanderson J. E., Rusconi C., Flachskampf F. A., Rademakers F. E., et al. How to diagnose diastolic heart failure: A consensus statement on the diagnosis of heart failure with normal left ventricular ejection fraction by the Heart Failure and Echocardiography Associations of the European Society of Cardiology. Eur Heart J 2007; 28: 2539–50
- Soma J., Dahl K., Widerøe T. E. Tissue Doppler imaging of the left ventricle in healthy elderly females does not support the concept of “isolated” diastolic dysfunction. Blood Press 2005; 14: 93–8
- Wisloff U., Stoylen A., Loennechen J. P., Bruvold M., Rognmo O., Haram P. M., et al. Superior cardiovascular effect of aerobic interval training versus moderate continuous training in heart failure patients: A randomized study. Circulation 2007; 115: 3086–94
- Nikolic S., Yellin E. L., Tamura K., Vetter H., Tamura T., Meisner J. S., et al. Passive properties of canine left ventricle: Diastolic stiffness and restoring forces. Circ Res 1988; 62: 1210–22
- Cheng C. P., Igarashi Y., Little W. C. Mechanism of augmented rate of left ventricular filling during exercise. Circ Res 1992; 70: 9–19
- Ingels N. B Jr., Daughters G. T 2nd., Nikolic S. D., DeAnda A., Moon M. R., Bolger A. F., et al. Left atrial pressure‐clamp servomechanism demonstrates LV suction in canine hearts with normal mitral valves. Am J Physiol 1994; 267: H354–62
- Greenberg N. L., Vandervoort P. M., Firstenberg M. S., Garcia M. J., Thomas J. D. Estimation of diastolic intraventricular pressure gradients by Doppler M‐mode echocardiography. Am J Physiol Heart Circ Physiol 2001; 280: H2507–15
- Firstenberg M. S., Smedira N. G., Greenberg N. L., Prior D. L., McCarthy P. M., Garcia M. J., et al. Relationship between early diastolic intraventricular pressure gradients, an index of elastic recoil, and improvements in systolic and diastolic function. Circulation 2001; 104 Suppl I: 330–5
- Courtois M., Kovacs S. J Jr., Ludbrook P. A. Transmitral pressure‐flow velocity relation: Importance of regional pressure gradients in the left ventricle during diastole. Circulation 1988; 78: 66–671
- Sengupta P. P., Khandheria B. K., Korinek J., Wang J., Jahangir A., Seward J. B., et al. Apex‐to‐base dispersion in regional timing of left ventricular shortening and lengthening. J Am Coll Cardiol 2006; 47: 163–72
- Sengupta P. P., Korinek J., Belohlavek M., Narula J., Vannan M. A., Jahangir A., et al. Left ventricular structure and function: Basic science for cardiac imaging. J Am Coll Cardiol 2006; 48: 1988–2001
- Thomas J. D., Choong C. Y., Flachskampf F. A., Weyman A. E. Analysis of the early transmitral Doppler velocity curve: Effect of primary physiologic changes and compensatory preload adjustment. J Am Coll Cardiol 1990; 16: 644–55
- Oh J. K., Hatle L., Tajik A. J., Little W. C. Diastolic heart failure can be diagnosed by comprehensive two‐dimensional and Doppler echocardiography. J Am Coll Cardiol 2006; 47: 500–6
- Notomi Y., Popovic Z. B., Yamada H., Wallick D. W., Martin M. G., Oryszak S. J., et al. Ventricular untwisting: A temporal link between left ventricular relaxation and suction. Am J Physiol Heart Circ Physiol 2008; 294: H505–13
- de Simone G., Devereux R. B., Daniels S. R., Mureddu G., Roman M. J., Kimball T. R., et al. Stroke volume and cardiac output in normotensive children and adults. Assessment of relations with body size and impact of overweight. Circulation 1997; 95: 1837–43
- Dart A. M., Kingwell B. A. Pulse pressure – A review of mechanisms and clinical relevance. J Am Coll Cardiol 2001; 37: 975–84
- Milnor W. R. Arterial impedance as ventricular afterload. Circ Res 1975; 36: 565–70
- Brutsaert D. L., Sys S. U. Relaxation and diastole of the heart. Physiol Rev 1989; 69: 1228–315
- Arts T., Meerbaum S., Reneman R. S., Corday E. Torsion of the left ventricle during the ejection phase in the intact dog. Cardiovasc Res 1984; 18: 183–93
- Gibbons Kroeker C. A., Tyberg J. V., Beyar R. Effects of load manipulations, heart rate, and contractility on left ventricular apical rotation. An experimental study in anesthetized dogs. Circulation 1995; 92: 130–41
- MacGowan G. A., Burkhoff D., Rogers W. J., Salvador D., Azhari H., Hees P. S., et al. Effects of afterload on regional left ventricular torsion. Cardiovasc Res 1996; 31: 917–25
- Dong S. J., Hees P. S., Huang W. M., Buffer S. A Jr., Weiss J. L., Shapiro E. P. Independent effects of preload, afterload, and contractility on left ventricular torsion. Am J Physiol 1999; 277: H1053–60
- Moon M. R., Ingels N. B Jr., Daughters G. T 2nd., Stinson E. B., Hansen D. E., Miller D. C. Alterations in left ventricular twist mechanics with inotropic stimulation and volume loading in human subjects. Circulation 1994; 89: 142–50
- Takeuchi M., Borden W. B., Nakai H., Nishikage T., Kokumai M., Nagakura T., et al. Reduced and delayed untwisting of the left ventricle in patients with hypertension and left ventricular hypertrophy: A study using two‐dimensional speckle tracking imaging. Eur Heart J 2007; 28: 2756–62
- Nagueh S. F., Middleton K. J., Kopelen H. A., Zoghbi W. A., Quiñones M. A. Doppler tissue imaging: A noninvasive technique for evaluation of left ventricular relaxation and estimation of filling pressures. J Am Coll Cardiol 1997; 30: 1527–33
- Brodin L. A. Tissue Doppler, a fundamental tool for parametric imaging. Clin Physiol Funct Imaging 2004; 24: 147–55
- McCulloch M., Zoghbi W. A., Davis R., Thomas C., Dokainish H. Color tissue Doppler myocardial velocities consistently underestimate spectral tissue Doppler velocities: Impact on calculation peak transmitral pulsed Doppler velocity/early diastolic tissue Doppler velocity (E/Ea). J Am Soc Echocardiogr 2006; 19: 744–8