
Abstract
Background: Hypertension affects African–American adults more than any other ethnic group in the US. However, some of the black populations living outside Africa are well adapted to food and lifestyle. We aimed to describe the clinical characteristics underlying the gender-specific determinants of BP and the risk of hypertension in public-sector workers living in Angola.
Materials and methods: 609 volunteers (48% men) were included in this cross-sectional and descriptive study. Demographic, socioeconomic and life style data were collected during an interview. Systolic BP (SBP) and diastolic BP (DBP) were measured, along with some anthropometric and clinical variables.
Results: The prevalence of hypertension is 45.2% without difference between genders. Obesity was more prevalent in women (29.2% vs. 8.9%, p < 0.05). The age-related increment in SBP is higher in women (14.2 ± 1.1 vs 9.5 ± 1.3 mmHg/decade, p < 0.05). In men, age, BMI, cholesterol and LDLc/HDLc explained 21, 4, 2.5 and 2.9% of SBP variability, respectively. In women, age, BMI and HC explain 27, 2 and 1% of SBP variability, respectively. The risk for hypertension is 5 × high among men aged ≥45 years, and 3.5× in those having BMI ≥25. Women aged 45 years or older have 8 × risk of hypertension and 2× the risk by having BMI ≥25.
Conclusions: We found that advanced age (≥45) and overweight/obesity (BMI ≥25) are the main risk factors for hypertension in adults from Angola. However, our data suggest that age and BMI may have different influence on increasing BP in men and women.
Introduction
High blood pressure (BP) is the major risk factor for mortality worldwide. Several factors can influence the risk of developing hypertension, such as age, gender, body mass index (BMI), dietary habits, practice of physical activity, race and genetic factors.[Citation1,Citation2] Indeed, some of the known risk factors for primary hypertension are non-modifiable, but the majority of them can be effectively controlled, thus contributing to hypertension prevention.[Citation3]
Almost 1 billion people have uncontrolled BP worldwide, in which hypertension affects ∼40% of adult population. Most importantly, the global prevalence of hypertension is increasing, especially in low-income countries.[Citation4–6] In a study by Mathers and Loncar,[Citation7] 23 million cardiovascular deaths are projected by 2030, with ∼85% occurring in low- and middle-income countries,[Citation7] which passes through the epidemiological transition marked by an increased contribution of chronic diseases to adult morbidity and mortality related to hypertension, such as haemorrhagic stroke, renal failure and hypertensive heart disease.[Citation4,Citation8,Citation9] This shift or transition in disease and mortality rates reflects economic development, urbanization, industrialization and changes in social organization within countries and regions, with increased exposure to risk factors driven by changes in diet, physical inactivity and environment.
It has been shown that high BP affects African–American (AA) adults more than any other ethnic group in the US.[Citation10,Citation11] Indeed, hypertension is more prevalent in AA than non-AAs.[Citation12] African–American women have the highest prevalence of cardiovascular disease (49.0%) and associated risk factors, including high BP (46.6%), overweight (79.6%) and obesity (51.1%) than any other ethnic-sex group.[Citation11] This also occurs in other countries, such as in Brazil, where the prevalence of hypertension and overweight is also higher in adults with African ancestry as compared to Caucasians.[Citation13]
These data highlight the influence of the African ancestry for the risk of hypertension in black populations living outside Africa. Most of the available data on this subject, however, were obtained by studying AA’s that are well adapted to American food and lifestyle. Only a few studies were performed to investigate those factors that can influence the age-dependent increase in blood pressure and also the determinants of hypertension in African populations. Thus, this study was undertaken to describe the clinical characteristics underlying the gender-specific determinants of blood pressure and the risk of hypertension in public-sector workers living in Angola.
Materials and methods
Study design and population
This was a cross-sectional and descriptive study conducted in a sample of public civil servants working at the Universidade Agostinho Neto (UAN), in Luanda, the Angolan capital. The research was conducted in accordance with national and international ethical guidelines and approved by the Independent Ethics Committee of the School of Medicine of UAN, and all participants gave informed written consent.
UAN is a public institution of higher education employing 1458 domestic public-sector workers. All were invited to participate in a study to investigate cardiovascular risk factors by pamphlets and invitation letters. A sample of 609 volunteers (42.2% of the eligible population, 48% men) attended to the invitation and were included in the project. Data were obtained by previously trained and certificated staff researchers of the Department of Physiology of Faculty of Medicine. All data were obtained by questionnaire and clinical and laboratory exams performed in the morning period of a single visit. Training and certification of staff investigators was conducted by an experienced researcher. Data were collected from February 2009 to December 2010 based on a modified questionnaire used in the WHO-MONICA Project and on the WHO manuals for stepwise approaches and the surveillance of non-transmitted chronic diseases.[Citation14]
Measurements
Demographic, socioeconomic and life style (physical activity, tobacco use, medicines under use) data were collected by a questionnaire during an interview. The socioeconomic status was classified into three groups according to average monthly household income (in US dollar) [Citation15]: <$300 (low), $300–1200 (middle) and >1200 (upper class). Education was classified into three levels based on the number of years of formal education: low (≤4 years), medium (5–12 years) and high education (≥13 years in school). Individuals who did not report practicing sports for competition or engaging in physical activity for leisure lasting at least 30 min at a frequency of three days per week were considered sedentary.
Systolic blood pressure (SBP) and diastolic blood pressure (DBP) were measured in the left arm by using an automatic validated oscillometric device (OMRON, model HEM-705CP, Japan) after a resting period of 5–10 min in the sitting position. Three consecutive readings with a minimum interval of 5 min between measurements were taken from each subject. SBP and DBP levels were calculated as the arithmetic mean of the last two measurements. The VII Joint National Committee criteria were used for BP classification.[Citation1] Thus, individuals with SBP ≥140 mmHg and/or with DBP ≥90 mmHg were classified as hypertensive, in addition to the individuals taking antihypertensive medication, regardless of the frequency of use.
Anthropometric variables were taken in bare participants using only underclothes. The body weight was measured in a previously calibrated mechanical scale (SECA) with a maximum capacity of 220 kg and accuracy of 100 g. The height was measured in centimeters (cm) using a stadiometer fixed to the SECA scale with an accuracy of 0.5 cm. The waist (WC) and hip (HC) circumferences were each measured twice with an inextensible, inelastic, 1-cm-wide tape. The cutoff for WC was set at 94 cm for men and 80 cm for women. The cutoff for waist-to-hip ratio (WHR) was 0.9 for men and 0.8 in women.
Blood was collected after 10–12 h fasting by deep vessel venipuncture. The plasma glucose level and the lipid profile were determined to obtain the total cholesterol, high-density lipoprotein cholesterol fraction (HDLc), and triglyceride (TG) levels. The low-density lipoprotein cholesterol fraction (LDLc) was calculated using the Friedewald equation [Citation16] to triglycerides <400 mg/dL. The individuals with glucose level ≥126 mg/dL or those under regular use of insulin and/or oral hypoglycemic agents were classified as diabetic.
Statistical analysis
Data are presented as mean ± SD or the absolute number of cases (percentage). The goodness of fit to a normal distribution was evaluated using the Kolmogorov–Smirnov test. For continuous variables, the mean difference between genders was analyzed using the Mann–Whitney test. The chi-squared test was used for dichotomous variables and the comparison of the proportions between groups. A two-way analysis of variance (ANOVA) was used to determine differences between three or more categorized groups. In case of a significant F test, individual differences were found by using Tukey’s post hoc test. Correlation analyses (Spearman) were performed to estimate associations between variables. A stepwise regression analysis was used to determine which variables were independently associated with SBP and DBP. We set the p < 0.05 to insert a variable into the multivariate model, and p > 0.1 to remove a variable. Also, the risk of developing hypertension was found by calculating the odds ratio (OR) for a set of dichotomous variables. The significance level for all tests was set at p < 0.05. Statistical analyses were performed using R software (version 3.2.2, R Foundation for Statistical Computing, Vienna, Austria).
Results
General characteristics
A total of 609 participants, ranging from 20 to 69 years were enrolled in the study. Of the whole sample, 318 (52%) were female, 401 (65.8%) were between 20 and 49 years, and 360 (59.1%) had obtained only low or middle education level. shows a summary of selected socio-demographic characteristics stratified by gender. Participants were well allocated into progressive age intervals, educational levels and socioeconomic class. The main clinical characteristics are shown in for the whole sample as well as stratified by gender. Differences between men and women were found for height, BMI, WC, HC, uric acid and HDLc. Obesity was more prevalent (29.2% vs. 8.9%, p < 0.05) in women. The prevalence of diabetes was similar among men and women (5.5% vs. 5.9%, p > 0.05).
Table 1. Gender differences in socio-demographic characteristics.
Table 2. Gender differences in clinical characteristics of a sample enrolled in the study
Blood pressure and its relationship to age and BMI
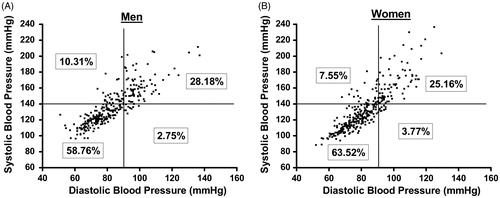
Hemodynamic variables are also presented in . Mean values of SBP was higher in men and no significant gender difference was found for DBP. The overall prevalence of hypertension was 45.2% without difference in men and women. By plotting SBP against DBP, it is possible to observe that most of the subjects with hypertension showed elevated SBP in presence of elevated DBP values (, men and , women).
Figure 1. Scatterplots of SBP against DBP showing the prevalence of systolic, diastolic or both systolic and diastolic hypertension among men (A) and women (B).
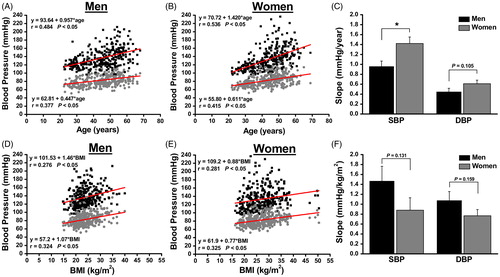
The effect of age and BMI in BP is shown in . The scatter plots show the influence of age and BMI on blood pressure levels in men and women. A significant correlation was found between both SBP and DBP and age and BMI. Interestingly, the age-related increment in SBP was higher in women than in men (14.2 ± 1.1 vs 9.5 ± 1.3 mmHg/decade, p < 0.05, ). Conversely, the effect of overall fat accumulation, assessed by BMI, inducing SBP and DBP increase shows a tendency (although not significant) to be more relevant in men than in women ().
Figure 2. Correlation analysis showing the relationship between blood pressure and age (A and B) or BMI (D and E) for men and women. Graphs C and F show the slope of increase in BP with age or BMI, respectively. * p < 0.05.
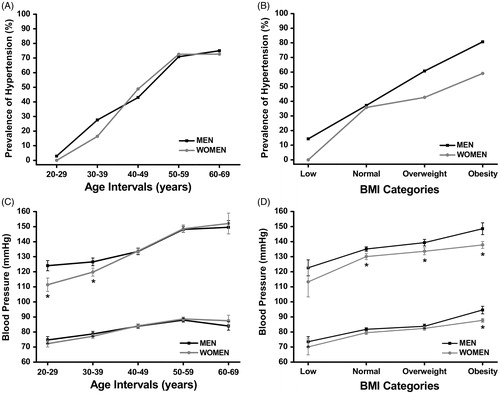
The prevalence of hypertension shows a progressive increase for each age interval (), but is similar among men and women. However, when divided by BMI category (), the prevalence of hypertension was higher in men. We next presented SBP and DBP into different intervals of age or BMI. As observed in , the slope of SBP increase with aging and seems to be steeper in young women (from 20 to 49 years old) compared to young men, even after controlling for BMI (age × gender interaction: two-way ANOVA p = 0.013). Diastolic blood pressure was not different between men and women at any age interval (no interaction detected on two-way ANOVA p = 0.121). In relation to BMI categories, both SBP and DBP increase as BMI increases (). On the other hand, after controlling for age, SBP is higher in men than in women for any BMI interval (no significant interaction detected on two-way ANOVA p = 0.759), except for the lowest BMI interval (BMI <18).
Figure 3. The prevalence of hypertension for each age interval (A) or BMI category (B) is shown for men and women. Graphs C and D show the gender-specific SBP and DBP for each age interval or BMI category, respectively.
The behavior of BP according to the educational level, socioeconomic class, status of physical activity and tobacco use are shown in Supplementary Figure S1. As observed in Supplementary Figure S1A, both SBP and DBP showed smaller values as educational level increases, regardless of gender. In women with medium or higher educational levels, SBP was significantly lower than in men. The changes elicited in BP by socioeconomic class followed a gender-specific pattern. In men, BP levels were kept unchanged over the different socioeconomic levels (Supplementary Figure S1B). In women, however, BP falls as the family income rises from low to middle and high socioeconomic levels. In both men and women, BP levels were unaffected by regular practice of physical activity or tobacco use (Supplementary Figure S1 C and D).
Gender differences among BP predictors
To identify which clinical variable are significantly correlated with SBP and DBP, we performed a univariate regression analysis. Supplementary Table 1 shows the Spearman’s correlation coefficients stratified by gender. In men, except for height and HDLc, all other clinical variables were significantly associated with SBP. Also, height, HDLc and uric acid were not associated with DBP. On the other hand, SBP was significantly associated with all clinical variables in women. DBP was not associated with HDLc in women.
Predictors of SBP and DBP were investigated by performing a multivariate stepwise regression analysis, stratified by gender. We included into the multivariate model all clinical variables with significant association detected by the univariate analyses (Supplementary Table 1). shows the intercept and the individual slope for each independent variable accepted in the model. Those variables that were not independently associated to SBP or DBP in men or women were not included into . In men, SBP was independently associated to age, BMI, cholesterol and LDLc/HDLc ratio, which explained 21, 4, 2.5 and 2.9% of SBP variability, respectively. Moreover, DBP was independently associated with age, WC, cholesterol and LDLc/HDLc ratio. In women, SBP was independently associated with age, BMI and HC, and 27, 2 and 1% of its variability was explained by these variables, respectively. DBP, however, was associated to age and BMI.
Table 3. Multiple regression coefficients stratified by gender.
We next tested the risk of developing hypertension for some independent factors. shows crude and adjusted OR. In men, the OR for developing hypertension is 5 × high among participants aged 45 years or older, and 3.5 × in those having BMI above 25 kg/m2. On the other hand, women aged 45 years or older have almost 8 × risk of developing hypertension and 2 × the risk by having BMI over 25 kg/m2. The WHR was associated with a 2.3 × risk of hypertension for both men and women, even after adjustment for age and BMI.
Table 4. Crude and adjusted odds ratio for hypertension stratified by gender.
Regular practice of physical activity did not change the risk of hypertension regardless of gender. However, a low educational level (<4 years) was associated with a 2 × risk of hypertension in men, but not in women ().
Discussion
In this study, we detected a high prevalence of hypertension in public-sector workers from an Angolan University, and also the combined prevalence of overweight and obesity was higher in women than in men. Our data showed that the age-related increment in BP seems to be stepper in women than in men, even after controlling for confounding variables. Also, age and BMI were identified as the strongest predictors of BP elevation and they individually increase the risk of hypertension by 8 and 2 × in women and 5 and 3.5 × in men, respectively.
Investigating a rural and urban Gambian population, van der Sande et al. [Citation17] reported a huge increment in the risk of hypertension with ageing. They also found an additional risk in obese or diabetic individuals. These data corroborate another study in some rural districts in Uganda, in which the risk for hypertension increased with age and BMI, and it was higher in women than in men.[Citation18] Our data clearly show that the increment in BP with age seems to be higher in women than in men (14 vs. 9 mmHg/decade, respectively). However, the mechanisms underlying gender differences in the age-related increase in BP are not fully understood. In fact, previous studies in children and adolescents have suggested that androgens might play an important role in these gender-related differences in BP elevation.[Citation19] In this study in African individuals, SBP was higher in men until 40 years. However, from 20 to 40 years, the slope of BP increase with age was significantly steeper in women than in men. This accelerated increase in BP in women at younger ages makes the difference observed in BP levels between genders to disappear. A faster fat accumulation may account for this finding. However, all these differences remained unchanged even after controlling for BMI.
An epidemiological transition with increasing prevalence of chronic non-communicable diseases is already under way in the sub-Saharan Africa. Studies in the last two decades have shown that the prevalence of hypertension in sub-Saharan countries varies between rural and urban regions. For instance, data from two different rural communities in Uganda showed an age-standardized prevalence of hypertension varying between 20 and 30%.[Citation18,Citation20] By comparing the prevalence of hypertension in rural or urban areas of Gambia, van der Sande et al. [Citation17] found a similar prevalence of hypertension between these two areas (17.4% and 19.4%, respectively). In our study, we observed a high prevalence of hypertension in public workers from Angola (overall 45.2%). Also, as reported by others,[Citation21,Citation22] we found that the prevalence of hypertension was not associated with gender. However, the great range of prevalence reported in different African countries seems to be related to differences between the rural and urban area. Also, it might be related to the epidemic growth of hypertension in developing countries. It was evidenced by Fezeu et al. [Citation23] in which data analysis of a 10-year change in prevalence of hypertension in Cameroon showed that it raised from 20.1 to 37.2% in women and from 24.4 to 39.6% in men.[Citation23]
Elevation in BP can also be influenced by modifiable risk factors. In a study among adults in an urban East African region, the authors reported a high prevalence of CVD risk factors, including obesity, hypertension, dyslipidemia, diabetes mellitus and metabolic syndrome. They also reported several gender-specific differences in CVD risk factors, such as obesity, abdominal obesity and metabolic syndrome among women.[Citation24] Our results are in agreement with these data, in which women have higher BMI and WC as compared to men. Also, we demonstrated a huge difference in the prevalence of overweight/obesity between men and women (36% vs. 59.4%, p < 0.001, respectively). Corroborating our findings, a recent published study with adults from a urban slum in South East Nigeria showed a prevalence of overweight/obesity of 32.7% and 52.9% for men and women, respectively.[Citation25] Overweight and obesity are modifying risk factors for a number of chronic diseases, being a leading determinant of hypertension, dyslipidemia and diabetes mellitus. The development of hypertension in obese people is dependent on the interactions among dietary, genetic, epigenetic and environmental factors. In our study, BMI and WC were higher in women than in men. BMI over 25 (overweight/obesity) was associated with a 3.5 and 1.9 × risk of hypertension in men and women, respectively, even after controlling for age. However, despite increase in WC and cholesterol, the risk of hypertension in both men and women was not significantly increased by those factors. It is possible that increase in body fat mass may have different effects in women than in men, and that a greater degree of adiposity must be achieved in women to obtain a significant rise in BP and an increase in a lipid risk profile compared to men.
We found that women aged 45 years or older have 8 × the risk of developing hypertension when compared to their younger pairs. These data are in agreement with the slope of age-related changes in blood pressure (), which was significantly higher in women than in men. Our data partially corroborate a study by Kotwani et al [Citation20] in a rural Ugandan community showing a greater increase in the risk for hypertension associated to ageing. However, this effect was similar in men and women. The authors also reported that a progressive increase in BMI also increased the risk in women, but not in men. Unlikely to the report by Kotwani and coworkers, we found a strong effect of BMI in men, and it seems that BMI does not affect BP in women as much as it does for men. One possible explanation might be on the effect of urbanization in the development of hypertension. In fact, hypertension and obesity are more common in the urban areas. Migratory studies have shown that hypertension in Kenya was associated with a rise in blood pressure as the migrants moved from a rural to an urban setting.[Citation26–28]
We also found that even after controlling for confounding factors (age and BMI), low educational level increases the risk of hypertension in men but not in women. This could be explained by the direct link between age and educational level, which is that older inhabitants of developing countries being more illiterate than younger ones. Moreover, the civil war that took place in Angola for several decades and has ended in 2002 might also account for this discrepancy and can mask the effect of educational level and economic conditions on BP level.
We address some limitations of our study. Firstly, it was conducted in a specific group of public civil servants. Therefore, prevalence data are not representative of the general Angolan population. However, this population is adequate to investigate mechanisms affecting blood pressure values along the life span. Secondly, causality cannot be determined in transversal studies. Therefore, we only detected factors associated to blood pressure changes. Longitudinal studies are necessary to investigate this point. Finally, only 42% of the eligible population was investigated. Therefore, some biases are possible when prevalence data are calculated.
In summary, we observed that advanced age (45 years or older) and overweight/obesity (BMI ≥25) are the main risk factors for hypertension. Although, we did not detect statistical significance, the age-related risk of develop hypertension seems to be higher in women than in men. On the other hand, the risk of hypertension associated to overweight/obesity seems to be stronger in men than in women. Understanding the conditions affecting age-related BP increase is of obvious clinical importance. Higher BP is associated with cardiovascular and renal disease across diverse populations, even controlling for other factors. Because of the transversal nature of the study, we can only speculate that the age must have some multicolinearity with genetic and environmental factors, which may be further addressed in more appropriate longitudinal studies.
Funding information
This study was supported by the Science and Development Foundation of Agostinho Neto University, Angola, Africa.
Supplementary_Figure_1__BP16-007__Baldo_et_al.tif
Download TIFF Image (1.1 MB)Acknowledgments
We appreciate the cooperation of the public-sector workers at UAN and the great work of the laboratory technicians.
Disclosure statement
The authors report no specific funding in relation to this research and no conflicts of interest to disclose.
Related Research Data
References
- Chobanian AV, Bakris GL, Black HR, et al. Seventh report of the joint national committee on prevention, detection, evaluation, and treatment of high blood pressure. Hypertension. 2003;42:1206–1252.
- Kornitzer M, Dramaix M, De Backer G. Epidemiology of risk factors for hypertension: implications for prevention and therapy. Drugs. 1999;57:695–712.
- Ezzati M, Lopez AD, Rodgers A, et al. Comparative risk assessment collaborating G. Selected major risk factors and global and regional burden of disease. Lancet. 2002;360:1347–1360.
- Modesti PA, Perruolo E, Parati G. Need for better blood pressure measurement in developing countries to improve prevention of cardiovascular disease. J Epidemiol. 2015;25:91–98.
- Lim SS, Vos T, Flaxman AD, et al. A comparative risk assessment of burden of disease and injury attributable to 67 risk factors and risk factor clusters in 21 regions, 1990–2010: a systematic analysis for the global burden of disease study 2010. Lancet. 2012;380:2224–2260.
- de Villiers L, Badri M, Ferreira M, et al. Stroke outcomes in a socio-economically disadvantaged urban community. S Afr Med J. 2011;101:345–348.
- Mathers CD, Loncar D. Projections of global mortality and burden of disease from 2002 to 2030. PLoS Med. 2006;3:e442.
- Yusuf S, Reddy S, Ounpuu S, et al. Global burden of cardiovascular diseases: part II: variations in cardiovascular disease by specific ethnic groups and geographic regions and prevention strategies. Circulation. 2001;104:2855–2864.
- Cappuccio FP. Commentary: epidemiological transition, migration, and cardiovascular disease. Int J Epidemiol. 2004;33:387–388.
- Anderson NB, Armstead CA. Toward understanding the association of socioeconomic status and health: a new challenge for the biopsychosocial approach. Psychosom Med. 1995;57:213–225.
- Go AS, Mozaffarian D, Roger VL, et al. Executive summary: heart disease and stroke statistics-2014 update: a report from the American Heart Association. Circulation. 2014;129:399–410.
- Nwankwo T, Yoon SS, Burt V, et al. Hypertension among adults in the United States: National Health And Nutrition Examination Survey, 2011–2012. NCHS data brief. 2013;133:1–8.
- Chor D, Pinho Ribeiro AL, Sa Carvalho M, et al. Prevalence, awareness, treatment and influence of socioeconomic variables on control of high blood pressure: results of the ELSA-Brasil Study. PloS One. 2015;10:e0127382.
- Organization WH. Chronic diseases and health promotion: stepwise approach to surveillance (STEPS). Geneva 2004. Available from: http://wwwwhoint/chp/steps/instrument/en/indexhtml.
- Angola MdPdRd. Estratégia de combate à pobreza. Reinserção social, reabilitação e reconstrução e esbabilização econômica. Available from: http://mirrorundporg/angola/linkrtf/ecp-angola2005pdf. 2005.
- Friedewald WT, Levy RI, Fredrickson DS. Estimation of the concentration of low-density lipoprotein cholesterol in plasma, without use of the preparative ultracentrifuge. Clin Chemistry. 1972;18:499–502.
- van der Sande MA, Milligan PJ, Nyan OA, et al. Blood pressure patterns and cardiovascular risk factors in rural and urban gambian communities. J Hum Hypertens. 2000;14:489–496.
- Wamala JF, Karyabakabo Z, Ndungutse D, Guwatudde D. Prevalence factors associated with hypertension in Rukungiri district, Uganda – a community-based study. Afr Health Sci. 2009;9:153–160.
- Bachmann H, Horacek U, Leowsky M, et al. Blood pressure in children and adolescents aged 4 to 18. Correlation of blood pressure values with age, sex, body height, body weight and skinfold thickness (Essen Blood Pressure Study). Monatsschr Kinderheilkd. 1987;135:128–134.
- Kotwani P, Kwarisiima D, Clark TD, et al. Epidemiology and awareness of hypertension in a rural Ugandan community: a cross-sectional study. BMC Publ Health. 2013;13:1151.
- Cappuccio FP, Micah FB, Emmett L, et al. Prevalence, detection, management, and control of hypertension in Ashanti, West Africa. Hypertension. 2004;43:1017–1022.
- Duboz P, Boetsch G, Gueye L, et al. Hypertension prevalence, awareness, treatment and control in Dakar (Senegal). J Hum Hypertens. 2014;28:489–493.
- Fezeu L, Kengne AP, Balkau B, et al. Ten-year change in blood pressure levels and prevalence of hypertension in urban and rural Cameroon. J Epidemiol Community Health. 2010;64:360–365.
- Njelekela MA, Mpembeni R, Muhihi A, et al. Gender-related differences in the prevalence of cardiovascular disease risk factors and their correlates in urban Tanzania. BMC Cardiovasc Disord. 2009;9:30.
- Ezeala-Adikaibe BA, Orjioke C, Ekenze OS, et al. Population-based prevalence of high blood pressure among adults in an urban slum in Enugu, South East Nigeria. J Hum Hypertens. 2016;30:285–291.
- Poulter NR, Khaw KT, Hopwood BE, et al. The Kenyan Luo migration study: observations on the initiation of a rise in blood pressure. BMJ. 1990;300:967–972.
- Poulter NR, Khaw KT, Sever PS. Higher blood pressures of urban migrants from an African low-blood pressure population are not due to selective migration. Am J Hypertens. 1988;1:143S–145S.
- Poulter NR, Khaw KT, Mugambi M, et al. Migration-induced changes in blood pressure: a controlled longitudinal study. Clin Exp Pharmacol Physiol. 1985;12:211–216.