
Abstract
Aim: This study aimed to evaluate whether waist measures, including waist circumference (WC) and waist-to-height ratio (WHtR), can improve the ability of body mass index (BMI) to assess the hypertension risk when used as continuous variables.
Methods: In this cross-sectional study, 82 432 Chinese children aged 9–17 years were included. Elevated BP was defined using age-sex-and-height-specific references. Logistic regression model and area under the receiver operating characteristic curve (AUC) were performed after BMI and waist measures were converted into age-and-sex-based z-scores.
Results: WHtR, but not WC, was associated with elevated BP after adjusting for BMI, with the odds ratios ranging between 1.14 (95% confidence interval: 1.04, 1.25) and 1.30 (1.21, 1.39) for one unit increase in WHtR z-score. Combined use of BMI and WHtR z-scores showed a significantly larger AUC than BMI alone (p < 0.05), while joint use of BMI and WC was not better than BMI alone.
Conclusion: WHtR, rather than WC, provided further information on hypertension risk beyond that provided by BMI alone when used as a continuous variable. This study suggests WHtR, in addition to BMI, should be included for the assessment of childhood adiposity in routine paediatric practice.
Introduction
Hypertension is one of the most important contributors to disease and death.[Citation1] Although most adverse outcomes occur in adulthood, elevated blood pressure (BP) in children is associated with numerous detectable target organ damages and more likely to develop hypertension in adulthood.[Citation2,Citation3] Obesity has long been recognised as an essential risk factor of hypertension.[Citation4,Citation5] Along with the childhood obesity epidemic,[Citation6,Citation7] studies indicate that the population prevalence of elevated BP in children will be increasing,[Citation8] and there is already evidence that this trend is underway.[Citation9,Citation10]
Currently, various indicators, including body mass index (BMI), waist circumference (WC), and waist-height ratio (WHtR), are used to identify obesity. BMI is the most commonly used surrogate measurement.[Citation11–13] Many committees and organisations, including American Medical Association, UK National Institute for Health and Care Excellence (NICE), American Academy of Pediatrics, have endorsed its use in children.[Citation14–16] However, BMI provides no information on body fat distribution, and elevated BMI might not necessarily reflect increased adiposity.[Citation17] Central adiposity has been revealed to be particularly pathogenic to the development of hypertension.[Citation4] Since waist measures, including WC and WHtR, are recommended to identify excess central adiposity in children,[Citation18,Citation19] some researchers suggested waist measures should be taken additionally to BMI to evaluate the impact of adiposity on childhood elevated BP. Studies have also revealed that the addition of waist measures to BMI could further specify the hypertensive risk than BMI alone.[Citation20,Citation21]
However, current guidelines remain controversial regarding the utility of waist measures in children.[Citation14–16] Numerous studies have observed no additional benefice of waist measures in addition to BMI to identify the risk of childhood elevated BP.[Citation22,Citation23] Moreover, waist measures and BMI were used as categorical variables in previous studies.[Citation20,Citation24] Because even amongst subjects in the same BMI category, the absolute BMI values were considerably greater in subjects with larger waist measures than in their normal waist counterparts, it is unclear whether the combined use of BMI with waist measures in characterising the hypertensive risk is superior to BMI alone when they are used as a continuous variable.
In this study, data of Chinese National Survey on Students Constitution and Health (CNSSCH) were used to clarify the role of waist measures in addition to BMI in the hypertension risk assessment of children. Because previous studies showed that the benefit of additional use of waist measures may depend on BMI level,[Citation21,Citation25] our study was performed in children with normal weight and overweight (defined by BMI) separately.
Methods
Participants
CNSSCH is a national successive cross-sectional survey that was designed to explore the health status of the Chinese children. The data of the survey conducted in 2010 were used in this study. As reported previously,[Citation26] a stratified multistage sampling method was used in CNSSCH. Each province was classified as urban or rural, and further grouped into sex-age specific subgroups. In each subgroup, equal numbers of students were selected from classes which were randomly selected from each grade in the selected school. In this study, subjects of Han ethnicity aged 9 to 17 years from 30 mainland provinces of China were involved. Tibetan children were surveyed but not included in this study because they tend to have different BP levels than their Han ethnic counterparts.[Citation27] Of 82 591 children with complete records of height, weight, BP, WC, and time for physical activity, 159 participants (0.19%) with extreme values (> five sex-and-age-specific standard deviations on either side of the mean) were excluded. Thus, a total of 82 432 participants were included in the final analysis.
This survey was conducted according to the guidelines laid down in the Declaration of Helsinki and approved by six ministries of China, including the Ministry of Education, General Administration of Sport, Ministry of Health, State Ethnic Affairs Commission, Ministry of Science and Technology, and Ministry of Finance. Informed consents were obtained from both parents and students. The project of analysing the survey data was approved by the Medical Research Ethics Committee of The University of Queensland (No. 2011001199).
Measurements
Anthropometric measurements were performed according to the same protocol at all survey sites.[Citation26] Standing height was measured with a fixed vertical backboard and an adjustable headpiece to the nearest 0.1 cm. Weight was recorded to the nearest 0.1 kg with a scale. Waist circumference (WC) was measured horizontally 1 cm above the navel at the end of normal expiration by a non-elastic flexible tape to the nearest 0.1 cm. Height, weight and WC were measured twice with the mean value recorded.
Body mass index (BMI) was calculated with the values of weight divided by height squared (kg/m2), and was categorised as normal weight and overweight (including overweight and obesity) according to the sex-and age-specific references for children suggested by Cole et al. [Citation11] Waist to height ratio (WHtR) was obtained by dividing WC (cm) by height (cm).
Because the distribution of BMI, WC, and WHtR changes as children mature, and the patterns of growth also differ between boys and girls, these adiposity indicators were transformed into sex-and age-specific standard deviation (SD) scores (z-scores) to allow the association between these measures and elevated BP can be evaluated independent of the sex and age of the child (z-score = (value − mean)/SD).[Citation28]
BP was measured according to the recommendation of the National High Blood Pressure Education Program (NHBPEP) Working Group in Children and Adolescents,[Citation29] using an auscultation mercury sphygmomanometer with an appropriate cuff size for children. BP measurements were taken at least 5 minutes after resting. Systolic BP (SBP) was defined as the onset of “tapping” Korotkoff sound, and diastolic BP (DBP) was defined as the fifth Korotkoff sound. An average of three BP measurements at a single visit was calculated for each child. SBP and DBP were further converted to sex-, age-, and height-based z-scores, which were used to classify each child as normal BP (<90th percentile) or elevated BP (≥90th percentile), based on the references of NHBPEP working group.[Citation29]
Time for physical activity, including daily time spent in physical education and exercise during both class-break and after-school, were measured by a standardized self-administered questionnaire, and was grouped as <0.5, ≥0.5, or ≥1 h daily.
Rigid quality control measures were enforced in this survey. All measurement instruments, including stadiometer, scale, tape and sphygmomanometer, were calibrated before use. All technicians were required to pass the standard measurement test after a rigorous one-week training course, and the measurements were conducted by the same team of technicians in each region.
Statistical analysis
Data were presented as mean (SD) or percentage, depending on variable, by sex and BMI strata. The Pearson and partial correlation coefficients were used to assess the relationship between BMI and waist measures with BP. To assess the association between BMI and waist measures, alone and in combination, with elevated BP, logistic regression model was used when province, area, age, and time for physical activity were adjusted for. Because the interactions between BMI and waist measures were not significant (p value >0.05), they were not included in the model. To evaluate the abilities of BMI and waist measures to discriminate between children with and without elevated BP, the area under the receiver operating characteristic curve (AUC) for BMI z-scores or waist measure z-score were compared with that for the combination of BMI and waist measure z-score, using ‘roccomp’ command. An AUC of 0.5 represents that the indicator is no better than mere chance to make a correct classification, and value of 1 means a perfect discrimination. A p value <0.05 was considered statistically significant. All analyses were performed with Stata 14 software (College Station, TX).
Results
The characteristics of participants are presented in stratified by sex and BMI. About 14.6% of children were classified as overweight according to BMI, and 16.2% were identified as elevated BP.
Table 1. Descriptive characteristics of participants stratified by sex and BMI.
Both BMI and waist measures were significantly correlated with BP. Their coefficients are reported in with larger coefficients observed for BMI among most sex and BMI strata when they were converted into z-scores. Additional adjustment for waist measure z-score led to a moderate attenuation in the correlation coefficients for BMI. When BMI z-score was adjusted for, the coefficients for both WHtR and WC were weakened, however a more dramatic decrease was observed in the coefficients for WC.
Table 2. Correlations between BMI, waist measures and BP z-scores among Chinese children aged 9 to 17 years.
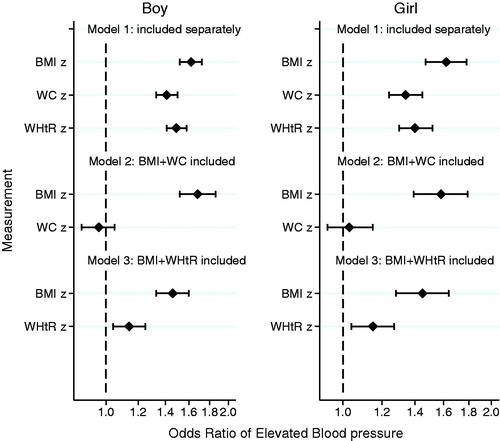
presents the associations of BMI and waist measure z-scores, both alone and in combination, with the risk of elevated BP in children with normal weight (Supplementary Table 1). When BMI and waist measurements were separately included into the model, all adiposity indicators were positively associated with the risk of elevated BP. With one unit increase in the z-score, the change in hypertensive risk was greater for BMI (odds ratios (ORs) ranged from 1.53 to 1.58) than that for WC (ORs ranged from 1.35 to 1.41) or WHtR (ORs ranged from 1.40 to 1.52) (p values < 0.001). When the model included both BMI and waist measure, estimates for BMI and WHtR were attenuated (ORs ranged from 1.29 to 1.52 for BMI, and 1.15 to 1.30 for WHtR; p values <0.001), but estimates for WC sharply declined and failed statistical significance (ORs ranged from 1.03 to 1.05; p values >0.05) (Supplementary Table 1). Furthermore, a similar pattern was also observed in overweight children ( and Supplementary Table 1). When BMI and waist measure were included in the model, ORs for WHtR ranged from 1.14 to 1.15 (p values <0.001), while ORs for WC were not significant (ORs ranged from 0.96 to 1.03; p values >0.05).
Figure 1. Odds ratios (ORs) of elevated BP for one standard deviation (SD) variation in BMI or waist measures z-score among different models in children with normal weight. BMI: body mass index; BP: blood pressure; CI: confidence intervals; WC: waist circumference; WHtR: waist-to-height ratio; BMI: WC and WHtR in the models are sex-and age-specific BMI: WC and WHtR z-scores respectively; Dots and error bars are ORs and 95% confidence intervals after adjusting for province, urban/rural area, age, and time for physical activity.
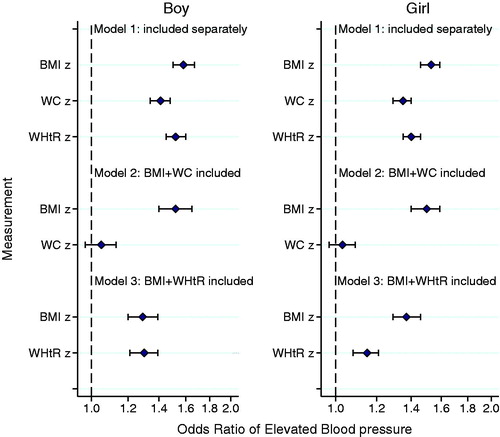
Figure 2. Odds ratios (ORs) of elevated BP for one standard deviation (SD) variation in BMI or waist measures z-score among different models in overweight children. BMI: body mass index; BP: blood pressure; CI: confidence intervals; WC: waist circumference; WHtR: waist-to-height ratio; BMI: WC and WHtR in the models are sex-and age-specific BMI: WC and WHtR z-scores respectively; Dots and error bars are ORs and 95% confidence intervals after adjusting for province, urban/rural area, age, and time for physical activity.
shows AUCs of BMI and waist measures z-scores, both alone and in combination, for elevated BP. Among various sex and BMI strata, combined utility of BMI and WHtR presented a modest, but significant, improvement in identifying children with elevated BP than using BMI alone (p values <0.05). However, no benefit was observed when BMI and WC were used in combination (p values >0.05). We also performed a sensitivity analysis by repeating the whole analysis among different age groups, including 9 to 11, 12 to 14, and 15 to 17 years, which achieved similar results (data not shown).
Table 3. Comparison of AUCs for detecting elevated BP between BMI or waist measures alone and combination.
Discussion
This study provided a nuanced look at the association between BMI and waist measures (WC and WHtR) with elevated BP in children when all adiposity indicators were examined on a continuous scale. Our finding demonstrated that BMI coupled with WHtR, but not WC, predicted the hypertensive risk modestly better than BMI alone, which could be observed in children of different sex and BMI strata.
In the present study, BMI was found to be superior to, if not similar with, waist measure in characterising the risk of elevated BP, with generally higher ORs and AUC statistic values than those for waist measures. These findings were consistent with previous studies conducted in various populations,[Citation22,Citation30] which were also in line with the current guidelines that recommend using BMI as the practical estimate of adiposity in children.[Citation14–16] However, though evidence acknowledges the potential added benefits of the use of waist measures, waist measures are not recommended in the assessment of overweight and obesity in children by the recommendations of American Medical Association, National institute for Health and Care Excellence, American Academy of Pediatrics, and other national health care organizations.[Citation14–16] One of the essential reasons is the information of waist measures for children that identify risk over and above the risk from BMI category are uncertain.[Citation15]
Khoury and colleagues estimated the utility of WHtR in the specification of cardiometabolic risk in children stratified by BMI category using the data of US National Health and Nutrition Examination Surveys (NHANES). They concluded that BMI and WHtR were useful together.[Citation20] Another study based on Canadian adolescents also supported their results.[Citation24] However, both BMI and waist measures were used in a categorized fashion in these studies. Even in children with the same BMI category, the absolute BMI values were greater in subjects with larger waist measures than in their counterparts with smaller waist measures.[Citation20,Citation24] Therefore, the additional benefit of waist measure to BMI is still ambiguous. Our present study showed that the incorporation of WHtR, in addition to BMI, further improved the identification of hypertensive risk even when both adiposity indicators were used as a continuous variable, indicating that WHtR might be considered as an indicator of childhood adiposity in addition to BMI.
It is interesting to observe that WHtR, but not WC, improved the assessment of hypertensive risk. Although studies revealed that both WC and WHtR are strongly associated with visceral fat by a similar degree of magnitude in paediatric population,[Citation31] researchers have argued that the cardiometabolic risk is unlikely to be the same among people with the same WC but different heights.[Citation32,Citation33] McCarthy and Ashwell also suggested that secular changes in height during growth could account for the increases in WC over time, and thus height should be considered when evaluating central obesity in children.[Citation34] However, the difference between WC and WHtR cannot possibly be proven by a small sample which does not have a wide spectrum of height. A considerable merit of our study is that it included a large sample size across the height spectrum. This is probably why our study observed the advantage of WHtR. Since WHtR offers a virtue of a simple boundary value which might be used in children of different age and sex groups,[Citation34] it could be conveniently applied in the assessment of adiposity in children, in addition to BMI. Future study is needed to determine this optimal threshold in the Chinese population.
The primary limitation of this study is that only associations but not causal correlation can be concluded, given its cross-sectional design. Though combined use of WHtR and BMI was revealed to be superior to BMI alone in identifying the hypertensive risk, longitudinal study is required to confirm our findings. In addition, there are studies reporting racial variation in the association between fat distribution pattern and cardiovascular disease risk factors in childhood.[Citation35] In this sense, it is unclear to what extent we might able to generalize the findings to other populations. Furthermore, BP records in this survey were based on three measurements in a single visit. According to current guidelines, high BP level tends to fall on subsequent measurements as the results of the accommodation effect and regression to the mean, and elevated BP should be confirmed on repeated visits.[Citation29] However, same BP measurement protocol was used in this survey, and this overestimate of elevated BP prevalence does not likely to change our findings.
In conclusion, the present study highlighted that WHtR, but not WC, in addition to BMI could provide information on risk of elevated BP beyond that provided by BMI alone in children. Our findings support the additional utility of WHtR to BMI to assess the elevated BP associated with adiposity in children, and suggest that WHtR should be involved in routine paediatric practice.
Funding information
This work was supported by National Health and Medical Research Council of Australia (APP1045000 and APP1042343) awarded to ZW.
Acknowledgements
The authors would like to thank Wen-Ke Liao, Wen-Hua Xing, Xin Zhang, and the members of CNSSCH for providing access to the survey data. We appreciate the helpful comments from Tania Pan, and we are grateful to the students who participated in the survey for their cooperation.
Disclosure statement
The authors declare no conflict of interest.
References
- WHO. Global health risks: mortality and burden of disease attributable to selected major risks. Geneva: World Health Organization; 2009. Available from: http://www.who.int/healthinfo/global_burden_disease/GlobalHealthRisks_report_full.pdf
- Falkner B. Recent clinical and translational advances in pediatric hypertension. Hypertension. 2015;65:926–931.
- Chen X, Wang Y. Tracking of blood pressure from childhood to adulthood: a systematic review and meta-regression analysis. Circulation. 2008;117:3171–3180.
- Rahmouni K. Obesity-associated hypertension: recent progress in deciphering the pathogenesis. Hypertension. 2014;64:215–221.
- Zhang YX, Wang SR. Comparison of blood pressure levels among children and adolescents with different body mass index and waist circumference: study in a large sample in Shandong, China. Eur J Nutr. 2014;53:627–634.
- Lobstein T, Jackson-Leach R, Moodie ML, et al. Child and adolescent obesity: part of a bigger picture. Lancet. 2015;385:2510–2520.
- Liang YJ, Xi B, Song AQ, et al. Trends in general and abdominal obesity among Chinese children and adolescents 1993–2009. Pediatr Obes. 2012;7:355–364.
- Flynn JT, Falkner BE. Obesity hypertension in adolescents: epidemiology, evaluation, and management. J Clin Hypertens (Greenwich). 2011;13:323–331.
- Muntner P, He J, Cutler JA, et al. Trends in blood pressure among children and adolescents. JAMA. 2004;291:2107–2113.
- Dong B, Wang HJ, Wang Z, et al. Trends in blood pressure and body mass index among Chinese children and adolescents from 2005 to 2010. Am J Hypertens. 2013;26:997–1004.
- Cole TJ, Bellizzi MC, Flegal KM, et al. Establishing a standard definition for child overweight and obesity worldwide: international survey. BMJ 2000;320:1240.
- Kuczmarski RJ, Ogden CL, Guo SS, et al. 2000 CDC growth charts for the United States: methods and development. Vital Health Stat 11. 2002;(246):1–190.
- de Onis M. Development of a WHO growth reference for school-aged children and adolescents. Bull World Health Organ. 2007;85:660–667.
- National Institute for Health and Care Excellence. Obesity: identification, assessment and management of overweight and obesity in children, young people and adults: partial update of CG43. London (UK): National Institute for Health and Care Excellence; 2014.
- Barlow SE. Expert committee recommendations regarding the prevention, assessment, and treatment of child and adolescent overweight and obesity: summary report. Pediatrics. 2007;120:S164–S192.
- US Preventive Services Task Force. Screening for obesity in children and adolescents: US preventive services task force recommendation statement. Pediatrics. 2010;125:361–367.
- Demerath EW, Schubert CM, Maynard LM, et al. Do changes in body mass index percentile reflect changes in body composition in children? Data from the Fels longitudinal study. Pediatrics. 2006;117:e487–e495.
- Browning LM, Hsieh SD, Ashwell M. A systematic review of waist-to-height ratio as a screening tool for the prediction of cardiovascular disease and diabetes: 0·5 could be a suitable global boundary value. Nutr Res Rev. 2010;23:247–269.
- Benfield LL, Fox KR, Peters DM, et al. Magnetic resonance imaging of abdominal adiposity in a large cohort of British children. Int J Obes (Lond). 2008;32:91–99.
- Khoury M, Manlhiot C, McCrindle BW. Role of the waist/height ratio in the cardiometabolic risk assessment of children classified by body mass index. J Am Coll Cardiol. 2013;62:742–751.
- Plachta-Danielzik S, Landsberg B, Johannsen M, et al. Association of different obesity indices with blood pressure and blood lipids in children and adolescents. Br J Nutr. 2008;100:208–218.
- Garnett SP, Baur LA, Srinivasan S, et al. Body mass index and waist circumference in midchildhood and adverse cardiovascular disease risk clustering in adolescence. Am J Clin Nutr. 2007;86:549–555.
- Chiolero A, Paradis G, Maximova K, et al. No use for waist-for-height ratio in addition to body mass index to identify children with elevated blood pressure. Blood Press. 2013;22:17–20.
- Khoury M, Manlhiot C, Dobbin S, et al. Role of waist measures in characterizing the lipid and blood pressure assessment of adolescents classified by body mass index. Arch Pediatr Adolesc Med. 2012;166:719–724.
- Kovacs VA, Gabor A, Fajcsak Z, et al. Role of waist circumference in predicting the risk of high blood pressure in children. Int J Pediatr Obes. 2010;5:143–150.
- Ji CY, Chen TJ. Empirical changes in the prevalence of overweight and obesity among Chinese students from 1985 to 2010 and corresponding preventive strategies. Biomed Environ Sci. 2013;26:1–12.
- Xu T, Zhu G, Liu J, et al. Gender-specific prevalence and associated risk factors of high normal blood pressure and hypertension among multi-ethnic Chinese adolescents aged 8–18 years old. Blood Press. 2015;24:189–195.
- Sedgwick P. Standardising outcome measures using z scores. BMJ. 2014;349:g5878.
- National High Blood Pressure Education Program Working Group on High Blood Pressure in Children and Adolescents. The fourth report on the diagnosis, evaluation, and treatment of high blood pressure in children and adolescents. Pediatrics. 2004;114:555–576.
- Dong B, Wang Z, Wang HJ, et al. Associations between adiposity indicators and elevated blood pressure among Chinese children and adolescents. J Hum Hypertens 2015;29:236–240.
- Lee S, Kuk JL, Hannon TS, et al. Race and gender differences in the relationships between anthropometrics and abdominal fat in youth. Obesity (Silver Spring). 2008;16:1066–1071.
- Ashwell M, Gunn P, Gibson S. Waist-to-height ratio is a better screening tool than waist circumference and BMI for adult cardiometabolic risk factors: systematic review and meta-analysis. Obes Rev. 2012;13:275–286.
- Hsieh SD, Yoshinaga H. Do people with similar waist circumference share similar health risks irrespective of height? Tohoku J Exp Med. 1999;188:55–60.
- McCarthy HD, Ashwell M. A study of central fatness using waist-to-height ratios in UK children and adolescents over two decades supports the simple message-‘keep your waist circumference to less than half your height'. Int J Obes (Lond). 2006;30:988–992.
- Tybor DJ, Lichtenstein AH, Dallal GE, et al. Independent effects of age-related changes in waist circumference and BMI z scores in predicting cardiovascular disease risk factors in a prospective cohort of adolescent females. Am J Clin Nutr. 2011;93:392–401.