
Abstract
Objective: To investigate the influence of cardiovascular risk factors, including fasting plasma glucose (FPG), on the association between electrocardiographic (ECG) and echocardiographic left ventricular hypertrophy (LVH) in an elderly population.
Methods: We tested cross-sectional associations between electrocardiographic and echocardiographic LVH, defining LVH according to the Sokolow-Lyon voltage combination, Cornell voltage-duration product, or left ventricular mass index (LVMI). Differences between standardized LVMI and Sokolow-Lyon voltage combination or Cornell voltage-duration product (absolute value/cut-off value for LVH) were used as outcome variables in order to identify explanatory variables associated with diagnostic discrepancies between ECG and echocardiography.
Results: Of the 1382 subjects included, 77% did not display any signs of LVH, 6% had LVH defined by ECG only, 13% had LVH defined by echocardiography only, and 5% had LVH on both ECG and echocardiography. Older subjects and those with higher blood pressure and RWT were more likely to have a relatively greater LVMI on echocardiography than that predicted on ECG (odds ratio: 1.65 per 10 years (95% confidence interval (CI): 1.27-2.15), p = .0002, odds ratio: 1.17 per 10 mmHg (95% CI: 1.09-1.25), p < .0001, and odds ratio: 1.21 per 0.10 (95% CI: 1.02-1.42), p = .03). In addition, discrepancy was also seen in females and subjects receiving antihypertensive medication (odds ratio: 1.41 (95% CI: 1.04-1.89), p = .03 and odds ratio: 1.41 (95% CI: 1.06-1.87), p = .02), but FPG did not independently influence discrepancy between ECG and echocardiography.
Conclusion: Age, blood pressure, female sex, greater RWT and use of antihypertensive medication were associated with a greater risk of non-consistency between LVH determined by ECG and echocardiography.
Introduction
Left ventricular hypertrophy (LVH) is independently associated with cardiovascular morbidity and mortality.[Citation1] The sensitivity of echocardiography to detect LVH is greater than that for the electrocardiogram (ECG),[Citation2,Citation3] but availability of echocardiography is lower and it can be technically challenging to perform on the obese and elderly.[Citation4,Citation5] ECG is simple, inexpensive and has high specificity for LVH.[Citation1] Therefore, ECG is recommended for the assessment of LVH in asymptomatic adults with hypertension or diabetes.[Citation6] However, an independent role of fasting plasma glucose (FPG) for LVH remains disputed.[Citation7–9] We have previously found LVH to be associated with elevated FPG in healthy men, but FPG did not potentiate the effect of other cardiovascular risk factors. Furthermore, higher systolic blood pressure (SBP) was only associated with LVH among subjects with normal fasting glucose (NFG), suggesting that hyperglycemia and/or the associated hyperinsulinemia may overrule the impact of hypertension on LVH.[Citation7] These controversies may be due to a direct effect of FPG on the ECG’s ability to detect LVH. In addition, several other factors may influence the ECG’s detection of LVH, including body mass index (BMI), age and gender.[Citation3,Citation10–12] Therefore, it might be necessary to take these factors into consideration when using ECG as screening tool for LVH. The aim of this study was to investigate the influence of cardiovascular risk factors, including FPG, on the relationship, concordance and discordance between electrocardiographically and echocardiographically defined LVH in an elderly population.
Materials and methods
Study population
Study subjects were derived from the Malmö Preventive Project (MPP, 1974–1992, n = 33,346), a population-based cohort study comprising inhabitants of Malmö, Sweden, belonging to pre-specified birth cohorts between 1921 and 1949.[Citation13] A re-examination study (MPP-RES, n = 18,238) was conducted between 2002 and 2006, during which the participants answered a self-administered questionnaire on lifestyle, medical history and medication. Blood pressure (BP) and heart rate (HR) were recorded twice in the supine position after 5 min of rest (with values averaged for the analyses). Height, weight, waist and hip circumferences were measured, and BMI and body surface area (BSA) (DuBois equation) were calculated. Blood samples were drawn after overnight fasting for analysis of plasma glucose, serum lipids and storage in a biobank. In a subsample of 1792 individuals from MPP-RES, a 12-lead ECG and an echocardiogram were carried out. These subjects were randomly selected from groups defined by FPG, but with oversampling in groups of subjects with impaired fasting glucose (IFG) and diabetes mellitus (DM), in order to ensure an adequate number of subjects in each group. The definitions of NFG, IFG and DM mimicked the World Health Organization criteria,[Citation14] although they were based on a single measurement only: NFG, FPG ≤6.0 mmol/l; IFG, FPG 6.1–6.9 mmol/l; established or new-onset DM, a FPG ≥7.0 mmol/l or on antidiabetic medication.
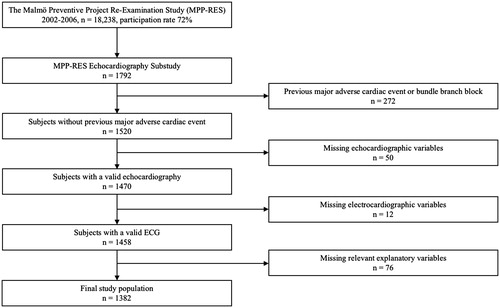
In the current study, subjects with conditions that might have influenced ECG interpretation, i.e. history of previous myocardial infarction, percutaneous coronary intervention, coronary artery bypass grafting, heart failure, or left or right bundle branch block (n = 272) were excluded, whereas subjects receiving antihypertensive medication were not. In addition, subjects with missing key variables, i.e. echocardiographic variables (n = 50), ECG variables (n = 12) or other relevant variables (n = 76) were excluded as well. Thus, the final study population comprised 1382 subjects ().
Figure 1. Flowchart showing the study population selection.
MPP-RES was approved by the Ethics Committee of Lund University, Sweden, and conducted in accordance with the Declaration of Helsinki. Written informed consent was obtained from all participants.
Electrocardiography
A standard 12-lead ECG was recorded at 50 mm/s and 1 mV/cm for 10 s, using MAC, MAC5K or MAC8 devices (GE Healthcare, Milwaukee, WI). Assessment of QRS duration was automated, determined by the manufacturer’s Marquette 12SL algorithm. This analysis program uses signal averaging by creating a median QRS complex. All QRS complexes of the same shape are aligned in time, and a representative QRS complex from the median voltages is generated. QRS onset and offset are determined by analyzing the slopes in all 12 simultaneous leads, using the time-aligned median complexes. The QRS duration is then measured as a global interval, i.e. from the earliest detection of depolarization in any lead (onset) to the latest detection of depolarization in any lead (offset). R- and S-wave amplitudes were measured manually on signal averaged ECG complexes by experienced technicians (biomedical scientists). Clinical data were blinded for the interpreting investigator. Both Cornell voltage-duration product (CP; males: (RaVL + SV3) × QRS duration; females: (RaVL + SV3 + 6 mm) × QRS duration) and Sokolow-Lyon voltage combination (SL; SV1 + (RV5 or RV6, whichever was taller)) were calculated. Cut-off levels defining LVH were >35 mm for SL and >2440 mm × ms for CP, respectively.[Citation1,Citation15]
Echocardiography
Echocardiography was conducted with a 3V2c transducer (Acuson Sequoia, Mountain View, CA) or an S3 transducer (Sonos 5500 Philips, Andover, MA) and performed and analyzed by a total of six experienced technicians (biomedical scientists). Left ventricular mass (LVM) calculations were based on offline two-dimensional linear measurements in the parasternal long-axis view at the tips of the mitral valve leaflets at end-diastole, perpendicular to the long axis of the left ventricle (LV). The thickness of the interventricular septum (IVSD), LV internal diameter (LVIDD) and the thickness of the posterior wall (LVPWD) were obtained by placing the calipers on the interface between myocardial wall and cavity and the interface between myocardial wall and pericardium, respectively. LVM was calculated using the Devereux formula recommended by the American Society of Echocardiography and the European Association of Cardiovascular Imaging,[Citation16] and indexed for BSA, obtaining left ventricular mass index (LVMI). Cut-off values for LVH were LVMI >95 g/m2 in women and >115 g/m2 in men, respectively. Furthermore, due to the high mean BMI of subjects, additional analyses indexing LVMI to height1.7, i.e. allometric scaling, were performed as well, with cut-off values for LVH being LVMI >60 g/m1.7 in women and >80 g/m1.7 in men.[Citation17–19] Relative wall thickness (RWT) was calculated as (2 × PW)/LVID, allowing categorization of LV geometry into normal (normal LVMI and RWT ≤0.42), concentric remodelling (normal LVMI and RWT >0.42), eccentric LVH (increased LVMI and RWT ≤0.42), and concentric LVH (increased LVMI and RWT >0.42). The intra- and interobserver variabilities (coefficients of variation) for IVSD, LVIDD and LVPWD, were 10.5% and 13.0%, 3.3% and 4.1%, and 5.5% and 12.1%, respectively.[Citation20]
Statistical analysis
Continuous variables were summarized by means and standard deviations (approximately normally distributed variables) and medians and interquartile ranges (IQR) (non-normally distributed variables); categorical variables were presented by frequencies and corresponding percentages. Group-wise comparisons were performed using independent samples t-test, one-way analysis of variance (ANOVA), Mann–Whitney U-test, Kruskal–Wallis test and Pearson’s χ2-test. Variables significantly associated with SL, CP and LVMI, respectively, were identified using multivariable linear regression. Although use of antihypertensive medication was not significantly associated with SL, it was forced into the final multivariable model due to its potential influence on BP and HR. Furthermore, the individual regression coefficients for each class of antihypertensive medication were shown. The predictive abilities of SL and CP for LVMI, including interactions, were tested using multivariable linear regression and likelihood-ratio test. In addition, we calculated standardized values defined as the absolute value of SL, CP, or LVMI for each subject divided by the above-mentioned cut-offs for LVH on ECG or echocardiography, respectively. We further calculated the differences between standardized LVMI and SL (LVMIstandard – SLstandard) as well as LVMI and CP (LVMIstandard – CPstandard), and used these as outcome variables in order to identify explanatory variables associated with discrepancies detected between echocardiography and ECG. The β-coefficients for the explanatory variables were to be interpreted as follows: β > 0 identified variables associated with relatively higher LVM on echocardiography when compared to ECG, whereas the opposite was true for variables with β < 0. Whether or not the ECG and echocardiographic findings were concordant (absence or presence of LVH on both ECG and echocardiography) or discordant (presence of LVH on either ECG or echocardiography, but not both modalities) was further assessed using binary logistic regression. Independent variables included constitutional (age, gender, body composition, smoking status, medication use), metabolic (FPG category, lipids) and hemodynamic (BP, HR) risk factors. BMI was the preferred marker for body composition due to its overall better predictive value compared to the other variables, i.e. height, weight, waist and hip circumferences, in the present study. Statistically (on univariable analyses) significant variables were included in the final multivariable linear models, and stepwise backward selection was applied for adjustment of these models. The significance level was 0.05. Linear regression coefficients were reported as standardized values. All statistical analyses were carried out using IBM SPSS Statistics 23 (IBM, Armonk, NY) and Stata/IC 14 (StataCorp LP, College Station, TX).
Results
Baseline characteristics
Median age was 67 (full range 56–79) years, 69% were male, and 15% were active smokers. Mean BP was 148 ± 20 mmHg SBP and 85 ± 10 mmHg diastolic (DBP). Mean BMI was 28.1 ± 4.3 kg/m2 and 41% were treated with antihypertensive medication. 39% had NFG, 29% had IFG and 32% had DM. 77% did not display any signs of LVH, 6% had LVH defined by ECG only, 13% had LVH defined by echocardiography only and 5% had LVH on both ECG and echocardiography. Subjects in whom LVH was detected by echocardiography only had greater BMI (p = .001), waist (p = .007) and hip circumferences (p = .02), lower height (p = .04), and were more often on medication (p = .04) than their counterparts in whom LVH was detected by ECG alone (). Baseline characteristics according to groups based on allometric scaling are presented in Supplemental Table 1.
Table 1. Baseline characteristics according to LVH categories.
Sensitivity, specificity, positive and negative predictive values for electrocardiographic LVH, when using echocardiography as reference, were 10%, 97%, 44% and 84% for SL; 20%, 95%, 46% and 85% for CP; and 28%, 93%, 44% and 86% for LVH defined by either SL or CP.
Left ventricular mass index
Mean LVMI was 88 ± 22 g/m2. Greater LVMI was associated with older age, male sex, greater BMI, higher SBP and DBP, and use of antihypertensive medication, but with lower HR (, Supplemental Table 2). When stratifying for drug class, only beta blocker monotherapy was significantly associated with LVMI. As expected, replacing LVMI per se with LVMIstandard did not significantly change the results, except turn the association to male sex negative.
Table 2. Four multivariable linear regression models listing factors associated with LVMI, RWT, SL and CP.
Relative wall thickness
Mean RWT was 0.41 ± 0.08. Greater RWT was associated with older age, active smoking, greater BMI and higher DBP. Use of antihypertensive medication was forced into the model (, Supplemental Table 2).
Sokolow-Lyon voltage combination
Mean SL was 22 ± 7 mm, and LVH by the SL criterion was identified in 54 (4%) subjects. Greater SL was significantly associated with male sex, lower BMI, higher SBP and DBP, and lower HR. Antihypertensive medication was forced into the model (, Supplemental Table 2). Furthermore, SL itself was significantly associated with LVMI (β: .218 (p < .0001, adjusted R2 .047)). RWT did not interact with the association between SL and LVMI. In univariable analyses, (LVMIstandard – SLstandard) was positively associated with age, female sex, BMI, DBP, FPG category, triglycerides, RWT and use of antihypertensive medication, and negatively associated with HR. The final multivariable linear regression model comprised age, sex, BMI, and DBP, HR and RWT. Use of antihypertensive medication was forced into the model (, Supplemental Table 3).
Table 3. Two multivariable linear regression models and one binary logistic regression model listing factors influencing the difference between standardized LVMI and SL, standardized LVMI and CP, and discordance between ECG and echocardiography, respectively.
Cornell voltage-duration product
Mean CP was 1534 ± 624 mm × ms, and LVH by the CP criterion was identified in 106 (8%) subjects. Greater CP was significantly associated with older age, greater BMI, higher DBP as well as female sex, non-smoking, and use of antihypertensive medication (, Supplemental Table 2). Furthermore, CP itself was significantly associated with LVMI (β: .330 (p < .0001, adjusted R2 .108)). RWT did not interact with the association between CP and LVMI. In univariable analyses, (LVMIstandard – CPstandard) was positively associated with male sex, active smoking, and RWT, and negatively associated with BMI, HR and FPG category, i.e., presence of DM. Of these, the final multivariable linear regression model excluded BMI and RWT. Use of antihypertensive medication was yet again forced into the model (, Supplemental Table 3). Age was significantly positively associated with QRS amplitude, i.e. RaVL + SV3 (β: .123 (p < .0001)), and negatively with QRS duration (β: −.088 (p = .001)), active smoking was significantly negatively associated with amplitude (β: −.112 (p < .0001)), but not with duration (β: −.019 (p = .48)), and BMI was significantly positively associated with amplitude (β: .170 (p < .0001)), but not with duration either (β: .045 (p = .10)). SBP was positively associated with both amplitude (β: .192 (p < .0001)) and with duration (β: .095 (p = .0004)), whereas HR was non-significantly, negatively associated with amplitude (β: −.039 (p = .15)) and significantly with duration (β: −0.134 (p < .0001)). RWT was significantly positively associated with amplitude (β: .145 (p < .0001)), but not with duration (β: −.035 (p = .20)).
Discordance between ECG and echocardiography
Discordance between ECG and echocardiographic findings was predicted by older age, female sex, higher SBP, RWT and use of antihypertensive medication (, Supplemental Table 3). In addition, BMI was significantly associated with discrepancy in univariable analyses.
Use of allometric scaling
The results obtained using allometric scaling for LVMI mimicked those obtained using conventional indexing, but with increased relative effects of sex and BMI.
Discussion
We found a greater risk of non-consistency between LVH determined by ECG or echocardiography in subjects who were older, female, had higher BP and RWT, and received antihypertensive medication. Older subjects and those with higher BP and RWT were more likely to have a relatively greater LVMI on echocardiography than that predicted by ECG, whereas the directional changes for both sex and use of antihypertensive medication depended on whether the SL or CP criterion was applied. Smoking status, BMI, and HR seemed to influence the risk of discordance between ECG and echocardiography to some extent. The relative effects of sex and BMI were greater when using allometric scaling, due to the inherent properties of this method.[Citation17]
Specificities for LVH detection by ECG were in accordance with previous comparable studies, but sensitivities were slightly lower.[Citation21,Citation22] This may be explained by demographic differences, e.g. older age, gender distribution and more frequent use of antihypertensive medication. Importantly, the combination of the SL and CP criteria improved sensitivity without adversely affecting specificity for LVH.[Citation15]
The risk of non-consistency between LVH determined by ECG or echocardiography was greater among older subjects. Older age was associated with a greater difference between standardized LVMI and SL, implying that LVMI increases relatively more with age than does SL. Aging influences the ability of the ECG to assess LVH through altered electrical conduction, both internally in the heart (e.g. myocardial fibrosis) and externally in the thoracic cavity (e.g. senile emphysema), factors that do not directly influence echocardiographic findings.[Citation23] R- and S-waves may decline with older age, even though LVMI increases.[Citation11,Citation24] In the present study, older age was positively associated with QRS amplitude, although to a lesser extent than the positive association between age and LVMI. Our findings could therefore be explained by a dampening of the ECG signal as well the narrow age span in a relatively old cohort. The lack of an association between age and difference between standardized LVMI and CP may be due to the lack of an association between age and QRS duration. Development of age-specific electrocardiographic LVH criteria has been suggested previously and this concept is supported by the present study, assuming no prognostic interaction between age and SL and/or CP.[Citation3]
Male gender was associated with less difference between standardized LVMI and SL and greater difference between LVMI and CP, i.e. SL was relatively higher and CP relatively lower in men versus women as compared to LVMI. ECG signal amplitudes are significantly lower in women,[Citation12] which might explain the relationship with SL, i.e. the use of the same cut-off for men and women is not able to compensate for the inherently lower LVMI in women. However, the female correction factor of 6 mm used in the present study in CP seemed exaggerated for this particular population. In other words, for a given CP, a relatively greater LVMI was predicted for women, when taking into account the lower echocardiographic cut-off for LVH in women. Therefore, SL tends to identify LVH in men, whereas CP tends to identify LVH in women.[Citation25] Overall, female sex was more likely to be associated with discordance between ECG and echocardiography. Intuitively, the relatively lower SL in women could be due to the presence of breast tissue, but this difference accounts for less than 1% of the total variation.[Citation26] The difference could not be explained by female obesity either, as the women in our study were not more obese than the men. The clinical significance of this finding needs to be evaluated in follow-up studies, but assuming appropriate cut-offs for echocardiographic LVH, development of sex-specific SL criteria and a lower female correction factor in CP may be considered.
In accordance with a previous study by Okin et al., greater BMI was associated with a larger difference between standardized LVMI and SL because of relatively higher LVMI and lower SL in obese subjects.[Citation10] Overweight and obesity are associated with decreased QRS amplitude, and at the same time, greater LVMI.[Citation27–29] CP has also shown a progressively waning association with increasing BMI categories, and correction by BMI has been shown to improve the performance of traditional ECG for diagnosis of LVH, at least in patients with hypertension in whom data obtained on echocardiography were used as reference.[Citation30] Similarly, the present results support the concept of adjusting electrocardiographic measures for LVH, for BMI. The influence of BMI on the difference between standardized LVMI and CP in the present study was only evident on univariable analysis, probably because BMI was positively associated with QRS amplitude due to the greater LVMI accompanying greater BMI, attenuating the usual dampening effect of increased BMI. Concordant with Okin et al., we did not find an association between BMI and QRS duration.[Citation10]
The greater difference between standardized LVMI and CP in active smokers could be explained by lower CP in these subjects. Active smoking was significantly negatively associated with QRS amplitude, but not duration, i.e. the effect of smoking might be mediated through asymptomatic or mild chronic obstructive pulmonary disease.[Citation31,Citation32] The more pronounced effect in the limb leads could even explain why smoking affected CP to a greater extent than SL and further the lack of a significant association between active smoking and the difference between standardized LVMI and SL.
The presence of DM was significantly associated with a greater increase in CP than LVMI, resulting in an increased negative difference between standardized LVMI and CP. Such a relationship was not found for SL. This suggests that DM, possibly through hyperglycemia and the resulting advanced glycation end products, increases the QRS width without increasing the amplitude.
There was a greater risk of discrepancy in subjects with higher BP, and higher BP was further associated with a larger difference between standardized LVMI and SL, i.e. LVMI was relatively greater compared to SL in subjects with higher BP. However, the close association between BP and LVMI was expected because BP is the main non-constitutional determinant of LVM,[Citation33] and echocardiography generally detects LVH better than ECG.[Citation2,Citation3] In addition, the ECG components that make up SL and CP may identify other electrical abnormalities, which to a greater degree are influenced by other risk factors. This might explain why the standardized LVMI increased more than SL. However, the difference between standardized LVMI and CP was independent of BP, indicating that CP and LVMI had similar associations with BP. One might therefore consider a lower threshold for performing echocardiography in patients with hypertension.
Lower HR was associated with the differences between both standardized LVMI and SL, and LVMI and CP, respectively. In other words, LVMI was relatively more decreased than SL and CP in subjects with higher HR. This might be due to shortened diastolic filling time leading to a reduced end-diastolic LV volume and perhaps an artefactually reduced LVMI. The fact that HR was primarily negatively associated with QRS duration, but not amplitude, comes as no surprise, since increased HR itself shortens QRS duration.[Citation34]
Higher RWT was associated with a greater risk of overall discrepancy between ECG and echocardiography. LVM predicted by echocardiography was relatively greater than LVM predicted by SL with increasing RWT, i.e. SL was more likely to detect eccentric than concentric LVH. This seems on par with the findings for BP as concentric changes are often encountered among hypertensive patients.[Citation33] The lack of an association between RWT and the standardized difference between LVMI and CP may have been due to the fact that RWT was only associated with the amplitude component of CP.
There was a higher risk of discrepancy between LVH determined by ECG or echocardiography in subjects receiving antihypertensive medication; however, use of such drugs as a whole was not significantly associated with any difference between standardized LVMI and SL nor CP, and we found no significant interactions between BP or HR and use of antihypertensive medication. This finding may be due to the fact that increased BP was associated with both LVH per se and discordance, as well as the lack of a single BP assessment to adequately reflect the temporally accumulated subclinical cardiac damage in hypertensive patients. Alternatively, it may have been due to a class effect, given that use of beta blocker monotherapy was significantly positively associated with LVMI, consistent with its lower ability to reduce LVM than other drug classes.[Citation35]
Limitations
Although the participation rate of 72% in MPP-RES is considered high, one may still argue that the study subjects did not represent a truly random population sample since people who agreed to take part may have been healthier than the general population. 69% of the subjects in the present study were men, which may limit the applicability of the results in women. The rather narrow age span (IQR: 61–70 years, range: 56–79 years) and lack of racial diversity further limit the generalizability to groups other than middle-aged to elderly Caucasians. Limitations regarding ECG include the existence of many different criteria for LVH, each with their own sensitivity and specificity, day-to-day variability, and variability resulting from variations in electrode placement site. The characteristics of patient groups in whom the criteria were established may differ from those in whom the criteria are applied. In addition, other, more complex ECG criteria for LVH may perform better than SL and CP;[Citation36] however, only variables pertaining to these two criteria were available. Lastly, the cross-sectional nature of our study prevents us from making inferences about causality.
Since SL and CP identify patients with different high-risk cardiovascular risk profiles, and the combination of these two criteria further improves sensitivity without reducing specificity, it would be preferable to use both criteria in order to increase the detection rate of electrocardiographic LVH.[Citation25] In addition, neither ECG nor echocardiography assess LVH optimally, suggesting distinct independent and additive predictive properties of these different measures of LVH for future cardiovascular events. Echocardiography often comprises the reference in daily clinical practice; however, the non-use of more precise methods, utopically speaking, autopsy data as reference prevented us from determining whether ECG or echocardiography gave a more correct estimate of LVM, in case of discrepancy. Whether or not the magnitude of such discrepancy and the effect of each involved risk factor is of clinical importance, remains unanswered. A number of these issues will be addressed in a follow-up study, in which we will attempt to compare the prognostic implications of LVH defined by ECG or echocardiography as well as assess the importance of the risk factors associated with diagnostic discrepancy.
In conclusion, in an elderly general population sample, being older, female, having higher BP and receiving antihypertensive medication were associated with a greater risk of non-consistency between LVH determined by ECG or echocardiography. Therefore, a more flexible approach for referring such subjects for echocardiographic assessment based on ECG criteria for LVH should be considered. In addition, higher RWT was associated with a greater risk of discrepancy between ECG and echocardiography as well. Future studies will show whether these factors further influence the cardiovascular risk predicted by both electrocardiographic and echocardiographic LVH. If so, one might consider development of sex-specific SL criteria as well as lowering the female correction factor for CP.
Manan_et_al._Supplemental_content.zip
Download Zip (61.7 KB)Disclosure statement
There are no conflicts of interest.
Funding
This study was funded by The Danish Diabetes Academy supported by the Novo Nordisk Foundation.
Related Research Data
References
- Mancia G, Fagard R, Narkiewicz K, et al. 2013 ESH/ESC guidelines for the management of arterial hypertension: the task force for the management of arterial hypertension of the European society of hypertension (ESH) and of the European society of cardiology (ESC). Eur Heart J. 2013;34:2159–219.
- Devereux RB, Casale PN, Wallerson DC, et al. Cost-effectiveness of echocardiography and electrocardiography for detection of left ventricular hypertrophy in patients with systemic hypertension. Hypertension. 1987;9:II69–76.
- Levy D, Labib SB, Anderson KM, et al. Determinants of sensitivity and specificity of electrocardiographic criteria for left ventricular hypertrophy. Circulation. 1990;81:815–20.
- Levy D, Anderson KM, Savage DD, et al. Echocardiographically detected left ventricular hypertrophy: prevalence and risk factors. The Framingham heart study. Ann Intern Med. 1988;108:7–13.
- Gardin JM, Siscovick D, Anton-Culver H, et al. Sex, age, and disease affect echocardiographic left ventricular mass and systolic function in the free-living elderly. The cardiovascular health study. Circulation. 1995;91:1739–48.
- Greenland P, Alpert JS, Beller GA, etet al. 2010 ACCF/AHA guideline for assessment of cardiovascular risk in asymptomatic adults: a report of the American college of cardiology foundation/American heart association task force on practice guidelines. J Am Coll Cardiol. 2010;56:e50–103.
- Diederichsen SZ, Pareek M, Nielsen ML, et al. Impact of fasting glucose on electrocardiographic left ventricular hypertrophy in an elderly general population. Blood Press. 2015;24:164–73.
- Velagaleti RS, Gona P, Chuang ML, et al. Relations of insulin resistance and glycemic abnormalities to cardiovascular magnetic resonance measures of cardiac structure and function: the Framingham heart study. Circ Cardiovasc Imaging. 2010;3:257–63.
- Hwang YC, Jee JH, Kang M, et al. Metabolic syndrome and insulin resistance are associated with abnormal left ventricular diastolic function and structure independent of blood pressure and fasting plasma glucose level. Int J Cardiol. 2012;159:107–11.
- Okin PM, Roman MJ, Devereux RB, et al. ECG identification of left ventricular hypertrophy. Relationship of test performance to body habitus. J Electrocardiol. 1996;29:256–61.
- Strait JB, Lakatta EG. Aging-associated cardiovascular changes and their relationship to heart failure. Heart Fail Clin. 2012;8:143–64.
- Simonson E, Blackburn H, Puchner TC, et al. Sex differences in the electrocardiogram. Circulation. 1960;1960:598–601.
- Berglund G, Nilsson P, Eriksson KF, et al. Long-term outcome of the Malmö preventive project: mortality and cardiovascular morbidity. J Intern Med. 2000;247:19–29.
- World Health Organisation. Definition and diagnosis of diabetes mellitus and inter- mediate hyperglycaemia. Report of a WHO/IDF consultation. 2006. Available from: http://apps.who.int/iris/bitstream/10665/43588/1/9241594934_eng.pdf.
- Dahlof B, Devereux RB, Julius S, et al. Characteristics of 9194 patients with left ventricular hypertrophy: the LIFE study. Losartan intervention for endpoint reduction in hypertension. Hypertension. 1998;32:989–97.
- Lang RM, Badano LP, Mor-Avi V, et al. Recommendations for cardiac chamber quantification by echocardiography in adults: an update from the American society of echocardiography and the European association of cardiovascular imaging. J Am Soc Echocardiogr. 2015;28:1–39 e14.
- Chirinos JA, Segers P, De Buyzere ML, et al. Left ventricular mass: allometric scaling, normative values, effect of obesity, and prognostic performance. Hypertension. 2010;56:91–8.
- Marwick TH, Gillebert TC, Aurigemma G, et al. Recommendations on the use of echocardiography in adult hypertension: a report from the European association of cardiovascular imaging (EACVI) and the American society of echocardiography (ASE). J Am Soc Echocardiogr. 2015;28:727–54.
- Kuznetsova T, Haddad F, Tikhonoff V, et al. Impact and pitfalls of scaling of left ventricular and atrial structure in population-based studies. J Hypertens. 2016;34:1186–94.
- Leosdottir M, Willenheimer R, Plehn J, et al. Myocardial structure and function by echocardiography in relation to glucometabolic status in elderly subjects from 2 population-based cohorts: a cross-sectional study. Am Heart J. 2010;159:414–20.
- Calderon A, Barrios V, Escobar C, et al. Detection of left ventricular hypertrophy by different electrocardiographic criteria in clinical practice. Findings from the Sara study. Clin Exp Hypertens. 2010;32:145–53.
- Molloy TJ, Okin PM, Devereux RB, et al. Electrocardiographic detection of left ventricular hypertrophy by the simple QRS voltage-duration product. J Am Coll Cardiol. 1992;20:1180–6.
- Sharma G, Goodwin J. Effect of aging on respiratory system physiology and immunology. Clin Interv Aging. 2006;1:253–60.
- Harlan WR, Graybiel A, Mitchell RE, et al. Serial electrocardiograms: their reliability and prognostic validity during a 24-yr. period. J Chronic Dis. 1967;20:853–67.
- Porthan K, Niiranen TJ, Varis J, et al. ECG left ventricular hypertrophy is a stronger risk factor for incident cardiovascular events in women than in men in the general population. J Hypertens. 2015;33:1284–90.
- Rautaharju PM, Park L, Rautaharju FS, et al. A standardized procedure for locating and documenting ECG chest electrode positions: consideration of the effect of breast tissue on ECG amplitudes in women. J Electrocardiol. 1998;31:17–29.
- Masui A, Tsuji H, Tamura K, et al. Effect of body characteristics on the variables of signal-averaged electrocardiograms in healthy subjects. Chest. 1994;105:1357–9.
- Kannel WB, Gordon T, Offutt D. Left ventricular hypertrophy by electrocardiogram. Prevalence, incidence, and mortality in the Framingham study. Ann Intern Med. 1969;71:89–105.
- Levy D, Murabito JM, Anderson KM, et al. Echocardiographic left ventricular hypertrophy: clinical characteristics. The Framingham heart study. Clin Exp Hypertens A. 1992;14:85–97.
- Angeli F, Verdecchia P, Iacobellis G, et al. Usefulness of QRS voltage correction by body mass index to improve electrocardiographic detection of left ventricular hypertrophy in patients with systemic hypertension. Am J Cardiol. 2014;114:427–32.
- Madias JE. Low QRS voltage and its causes. J Electrocardiol. 2008;41:498–500.
- Goudis CA, Konstantinidis AK, Ntalas IV, et al. Electrocardiographic abnormalities and cardiac arrhythmias in chronic obstructive pulmonary disease. Int J Cardiol. 2015;199:264–73.
- Drazner MH. The progression of hypertensive heart disease. Circulation. 2011;123:327–34.
- Goldberger AL, Bhargava V. Effect of exercise on QRS duration in healthy men: a computer ECG analysis. J Appl Physiol Respir Environ Exerc Physiol. 1983;54:1083–8.
- Fagard RH, Celis H, Thijs L, et al. Regression of left ventricular mass by antihypertensive treatment: a meta-analysis of randomized comparative studies. Hypertension. 2009;54:1084–91.
- Verdecchia P, Schillaci G, Borgioni C, et al. Prognostic value of a new electrocardiographic method for diagnosis of left ventricular hypertrophy in essential hypertension. J Am Coll Cardiol. 1998;31:383–90.