
Abstract
Purpose: To determine the association of changes in blood pressure (BP) components between baseline examination (1999–2001) and a second visit (2002–2005) with incident cardiovascular diseases (CVD).
Methods: In 3569 (2048 female) Iranian subjects ≥30 y, systolic BP, diastolic BP, mean arterial pressure (MAP) and pulse pressure (PP) were evaluated in two consecutive visits. Subjects were then followed for cardiovascular events. Multivariate sex-adjusted Cox Proportional-Hazards models were built for each BP component’s change, and further adjusted for baseline BP values, traditional cardiovascular risk factors, and their changes.
Results: During a median follow-up of 6.09 years after the second examination, 303 CVD cases occurred. A 1 SD increase in systolic BP, diastolic BP and MAP were significantly associated with 21%, 22%, and 95% increased CVD risk after adjustments for baseline values of BP components and other common risk factors (all p-values <0.05). Importantly, diastolic BP change resisted after further adjustment with systolic BP change (hazard ratio 1.21, CI 95% 1.05–1.39). PP change showed no significant association with CVD.
Conclusions: In a middle-aged population, three-year rises in systolic BP, diastolic BP, MAP, but not PP were associated with increased incident CVD. The significant association between diastolic BP change and CVD was shown independent of systolic BP change.
Introduction
Cardiovascular disease (CVD) is one of the headmost causes of disease burden in both developed and developing countries [Citation1]. Hypertension is well known as a major risk factor for CVD [Citation2]. Although the association between blood pressure (BP) and the risk of CVD is well demonstrated [Citation3], BP change has also been suggested as an independent risk factor for CVD [Citation4]. In many cases, BP varies between visits; such differences have been observed between daily, weekly, monthly and yearly physical examinations [Citation5]. One of the main involved factors could be aging which is related to change in different BP components among both normotensive and hypertensive individuals [Citation6]. The early studies on the outcomes of BP change arose from clinical trials on antihypertensive regimens [Citation7–9]. Parallel to the clinical trials, some prospective observations on the general population indicated that changes in BP were associated with risk of cardiovascular events including coronary heart disease [Citation10,Citation11], stroke [Citation12], and CVD related mortality [Citation13]. However, these studies were all conducted on European populations and mostly evaluated changes in systolic BP.
As indicated by global statistics, Asia and the Middle East region have the highest burden of CVD in the world [Citation14]. Epidemiologic studies in Iran, a Middle Eastern country, associate CVD with more than 40% of mortality rates [Citation15] and demonstrate hypertension as its most important modifiable risk factor [Citation16]. Hypertension is also of great importance in this region because of a high and increasing prevalence [Citation17]. In terms of BP components, we have demonstrated before that systolic BP, diastolic BP, mean arterial pressure (MAP) and pulse pressure (PP) were all associated with CVD, independent of other traditional risk factors [Citation18]. However, data is still lacking on the impacts of BP change in the Middle East.
In the present study, we aimed to investigate the association of changes in different BP components with CVD risk, in a Middle Eastern population.
Methods
Study population
This study was performed using data from a population-based cohort study called “Tehran Lipid and Glucose Study”, which is a prospective longitudinal community-based research conducted on a representative sample of the urban population of Tehran (the capital of Iran). The study was first established in 1999–2001 to estimate the prevalence/incidence of non-communicable disease risk factors. Data collection is continuing (and will continue for at least 20 years) and occurring every three years. The detailed study design has been discussed elsewhere [Citation19].
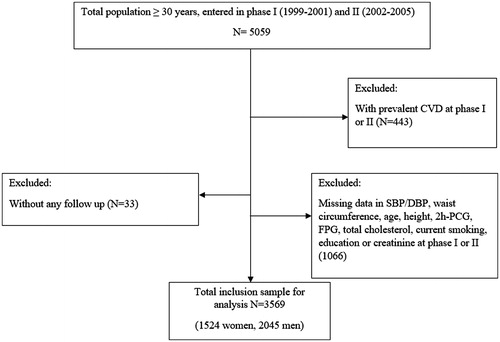
Of total 9752 individuals aged ≥30 years who attended in the first phase (1999–2001), 5059 also participated in the second (2002–2005) examinations of the cohort. After excluding participants with prevalent CVD in phase I or II (n = 605), missing data on systolic BP and diastolic BP and other covariates including body mass index, waist circumference, fasting plasma glucose, 2-hour post challenge plasma glucose, total cholesterol, creatinine and smoking status (n = 1066), and loss to follow-up data (n = 33), 3569 subjects remained, who were followed-up until 20 March 2012 ().
Figure 1. Outline of the selection design of study participants. SBP: systolic blood pressure, DBP: diastolic blood pressure, 2h-PCG: 2-hour post challenge plasma glucose, FPG: fasting plasma glucose, CVD: cardiovascular disease.
The Ethics Committee of the Research Institute for Endocrine Sciences, Shahid Beheshti University of Medical Sciences, approved the design of the Tehran Lipid and Glucose Study, and all participants provided written informed consent.
Medical history, clinical examination and laboratory measurements
Participants were interviewed in private by trained interviewers. A questionnaire was used to obtain demographic information. Subjects were questioned about their current smoking status and taking of any anti-diabetic or hypertension drugs. Physical examinations were performed by qualified physicians at baseline and repeated every three years. To measure BP, subjects were asked to abstain from eating, drinking tea or coffee, smoking or taking medications that affect BP for an hour and to empty their bladder 30 minutes before the examination. After remaining seated for 15 minutes, systolic and diastolic BPs were deliberated in a sitting position using a standardized mercury sphygmomanometer, calibrated by the Institute of Standards and Industrial Research of Iran. The cuff was selected based on the subject’s arm circumference, placed on the right arm at the heart level, and then inflated to 30 mm Hg beyond the pressure at which the radial pulse disappeared. Then the cuff was deflated at a 2–3 mm per second decrement rate and the first and fifth Korotkoff sounds were recorded as systolic and diastolic BP, respectively. Two readings were made, at least 30 seconds apart, and averaged to evaluate the subjects BP [Citation20].
Weight was measured, with subjects minimally clothed and without shoes, using digital scales (Seca 707: range 0.1–150 kg) and recorded to the nearest 100 g. Height was measured in a standing position without shoes, using a tape meter, while shoulders were in a normal alignment. Waist circumference was measured at the umbilical level over light clothing, using a tape meter, and measurements were recorded to the nearest 0.1 cm. Body mass index was calculated as weight in kilograms divided by height in meters, squared.
Blood samples were drawn after a 12–14 hour overnight fasting and centrifuged within 30–45 minutes. Fasting plasma glucose, total cholesterol, triglycerides, high-density lipoprotein cholesterol, and serum creatinine were assayed. 2-hour post challenge glucose was evaluated for those not taking glucose-lowering drugs. All analyses were performed in the Tehran Lipid and Glucose Study research laboratory and on the day of sample collection.
Cardiovascular disease outcome
In this study, the first CVD event was defined as coronary heart disease (including definite myocardial infarction, probable myocardial infarction, unstable angina, angiographic-proven coronary heart disease), and stroke (defined as a new neurological deficit that lasted more than 24 hours), and CVD-caused death. Details of cardiovascular outcome data collection have been explained elsewhere [Citation19].
Definition of terms
Positive family history of [premature] CVD was defined as the occurrence of CVD before 55 years of age (for men) or 65 years of age (for women) among first-degree family members. Diabetes at baseline was defined as fasting plasma glucose ≥7 mmolL-1 or 2-hour post challenge plasma glucose ≥11.1 mmolL-1 or taking anti-diabetic medications. Hypercholesterolemia was defined as serum total cholesterol ≥6.2 mmol L−1 or taking lipid lowering drugs. A current smoker was defined as a person who smoked cigarettes daily or occasionally versus a past or never smoker. Regarding the effect of smoking status change, we created four groups based on 1st (1999–2001) and 2nd (2002–2005) exam times (yes/yes, yes/no, no/yes and no/no). Education level was categorized into 3 groups: <6 years, 6–12 years, and ≥12 years (reference category). PP was derived by subtracting diastolic BP from systolic BP. MAP was calculated by the following equation: (2 × diastolic + systolic BP)/3. The estimated glomerular filtration rate was estimated by the abbreviated prediction equation, presented by the Modification of Diet in Renal Disease study [Citation21].
Statistical analysis
Mean (SD) amounts were shown for continuous variables and frequencies (%) for categorical variables. Skewed variables (e.g. triglyceride), were reported in terms of median (inter-quartile range). Comparison of baseline characteristics between respondents (those with systolic and diastolic BP data in both phases I and II who were followed until the end of study) and non-respondents (those with missing data of systolic BP, diastolic BP or other covariates in either phase I or II or those without any follow-up), as well as participants with CVD vs. without CVD, was performed by Student’s t-test for continuous variables and the Chi-square test for categorical variables and the Man-Whitney U statistic for non-normal variables. Multivariate Cox proportional hazard models were applied to evaluate associations of change in systolic BP, diastolic BP, PP and MAP levels with incident CVD.
A univariate analysis was performed for each potential covariate to be included in the multivariate analysis, including baseline measurements of different parameters and their changes. Variables with p-values less than 0.2 in the univariate analysis were entered in the multivariate Cox model. In the multivariate analysis three models were designed; model I included baseline measurements of gender, age and systolic BP/diastolic BP/PP/MAP change; model II further adjusted with the baseline value of each BP component. Model III; model II plus family history of CVD, estimated glomerular filtration rate, body mass index, waist circumference, diabetes mellitus, hypertension drugs, current smoking, hypercholesterolemia, education level and the baseline value of systolic BP for diastolic BP change and the baseline value of diastolic BP for systolic BP change. Model IV (only for systolic BP and diastolic BP changes); model III + changing values of systolic or diastolic BP, as appropriate.
The study survival time was the time from the start of follow-up period to the date of the first CVD event. The censoring time of an individual was the time from date of entry into the study until loss to follow-up or the study end (20 March 2012), whichever happened earlier.
In order to check the linearity assumption for continuous covariates, we used multivariate restricted cubic splines modeling with 3 knots (called by mvrs in Stata ado-file). This method warranties the linear and non-linear trends with outcome according to substantive background knowledge [Citation22]. Since the linear relationship between systolic BP/diastolic BP/MAP/PP change and CVD outcome in multivariate adjusted model has been shown (Supplemental Figures S1–S4), we reported adjusted hazard ratios (HR) with their 95% confidence intervals (CI) for 1-SD increase in each variable and their changing values.
We also examined the impact of change in different BP parameters used as categorical rather than continuous variables. In the categorical model, we classified the exact amount of systolic BP/diastolic BP/MAP/PP change into tertiles, considering the 1st tertile as reference.
Gender did not significantly modify the effects of systolic BP/diastolic BP/MAP/PP measures on outcomes in the multivariate model (min p-values >0.6); accordingly, the analyses was done on a gender-pooled sample to achieve optimal statistical power. In order to assess multi-collinearity, the variance inflation factor (VIF) was used among anthropometric measurements (body mass index and waist circumference) as well as systolic and diastolic BP and their changes in the multivariate model and no collinearity was observed (all VIF <3) [Citation23]. The proportionality of the multivariable Cox model was evaluated using Schoenfeld’s global test of residuals and all proportionality hypotheses were appropriate. To measure the relative quality of the models, the Akaike information criterion (AIC) was applied as a statistical estimation for goodness of fit; a lower value of AIC indicating better model fitness [Citation24]. A difference in AIC less than 10 essentially meansthat the models provide similar fits to a particular dataset [Citation25]. To measure the discrimination ability of the models, Harrell’s C-index was used; a value of 1 indicating perfect discrimination and a value of 0.5 being no better than probability [Citation26]. All analyses were performed using Stata version 12 SE, with a two-tailed p-value < 0.05 considered significant.
Results
Of the 3569 participants included in this study, the mean (SD) age was 46.1(11.66) years, 57.3% were female and 13.6% were current smokers. The mean (SD) levels for systolic BP, diastolic BP, PP and MAP were 120.44(18.64), 78.83(10.54), 42.22 (13.9) and 92.7(12.22) mmHg, respectively. Overall 6.5% of participants were taking antihypertensive medications (). The comparison between respondents and non-respondents is summarized in . Respondents were younger and had lower body mass index, systolic and diastolic BP, total cholesterol, triglyceride, fasting plasma glucose and reported less consumption of lipid lowering, BP lowering and glucose lowering medications, but they had a higher education level compared with non-respondents. Moreover, as expected in comparison with individuals without incident CVD, those with event showed generally more adverse CVD risk factors at baseline values as shown in Supplemental Table S1. The mean (SD) of systolic BP/diastolic BP/MAP/PP changes at total and each tertile are given in .
Table 1. Comparison of baseline characteristics between respondents and non-respondents.
Table 2. Blood pressure parameters’ changing values (n = 3569) between 1999–2001 and 2002–2005.
We found 303 new cardiovascular events (187 males) including 257 cases of coronary heart disease (19 fetal, 238 non-fatal) and 46 cases of stroke (8 fatal, 38 non-fatal) during a median of 6.09 years (inter-quartile range of 5.31–6.77 years) after the second examination.
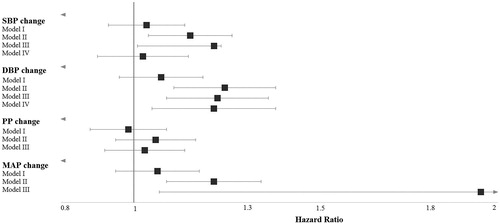
Results of multivariate Cox proportional hazard analysis for 1-SD increase in the change of different BP components between two visits are shown for each model in and Supplemental Table S2. Regarding systolic BP, a 1-SD change was associated with 15% [HR 1.15, CI 95% (1.04–1.27] increased risk of CVD events after adjustment for baseline value of systolic BP (model II). Further adjustment for other traditional risk factors as well as baseline value of diastolic BP did not attenuate the risk of systolic BP change (model III) [HR 1.21, CI 95% (1.01–1.24)]. However, after further adjustment for diastolic BP change (model IV) the risk for systolic BP change reached to null. Considering diastolic BP change, our data analysis showed significant risk for this parameter in models II, III and IV (all p-values <0.01). In fact, in the presence of baseline diastolic BP, systolic BP and its change and other CVD risk factors, a 9.14 mmHg increase in diastolic BP was associated with 21% significant risk of CVD events [HR 1.21, CI 95% (1.05–1.39)]. We did not see any significant association between PP change and risk of CVD events before and after adjustment for baseline value of PP and other risk factors in different models. For MAP change, a 1-SD change, after adjustment for baseline value of MAP, increased the risk of CVD [HR 1.21, CI 95% (1.09-1.35)]. Moreover, after adjustment for other CVD risk factors, the HR of MAP change reached to 1.95 [HR 1.95, CI 95% (1.07–2.33)].
Figure 2. Multivariate Cox proportional hazard analysis of 1 SD increase in the change of different blood pressure components between 1999–2001 and 2002–2005, for incident cardiovascular diseasesa. Model I: baseline measurements of gender, age and the main exposure; model II: Model I + baseline value of related blood pressure measurement; model III: Model II + baseline measurements of DBP/SBP, family history of CVD, eGFR, BMI, waist circumference, diabetes mellitus, hypertension drugs, current smoking, hypercholesterolemia and education level; model IV (only for SBP and DBP change): model III + changing value of SBP or DBP as appropriate. a: 1 SD change of SBP change: 13.8 mm Hg; 1 SD change of DBP change: 9.14 mm Hg; 1 SD change of PP change: 12.9 mm Hg and 1 SD change of MAP change: 9.5 mm Hg; systolic blood pressure (SBP); diastolic blood pressure (DBP); pulse pressure (PP); mean arterial pressure (MAP); body mass index (BMI); estimated glomerular filtration rate (eGFR); main exposures: SBP change, DBP change, MAP change and PP change.
The hazard ratios and 95% CI for covariates in different models for BP components are also shown in Supplemental Table S2. Accordingly, for both systolic and diastolic BP measures, the significant covariates in model IV were female gender [HR 0.51, CI 95% (0.38–0.68)], age [HR 1.91, CI 95% (1.62–2.27)], family history of CVD [HR 1.39, CI 95% (1.04–1.84)], waist circumference [HR 1.30, CI 95% (1.03–1.64)], current smoking [HR 1.58, CI 95% (1.14–2.20)] and hypercholesterolemia [HR 1.34, CI 95% (1.05–1.71)]. The same covariates also remained significant for PP and MAP in model III.
With respect to the discriminative power, our data analysis did not show significant increase in the models’ C-Index, moving from model II to IV for systolic and diastolic BP changes (i.e. model IV vs. model II: 79% vs. 77%) and from model II to model III for MAP (i.e. model III vs. model II: 78% vs. 77%). As reported by AIC, for both systolic and diastolic BP changes, model III had the best fitness compared with both models I and II and examining both systolic BP and diastolic BP change in model IV simultaneously did not significantly improve the level of AIC (model IVAIC – model IIIAIC < 10). Considering MAP however, moving from model II to model III significantly increased the model fitness (model IIIAIC – model II AIC = 15).
shows the HRs of systolic BP/diastolic BP/MAP/PP changes as categorical variables for incident CVD. Regarding diastolic BP, the 3rd tertile in both models II and III and for MAP the 3rd tertile only for model II showed a significant risk for CVD.
Table 3. Hazard ratios for predicting cardiovascular disease in different models of systolic/diastolic blood pressure, pulse pressure and mean arterial pressure change with respect to changing tertilesTable Footnotea.
Discussion
In the current study, we investigated the impact of three-year changes of different BP components on incident CVD events. Accordingly, we showed that a rise in diastolic BP, was significantly associated with increased risk of CVD, independent of baseline values of diastolic and systolic BP, systolic BP change and other important traditional risk factors; however, we did not find any risk for systolic BP change independent of diastolic BP change. Finally, changes in MAP but not PP were also associated with CVD.
It has been shown before that BP tends to change between visits [Citation5,Citation12,Citation27], however to our knowledge, the possible impacts of changes in BP components other that systolic BP have been understudied [Citation13]. In a Middle Eastern population, we have highlighted a mean SD of 13.8, 9.14, 12.9 and 9.56 mmHg for changing values of systolic BP, diastolic BP, PP and MAP, respectively, across two visits which were three years apart. The corresponding value for systolic BP change across two visits within a ten-year interval was 16.5 mmHg among middle-aged men from five European countries [Citation13]. In our study population, about 14 mmHg change in systolic BP during two successive measurements of BP was associated with 20% increased risk of CVD events independent of baseline values of systolic and diastolic BPs and other important risk factors (model III). Our results regarding the impact of systolic BP change were generally in line with previous studies measuring both long-term and short-term changes of systolic BP. In 1993, Menotti et al indicated that among Italian middle-aged men, systolic BP changes between years 0, 5, and 10 of follow-up, significantly improved the prediction of coronary events in the proceeding decade, after adjustment for baseline systolic BP [Citation10]. Later, using pooled data from ten European cohorts, Menotti et al demonstrated that each 10 mmHg change in systolic BP after 10 years, was associated with 14% increased risk of CVD-caused and 11% increased risk of all-cause mortality among men, independently from baseline systolic BP, age, serum cholesterol, body mass index and smoking [Citation13]. Also, in the Third National Health and Nutrition Examination Survey, Ye et al cross-sectionally assessed the spontaneous changes in systolic BP measured at two visits only 17 days apart, and indicated that systolic BP change could improve CVD risk estimation [Citation28]. Moreover, a study on seven-year changes of exercise-BP indicated that a rise in exercise systolic BP, predicts long-term risk of coronary heart disease in healthy middle-aged men [Citation29]. However, a study on a group of United States male physicians indicated that systolic BP changes in the past, did not add any information to the current levels of systolic BP in predicting CVD risk [Citation30]. Our findings expand the previous research by showing that although systolic BP change was associated with CVD, independently from baseline systolic BP level and other traditional risk factors [Citation4,Citation10,Citation13,Citation31], this association was not independent from diastolic BP change
In the current study, data analyses on a middle-aged population revealed that changes in the values of diastolic BP and MAP (which is highly affected by the level of diastolic BP), were strongly associated with incident CVD, after adjustments for a large set of traditional risk factors. Previously, Sesso et al had also highlighted the role of diastolic BP change in middle-aged men, where they demonstrated that diastolic, but not systolic BP change in the past two years, was associated with future CVD risk, independently from the current BP levels; concluding a possibly chronic impact of diastolic BP on atherosclerosis [Citation30]. Moreover, a review on observational studies and clinical trials on cardiovascular risk of diastolic hypertension indicated that diastolic BP was generally the main BP component to predict cardiovascular risk before the age of 50 [Citation32]. Diastolic BP has also been shown to increase until the age of 50–55 years in line with peripheral vascular resistance, and decrease afterwards as a surrogate for elastic artery stiffness [Citation33], highlighting the importance of this BP component in the middle-aged population. Considering that MAP is highly influenced by diastolic BP, we expected MAP change to reflect the association of diastolic BP change with CVD. As expected, our results demonstrated the potential role of change as a strong predictor of CVD incidence, to the point that one SD (9.56 mmHg) increase in MAP change was associated with almost two-fold higher risk of CVD in the general population
The results of this study should be interpreted in the context of several possible limitations. First, only about 80% of the participants from the original cohort were included in the current analysis. The respondents generally had a lower cardiovascular risk profile; hence, there is a potential bias towards underestimating the association between change of BP components with CVD. Second, due to the moderate number of cases, we were not able to further investigate the subtypes of CVD, separately. This could be of importance since the predictive value of the BP components’ changes may differ depending on the subtype of CVD studied [Citation34]
There are also several strengths. The current study is a large population-based cohort with a relatively long-term follow-up, which was held on a generally healthy population without prevalent CVD at baseline. Many of the previous studies investigating BP change have been performed as secondary analyses on randomized clinical trials including high risk patients [Citation7–9]; hence, data on the prognostic value of intra-individual BP change in the general population are scarce in the existing literature and to our knowledge, this is the first investigation considering changes in all BP components. BP measurements in both visits were performed in the same clinical setting, by a qualified physician, using identical protocols and equipment. This is particularly important since maintaining an acceptable level of error in BP measurements is a key concern in similar studies regarding BP changes [Citation5]. Moreover, to our knowledge, the current study is among the first ones to determine the impact of changes in different components of BP. Although each BP component has shown a different impact on incident CVD [Citation5,Citation18,Citation35], very few prospective studies have examined changes in BP components other than systolic BP in their analysis [Citation30].
Conclusion
In the current study, we investigated the association between BP change, using two consecutive measures with a 3-year interval, with CVD incidence, in a middle-aged population from the Middle East. The changes of systolic BP, diastolic BP and MAP were important risk factors for CVD, independent from baseline values of BP components and other traditional risk factors. However only diastolic BP change increased the risk of CVD, independently from systolic BP change. Further studies are needed to confirm these associations in other populations and to explore the underlying mechanisms.
Supplementary__R3_-BP_change.docx
Download MS Word (54.5 KB)Acknowledgements
This article has been extracted from the thesis written by Hosein Ghahvehchian in School of Medicine, Shahid Beheshti University of Medical Sciences.
Disclosure statement
The authors report no conflicts of interest.
Additional information
Funding
Related Research Data
References
- Guilbert J. The world health report 2002 - reducing risks, promoting healthy life. Educ Health (Abingdon). 2003;16:230.
- Lawes CM, Vander Hoorn S, Rodgers A. Global burden of blood-pressure-related disease, 2001. Lancet. 2008;371:1513–1518.
- Grove JS, Reed DM, Yano K, et al. Variability in systolic blood pressure-a risk factor for coronary heart disease? Am J Epidemiol. 1997;145:771–776.
- Hofman A. Change viewed on the level. Int J Epidemiol. 1983;12:391–392.
- Diaz KM, Tanner RM, Falzon L, et al. Visit-to-visit variability of blood pressure and cardiovascular disease and all-cause mortality: a systematic review and meta-analysis. Hypertension. 2014;64:965–982.
- Franklin SS, Gustin W, Wong ND, et al. Hemodynamic patterns of age-related changes in blood pressure. The Framingham Heart Study. Circulation. 1997;96:308–315.
- Collins R, Peto R, MacMahon S, et al. Blood pressure, stroke, and coronary heart disease. Part 2, Short-term reductions in blood pressure: overview of randomised drug trials in their epidemiological context. Lancet. 1990;335:827–838.
- Blood Pressure Lowering Treatment Trialists’ Collaboration. Effects of different blood-pressure-lowering regimens on major cardiovascular events: results of prospectively-designed overviews of randomised trials. Lancet. 2003;362:1527–1535.
- Samuelsson O, Wilhelmsen L, Andersson OK, et al. Cardiovascular morbidity in relation to change in blood pressure and serum cholesterol levels in treated hypertension. Results from the primary prevention trial in Göteborg, Sweden. JAMA. 1987;258:1768–1776.
- Menotti A, Seccareccia F, Lanti M, et al. Time changes in predictability of coronary heart disease in an Italian aging population. Cardiology. 1993;82:172–180.
- Tervahauta M, Pekkanen J, Enlund H, et al. Change in blood pressure and 5-year risk of coronary heart disease among elderly men: the Finnish cohorts of the Seven Countries Study. J Hypertens. 1994;12:1183–1190.
- Tolonen H, Mahonen M, Asplund K, et al. Do trends in population levels of blood pressure and other cardiovascular risk factors explain trends in stroke event rates? Comparisons of 15 populations in 9 countries within the WHO MONICA stroke project. World Health Organization monitoring of trends and determinants in cardiovascular disease. Stroke. 2002;33:2367–2375.
- Menotti A, Lanti M, Kafatos A, et al. The role of a baseline casual blood pressure measurement and of blood pressure changes in middle age in prediction of cardiovascular and all-cause mortality occurring late in life: a cross-cultural comparison among the European cohorts of the Seven countries study. J Hypertens. 2004;22:1683–1690.
- Wong ND. Epidemiological studies of CHD and the evolution of preventive cardiology. Nat Rev Cardiol. 2014;11:276–289.
- Khalili D, Mosavi-Jarrahi A, Eskandari F, et al. Evaluation of cause of deaths' validity using outcome measures from a prospective, population based cohort study in Tehran, Iran. PLoS One. 2012;7:e31427.
- Khalili D, Sheikholeslami FH, Bakhtiyari M, et al. The incidence of coronary heart disease and the population attributable fraction of its risk factors in Tehran: a 10-year population-based cohort study. PLoS One. 2014;9:e105804.
- Esteghamati A, Meysamie A, Khalilzadeh O, et al. Third national Surveillance of Risk Factors of Non-Communicable Diseases (SuRFNCD-2007) in Iran: methods and results on prevalence of diabetes, hypertension, obesity, central obesity, and dyslipidemia. BMC Public Health. 2009;9:167.
- Hadaegh F, Shafiee G, Hatami M, et al. Systolic and diastolic blood pressure, mean arterial pressure and pulse pressure for prediction of cardiovascular events and mortality in a Middle Eastern population. Blood Press. 2012;21:12–18.
- Azizi F, Ghanbarian A, Momenan A, et al. Prevention of non-communicable disease in a population in nutrition transition: Tehran lipid and glucose study phase II. Trials. 2009;10:5.
- Azizi F, Rahmani M, Emami H, et al. Cardiovascular risk factors in an Iranian urban population: Tehran Lipid and Glucose Study (Phase 1). Soz Praventivmed. 2002;47:408–426.
- Levey A, Bosch J, Lewis J, et al. A simplified equation to predict glomerular filtration rate from serum creatinine [Abstract]. J Am Soc Nephrol. 2000;11:155A.
- Harrell FE Jr. Resampling, validating, describing, and simplifying the model. Regression Modeling Strategies. New York City (NY): Springer; 2001. p. 87–103.
- Neter J, Kutner MH, Nachtsheim CJ, et al. Applied linear statistical models. Chicago (IL): Irwin Chicago; 1996.
- Agresti A. An introduction to categorical data analysis. New York City (NY): Wiley New York; 1996.
- Dziak JJ, Coffman DL, Lanza ST, et al. Sensitivity and specificity of information criteria. PeerJ PrePrints. 2012;3:e1103v2.
- Pencina MJ, D'Agostino RB. Overall C as a measure of discrimination in survival analysis: model specific population value and confidence interval estimation. Statist Med. 2004;23:2109–2123.
- Kuulasmaa K, Tunstall-Pedoe H, Dobson A, et al. Estimation of contribution of changes in classic risk factors to trends in coronary-event rates across the WHO MONICA Project populations. Lancet. 2000;355:675–687.
- Ye S, Wang YC, Shimbo D, et al. Effect of change in systolic blood pressure between clinic visits on estimated 10-year cardiovascular disease risk. J Am Soc Hypertens. 2014;8:159–165.
- Skretteberg PT, Grundvold I, Kjeldsen SE, et al. Seven-year increase in exercise systolic blood pressure at moderate workload predicts long-term risk of coronary heart disease and mortality in healthy middle-aged men. Hypertension. 2013;61:1134–1140.
- Sesso HD, Stampfer MJ, Rosner B, et al. Two-year changes in blood pressure and subsequent risk of cardiovascular disease in men. Circulation. 2000;102:307–312.
- Menotti A, Seccareccia F. Spontaneous changes of systolic blood pressure as predictors of future fatal events. Italian Research Group of the Seven Countries Study. Am J Hypertens. 1990;3:549–554.
- Li Y, Wei F-F, Wang S, et al. Cardiovascular risks associated with diastolic blood pressure and isolated diastolic hypertension. Curr Hypertens Rep. 2014;16:1–6.
- Franklin SS. The importance of diastolic blood pressure in predicting cardiovascular risk. J Am Soc Hypertens. 2007;1:82–93.
- Poortvliet RK, Ford I, Lloyd SM, et al. Blood pressure variability and cardiovascular risk in the PROspective Study of Pravastatin in the Elderly at Risk (PROSPER). PLoS One. 2012;7:e52438.
- Sesso HD, Stampfer MJ, Rosner B, et al. Systolic and diastolic blood pressure, pulse pressure, and mean arterial pressure as predictors of cardiovascular disease risk in men. Hypertension. 2000;36:801–807.