
Abstract
Purpose: The pre-illness basal mean arterial BP (MAP) is an important reference point to gauge the degree of relative hypotension among unwell patients. We aimed to assess mean bias, correlation, and agreement between basal MAP measured during nighttime ambulatory BP monitoring (ABPM) and basal MAP estimated using a standardized protocol.
Materials and methods: For a cohort of 137 consecutive patients, aged ≥40 years, who recently underwent ABPM, a blinded investigator estimated basal MAP from up to five most recent clinic BP measurements. Both basal MAP values, measured and estimated, were compared pairwise for each participant.
Results: We traced a median of 4 [interquartile range 3–5] previous BP measurements per patient over a median period of 132 [interquartile range 55–277] days up until the ABPM test. The estimated basal MAP (mean 88 ± 8 mmHg) was linearly related (Pearson’s r = 0.41, p = 0.0001) to the measured basal MAP (mean 88 ± 12 mmHg). Bland-Altman plot revealed a mean bias of 0.3 mmHg with agreement limits of ±22 mmHg.
Conclusions: The mean bias between estimated and measured values for basal MAP was insignificant and modest. When a recent nighttime ABPM is unavailable, a protocol based on recent clinic BP readings can be used to estimate patient’s basal MAP.
Study registration: Australian New Zealand Clinical Trials Registry ACTRN12613001382763.
Introduction
Prevention and treatment of low blood pressure (BP) is an integral part of in-hospital management of deteriorating patients. An optimal BP, however, may be different for different patients. Guidelines suggest individualizing BP targets according to patients’ pre-morbid state, as optimal mean arterial BP (MAP) targets are likely to be higher for patients with chronic arterial hypertension [Citation1–3]. Indeed, tailoring MAP targets for inpatients according to their pre-illness resting BP may spare vasopressor use among those who usually run a lower pre-illness BP or may restore baseline BP for those who usually run a higher pre-illness BP. Therefore, a patient’s pre-morbid resting or nighttime BP, hereto referred as ‘basal BP’, is a useful hemodynamic reference point for clinicians to either adjust MAP target or to assess degree of relative hypotension among acutely ill patients with potential shock state. The gold-standard technique to measure basal BP is a nighttime ambulatory blood pressure monitoring (ABPM) [Citation4]. However, it is very rare for patients to have a coincidental recent ABPM record at the time of presentation to hospital.
When ABPM is unavailable, and a patient looks unwell despite having an 'acceptable' BP, some clinicians may attempt to estimate a patient’s basal BP from his/her recent clinic BP measurements to assess whether the patient has a degree of relative hypotension. If such patients are admitted to ICU, intensivists may use this method to decide mean arterial BP (MAP) targets for vasopressor therapy during initial management of shock. However, accuracy of such a strategy in absence of a standardized protocol is unknown. A recent observational study demonstrated that BP achieved during vasopressor therapy often had no relationship to patients’ basal BP, resulting in a significant and varying degree of untreated relative hypotension (i.e., the BP-deficit between basal BP and achieved BP) [Citation5]. These data suggest that conventional BP targets among acutely ill patients are typically based on values broadly relevant to general population. Individualized BP target could potentially improve management of acutely ill patients, particularly those who are middle aged and elderly, as this age group has higher incidence of diagnosed or undiagnosed hypertension [Citation6,Citation7]. Therefore, a standardized method to estimate a patient’s basal BP is likely to facilitate more tailored management of hypotensive patients in the hospital.
Accordingly, the objective of this study was to investigate mean bias between a basal MAP estimated using a pre-specified protocol that was based on up to five recent previous clinic BP measurements, and the basal MAP measured with nighttime ABPM, among a cohort of patients who recently underwent an ABPM test through our cardiology outpatient service. Our hypothesis was that protocol-estimated basal MAP would correlate with ABPM-measured basal MAP, with a minimal bias.
Methods
This observational study was conducted at a university-affiliated, tertiary referral hospital in Australia. The study was prospectively registered at Australia and New Zealand Clinical Trials Registry (ACTRN12613001382763). The Human Research Ethics Committee approved the study (approval number 13/12/11/5.14) and waived the need for informed consent.
We screened consecutive patients aged 40 years or more, who underwent an ABPM test within the last twelve months. Exclusion criteria included insufficient number (less than two) of available pre-morbid BP measurements during the preceding three years, or a diagnosis of dialysis-dependent end stage renal failure. We chose an age range of 40 years and above, as this age group is associated with a higher incidence of hypertension and other comorbidities, and would be more likely to have previous visits to the clinic and therefore, would have available pre-morbid BP measurements [Citation5]. This is also an age group that is common in ICU [Citation8], and is more likely to suffer adverse effects of untreated relative hypotension (BP deficit) during management of shock [Citation5]. We chose a minimum requirement of at least two previous BP measurements as recommended by the Joint National Committee (JNC) on prevention, detection, evaluation and treatment of hypertension [Citation9]. We chose a ceiling of five most recent BP measurements as it would more likely reflect a patient’s recent BP.
For all enrolled patients, an investigator, who was blinded to patients’ ABPM results, estimated their basal MAP by following a pre-specified standardized protocol, which was also displayed on the study registration webpage before the start of patients’ enrolment. The first step in the protocol was to trace up to five most recent discrete BP measurements, which were recorded at least 12 hours apart during previous routine outpatient visits up until the day of ABPM testing. In cases where BP measurements were not available from a previous outpatient visit, the BP measurements were then traced from the last 48 hours of an inpatient stay where the patient was discharged home. The next step was to estimate nighttime BP, for which the daytime clinic BP measurement was reduced by 15% to account for average nocturnal dip in BP in accordance with current literature [Citation5,Citation9–12]. Basal BP was derived as an average of these estimated nighttime BP values. The final step was to derive MAP from the systolic BP (SBP) and diastolic BP (DBP), using 2/3-1/3 rule i.e., MAP = DBP + (SBP-DBP)/3 [Citation13]. This protocol-derived value was recorded as an estimated basal MAP for each participant.
The measured basal BP was extracted directly from the nighttime ABPM record, which provided an average of nocturnal BP readings for each participant. The nighttime BP measurements were taken each hour between 8 PM and 6 AM using Mobil-O-Graph® new generation ABPM classic monitor for all participants. Basal MAP was derived from the average nighttime SBP/DBP using 2/3-1/3 rule, and this value was recorded as a measured basal MAP for each participant.
Besides data on demographics and comorbidities for each participant, we collected data on previous BP measurements including the date of measurements and contact details of the clinic where BP was measured. The primary outcome measure was the mean bias between an estimated basal MAP and a measured basal MAP for the cohort. The secondary outcome measures were the strength of linear relationship and limits of agreement between estimated and measured basal MAP. Other outcome measures were the mean bias between estimated and measured basal MAP in various subgroups based on gender, history of chronic hypertension, diabetes mellitus, chronic kidney disease and stroke.
Statistics
Statistical analysis was performed using STATA version 13.1 (StataCorp, Tex). Key variables were summarized using descriptive analysis and reported as mean (standard deviation (SD)) or median (interquartile range [IQR]) or numbers (%). BP variables were initially assessed for normality. The measured and estimated basal BP values were compared using a paired t-test. The strength of the linear relationship between the measured and estimated basal BP values was reported using Pearson’s r statistic. The Bland-Altman plot was used to demonstrate bias and agreement limits [Citation14]. Given that limits of ±15.7 mmHg, which correspond to a SD of 8 mmHg [Citation15,Citation16], are considered acceptable to validate a new BP measuring device against the gold standard, the bias data points that were outside of this acceptable precision range were reported as numbers (%). A simple linear regression analysis was used to estimate associations between the mean bias between measured and estimated basal MAP and various other potential variables. A two-sided p-value of <0.05 was considered statistically significant. The sample size was pre-specified, and given no prior data, its calculation was convenience-based.
Results
A total of 192 consecutive patients underwent ABPM test over a span of twelve months from January to December 2013. 137 eligible patients were enrolled in the study (). summarizes the demographics, comorbidities and key variables in the cohort. 107 (78%) patients had a history of chronic arterial hypertension. A total of 506 clinic BP measurements, corresponding to a median of 4 [IQR 3–5] recent past BP measurements per patient, were traced for the cohort over a median period of 132 [IQR 55–277] days leading up to the day of ABPM test. The mean protocol-estimated basal MAP was 88 (SD 8) mmHg, and the mean ABPM-measured basal MAP was 88 (SD 12) mmHg, both with normal distribution (, Citation3]. The ABPM-measured basal MAP was higher than 70 mmHg in 96% of the patients.
Figure 1. Patient flow diagram.
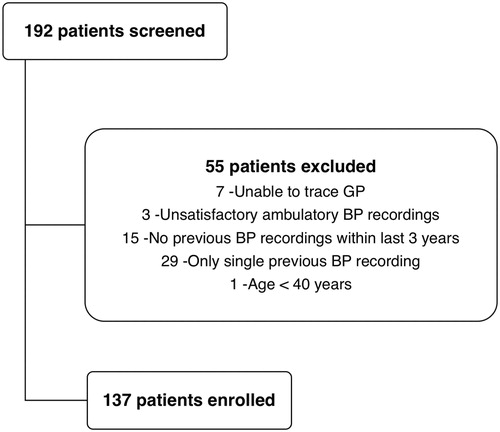
Figure 2. Frequency histogram showing normal distribution of the measured basal MAP and the estimated basal MAP.
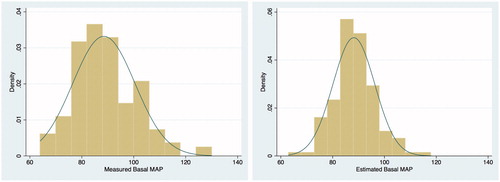
Table 1. Cohort characteristics and key results.
There was a significant linear relationship between the two basal MAP values (Pearson’s r = 0.41, p = 0.0001) (). The Bland-Altman plot revealed a mean bias of 0.3 mmHg between the measured and the estimated basal MAP, with agreement limits of ±22 mmHg (). 14 (10%) patients had bias greater than 15.7 mmHg, and 9 (7%) patients had bias less than -15.7 mmHg. Results were similar for estimated and measured basal SBP and basal DBP respectively ().
Figure 3. Box plots of the measured and estimated basal systolic BP (A), diastolic BP (B) and mean arterial BP (C). These are vertical box-and-whisker plots, where the central line within the box represents the median value, the two ends of boxes represent the first and the third quartile values, and the two ends of whiskers represent the upper and lower adjacent values.
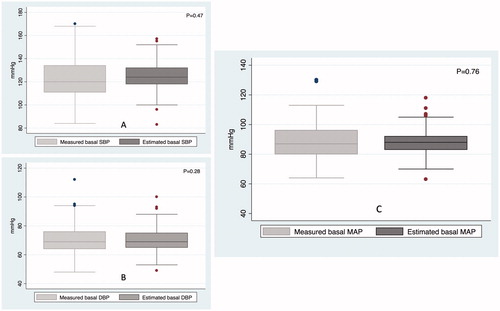
Figure 4. Correlation between the measured and estimated basal systolic BP (A), diastolic BP (B) and mean arterial BP (C). These plots show strength and direction of linear relationship between estimated and measured basal BP values. The Pearson’s r statistic of >0.4 in all the three panels represents fair correlation.
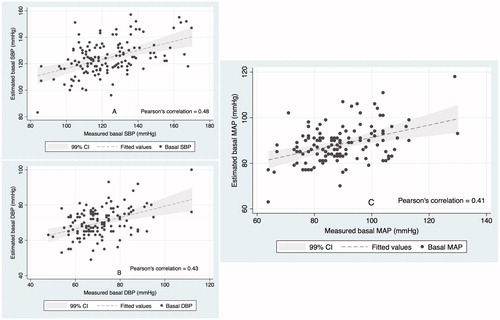
Figure 5. Bland-Altman plots for the measured and estimated basal systolic BP (A), diastolic BP (B) and mean arterial BP (C). These plots demonstrate mean bias and upper and lower agreement limits in each panel. The shaded portion represents the pre-designated precision limits of ±15.7 mmHg, which corresponds to a standard deviation of 8 mmHg [Citation15,Citation16] and are considered acceptable to validate a new BP measuring device against the gold standard.
![Figure 5. Bland-Altman plots for the measured and estimated basal systolic BP (A), diastolic BP (B) and mean arterial BP (C). These plots demonstrate mean bias and upper and lower agreement limits in each panel. The shaded portion represents the pre-designated precision limits of ±15.7 mmHg, which corresponds to a standard deviation of 8 mmHg [Citation15,Citation16] and are considered acceptable to validate a new BP measuring device against the gold standard.](/cms/asset/7a550149-59bb-451c-8630-f24276efae08/iblo_a_1358055_f0005_c.jpg)
lists the paired comparisons of measured and estimated basal MAP in various subgroups. There were no significant differences between the measured and the estimated basal MAP among the subgroups, except for patients with chronic kidney disease (p = 0.02) and stroke (p = 0.04) (). shows univariate analysis between various potential variables and the bias between measured and estimated basal MAP. On multiple regression analysis, after controlling for all variables listed in , the age category was the only significant variable, although with a weak association (adjusted r-squared value =7%). The mean bias between measured and estimated basal MAP tended to increase in the age category of 70 years or above, as compared to age category of less than 70 years, with a regression coefficient of 4.8 (95% CI: 0.7–8.8, p = 0.02). contrasts the precision parameters of protocol-estimated basal MAP with those of the current standard MAP targets of 65 or 70 mmHg.
Table 2. Comparison between measured and estimated basal MAP in various subgroups.
Table 3. Univariate analysis of variables and the bias between measured and estimated basal MAP.
Table 4. Bias and agreement between measured and estimated basal MAP in different scenarios.
Discussion
Key findings
In this study, we investigated whether it is possible to accurately estimate a patient's basal MAP using a preset protocol based on recent clinic BP measurements. This was performed among patients who had a recent ABPM-measured basal BP, which could be compared to their protocol-estimated basal BP. We observed that overall mean biases between the measured values and the estimated values for basal MAP, basal SBP or basal DBP were insignificant. However, agreement limits were relatively wide. These findings indicate that when a recent ABPM record is unavailable, a protocol based on recent available clinic BP measurements may be used to estimate patients’ basal MAP.
Relationship to previous studies
To our knowledge, there is only one previous study that followed such a protocol to estimate patients’ basal MAP [Citation5]. The estimated mean basal MAP in our study cohort (88 mmHg) was significantly higher than the estimated mean basal MAP in a previous study (81 mmHg) [Citation5], likely due to potential differences in the population sample. We enrolled only those patients who were referred for ABPM for a medical reason, implying that we probably ended up selecting a group that was more likely to suffer from conditions such as suspected white coat hypertension, labile BP, borderline or masked hypertension, or difficult to control hypertension. However, it is quite reassuring to note that even in this group of patients, our protocol-estimated basal BP values, on average, approximated the actual ABPM-measured values. There were two subgroups, chronic kidney disease and stroke, where the protocol appeared to underestimate the measured basal MAP ( and ), although the number of patients in each of these subgroups were too small to draw definite conclusions. Further, the statistical significance of the difference in mean bias within both these subgroups disappeared when adjusted for age. Nonetheless, we urge caution with regard to considering protocol estimated basal MAP to make clinical decisions in these particular subgroups. Tendency towards a greater BP variability among patients with chronic kidney disease [Citation17] and stroke [Citation18] might result in an underestimation of patients’ true basal MAP in these two subgroups.
With regards to actual ABPM-measured values, the measured basal SBP (mean 123 ± 18 mmHg) and the measured basal DBP (mean 71 ± 11 mmHg) in our study were similar to the nighttime SBP (mean 121 ± 17 mmHg) and the nighttime DBP (mean 68 ± 10) values observed in an epidemiological study that enrolled 8,575 patients from 11 ambulatory BP clinics across six Australian states [Citation11].
The Bland-Altman plot show an insignificant mean bias, although with wide agreement limits. We analyzed our data against the preset agreement limits of ±15.7 mmHg, which are considered acceptable to determine equivalence between the two BP measuring devices that measure BP in the same setting at the same time-point [Citation16]. Although this scenario does not apply to our study, nevertheless, 83% of the bias data points in the cohort were within these precision limits of ±15.7 mmHg. Variability in the bias could be a result of multiple factors such as inherent long term or short term variability in BP over a period of time, errors in BP measurements, or significant variability in the degree of nocturnal dip in BP in the cohort. However, the relatively wide limits of agreement observed in our study are inconsequential, as the purpose of this study was not to replace the use of nighttime ABPM with a protocol. The nighttime ABPM remains the gold standard non-invasive method to accurately determine the average nocturnal BP for a patient or to identify a patient who is a non-dipper or an extreme-dipper in regards to nocturnal decline in BP [Citation4].
Implication of the study findings
The absence of any significant mean bias between ABPM-measured and protocol-estimated basal MAP suggests that when a recent ABPM is unavailable, a standardized protocol can be used to estimate patients’ basal MAP. The relatively wide limits of agreement imply that clinicians should be aware of potential imprecision of an estimated basal MAP when taking it into account to decide appropriate MAP targets during in-hospital management. This is not unexpected as any estimation in medical practice is bound to be imprecise to some degree. In this study cohort, the protocol underestimated the true basal MAP by more than the precision threshold of 15.7 mmHg in 10% of cases, and overestimated the true basal MAP by more than the precision threshold in 7% of cases. On a post hoc analysis, patients’ age was found to have an independent effect on the mean bias, with the protocol tending to underestimate basal MAP by an average of approximately 5 mmHg among patients aged 70 years or above versus those aged <70 years. Likewise, the regression coefficient of the bias in relation to the average of measured and estimated basal MAP was 0.5 with a r-squared value of 16%, implying that the protocol tended to underestimate basal MAP at higher MAP values. However, the precision data for currently recommended MAP target values, as shown in , demonstrate that the precision parameters of the protocol were still far better than those of the uniform MAP values. The main implications are for deteriorating or hypotensive patients in hospital or during management of patients with shock, where MAP target of 65 mmHg continue to be widely recommended [Citation1]. The measured basal MAP range of 64–130 mmHg in this study implies that if, hypothetically, this cohort had been admitted to hospital with hypotension due to vasodilatory shock, then over 96% of these patients could have had potentially inadequate treatment of relative hypotension.
The knowledge of a patient's pre-morbid basal BP may therefore be useful for clinicians in their attempt to prevent unrecognized or untreated relative hypotension. There are as yet no randomized controlled trials comparing standard care to a strategy of treating relative hypotension assessed on the basis of patients’ pre-morbid basal BP. Three recent observational studies [Citation5,Citation19,Citation20] have highlighted that the conventional approach to manage BP may result in varying degree of untreated relative hypotension among patients. All these studies have also consistently observed an association between such BP-deficit and the progression of acute kidney injury during patients’ stay in hospital [Citation5,Citation19,Citation20]. Therefore, patients' basal BP is a potentially valuable reference point for tailoring BP targets to each individual patient. With increased awareness amongst clinicians about the potential benefits of individualized BP targets for each patient, our study protocol may also provide a framework for estimating basal BP in future interventional studies.
Strengths and limitations
This is the first study to report magnitude of potential inaccuracy while estimating a patient’s basal BP from previous available clinic BP measurements. Consecutive patients were enrolled in this study to help reduce selection bias. The study was prospectively registered and the protocol was pre-specified and displayed on the registration webpage. The sample size was sufficient enough to demonstrate a statistically significant linear relationship between the estimated value and the measured value for the BP. Our study protocol will be of interest to a broad range of clinicians as it is for the first time that a standardized method to estimate a patient’s basal BP has been described. It may be particularly useful for clinicians who wish to assess degree of untreated relative hypotension among patients under their care.
There are some limitations. First, this was a single center study. However, this was an outpatient setting at a tertiary referral center which serves nearly 1 million people, and the measured basal BP was similar to that observed in a large epidemiological study implying a degree of generalizability for our findings. Second, recent BP values were traced retrospectively, indicating that there was no standardized technique or a uniform device to measure BP across all the health clinics. Some centres used mercury sphygmomanometer and some used aneroid sphygmomanometer or oscillometry-based digital BP monitors, reflecting a real world setting. The general practitioners’ practices in Australia generally follow well established guidelines and general principles for in-clinic BP measurements, including at least once a year servicing and regular calibration of automated devices against a mercury sphygmomanometer. These policies are promulgated by the Royal Australian College of General Practitioners (http://www.racgp.org.au/your-practice/guidelines/redbook/8-prevention-of-vascular-and-metabolic-disease/82-blood-pressure/) and NPS Medicinewise (https://www.nps.org.au/__scrivito/measuring-blood-pressure-47ae621f899221df). Third, all recorded values for BP in the past medical records were in SBP/DBP format, necessitating using the 2/3-1/3 rule to calculate MAP. However, other studies have used similar methodology [Citation5,Citation19], and one previous study showed a small overall difference (±1.8 mmHg) between the measured MAP versus the formula-calculated MAP [Citation13].
To conclude, in absence of a recent ABPM record, a patient’s basal MAP may be estimated following a standardized protocol based on recent available clinic BP measurements. This may be useful to clinicians who wish to prevent unrecognized or untreated relative hypotension among patients with potential shock state. Clinicians should be mindful of potential imprecision while estimating a patient’s basal MAP, particularly among elderly patients (aged >70 years) and at higher MAP values.
Acknowledgements
We also acknowledge Mr Simon McElduff (School of Medicine and Public Health, University of Newcastle, Australia) for statistical support, and Ms Emily Ashburner for providing the database of patients who underwent ambulatory BP monitoring at our Cardiology department outpatient clinic.
Disclosure statement
No potential conflict of interest was reported by the authors.
References
- Dellinger RP, Levy MM, Rhodes A, et al. Surviving sepsis campaign: international guidelines for management of severe sepsis and septic shock: 2012. Crit Care Med. 2013;41:580–637.
- Asfar P, Meziani F, Hamel JF, et al. High versus low blood-pressure target in patients with septic shock. N Engl J Med. 2014;370:1583–1593.
- Cecconi M, De Backer D, Antonelli M, et al. Consensus on circulatory shock and hemodynamic monitoring. Task force of the European Society of Intensive Care Medicine. Intensive Care Med. 2014;40:1795–1815.
- O'Brien E, Parati G, Stergiou G. Ambulatory blood pressure measurement: what is the international consensus? Hypertension. 2013;62:988–994.
- Panwar R, Lanyon N, Davies AR, et al. Mean perfusion pressure deficit during the initial management of shock–an observational cohort study. J Crit Care. 2013;28:816–824.
- AIHW. AIHW analysis of AusDiab study. In: Australia's health. Canberra: Australian Institure of Health and Welfare; 2008.
- Gillespie CD, Hurvitz KA. (CDC) CfDCaP. Prevalence of hypertension and controlled hypertension - United States, 2007–2010. MMWR Suppl. 2013;62:144–148.
- Evaluation ANZICS Centre for Outcome and Resource Evaluation. Annual Report. Melbourne, Australia; 2012–2013.
- Chobanian AV, Bakris GL, Black HR, et al. The seventh report of the Joint National Committee on prevention, detection, evaluation, and treatment of high blood pressure: the JNC 7 report. JAMA. 2003;289:2560–2572.
- Kikuya M, Hansen TW, Thijs L, et al. Diagnostic thresholds for ambulatory blood pressure monitoring based on 10-year cardiovascular risk. Circulation. 2007;115:2145–2152.
- Head GA, Mihailidou AS, Duggan KA, et al. Definition of ambulatory blood pressure targets for diagnosis and treatment of hypertension in relation to clinic blood pressure: prospective cohort study. BMJ. 2010;340:c1104.
- Tanamas S, Magliano D, Lynch B, et al. AUSDIAB 2012: the Australian Diabetes, Obesity and Lifestyle Study. Victoria, Australia; 2013.
- Kiers HD, Hofstra JM, Wetzels JF. Oscillometric blood pressure measurements: differences between measured and calculated mean arterial pressure. Neth J Med. 2008;66:474–479.
- Bland JM, Altman DG. Measuring agreement in method comparison studies. Stat Methods Med Res. 1999;8:135–160.
- O'Brien E, Atkins N. A comparison of the British Hypertension Society and Association for the Advancement of Medical Instrumentation protocols for validating blood pressure measuring devices: can the two be reconciled? J Hypertens. 1994;12:1089–1094.
- Lee M, Weinberg L, Pearce B, et al. Agreement between radial and femoral arterial blood pressure measurements during orthotopic liver transplantation. Crit Care Resusc. 2015;17:101–107.
- Tanner RM, Shimbo D, Dreisbach AW, et al. Association between 24-hour blood pressure variability and chronic kidney disease: a cross-sectional analysis of African Americans participating in the Jackson heart study. BMC Nephrol. 2015;16:84.
- Stevens SL, Wood S, Koshiaris C, et al. Blood pressure variability and cardiovascular disease: systematic review and meta-analysis. BMJ. 2016;354:i4098.
- Wong BT, Chan MJ, Glassford NJ, et al. Mean arterial pressure and mean perfusion pressure deficit in septic acute kidney injury. J Crit Care. 2015;30:975–981.
- Saito S, Uchino S, Takinami M, et al. Postoperative blood pressure deficit and acute kidney injury progression in vasopressor-dependent cardiovascular surgery patients. Crit Care. 2016;20:74.