
Abstract
Objectives: To investigate, whether renal denervation (RDN) improves arterial stiffness, central blood pressure (C-BP) and heart rate variability (HRV) in patients with treatment resistant hypertension.
Methods: ReSET was a randomized, sham-controlled, double-blinded trial (NCT01459900). RDN was performed by a single experienced operator using the Medtronic unipolar Symplicity FlexTM catheter. C-BP, carotid-femoral pulse wave velocity (PWV), and HRV were obtained at baseline and after six months with the SphygmoCor®-device.
Results: Fifty-three patients (77% of the ReSET-cohort) were included in this substudy. The groups were similar at baseline (SHAM/RDN): n = 27/n = 26; 78/65% males; age 59 ± 9/54 ± 8 years (mean ± SD); systolic brachial BP 158 ± 18/154 ± 17 mmHg; systolic 24-hour ambulatory BP 153 ± 14/151 ± 13 mmHg. Changes in PWV (0.1 ± 1.9 (SHAM) vs. −0.6 ± 1.3 (RDN) m/s), systolic C-BP (−2 ± 17 (SHAM) vs. −8 ± 16 (RDN) mmHg), diastolic C-BP (−2 ± 9 (SHAM) vs. −5 ± 9 (RDN) mmHg), and augmentation index (0.7 ± 7.0 (SHAM) vs. 1.0 ± 7.4 (RDN) %) were not significantly different after six months. Changes in HRV-parameters were also not significantly different. Baseline HRV or PWV did not predict BP-response after RDN.
Conclusions: In a sham-controlled setting, there were no significant effects of RDN on arterial stiffness, C-BP and HRV. Thus, the idea of BP-independent effects of RDN on large arteries and cardiac autonomic activity is not supported.
Introduction
Increased sympathetic nerve activity (SNA) plays a role in raising BP during all phases of hypertension [Citation1,Citation2]. Renal sympathetic nerves constitute an easily attainable target for SNA-lowering in the clinical setting and the hope has been that renal denervation (RDN) would be helpful in lowering systemic blood pressure (BP). During the last decade catheter based RDN has become widely used for the treatment of resistant hypertension. Despite promising results in the initial proof of concept trials [Citation3,Citation4], later sham-controlled and adequately powered trials including our ReSET trial found no significant effect of RDN on 24-hour ambulatory BP measurements (24h-ABPM) [Citation5–7]. In the hope that RDN would reduce BP substantially, we planned the current substudy some years ago to investigate whether RDN could also improve arterial stiffness measured by pulse wave velocity (PWV) and central aortic BP (C-BP).
C-BP is different from conventionally measured brachial BP due to the variable superimposition of incoming and reflected pulse waves following changes in arterial stiffness [Citation8]. Normally, the forward going aortic pressure wave is reflected from the periphery and returns in diastole, thus serving to maintain coronary blood flow [Citation8]. PWV and the amplitude of the reflected pulse wave increase as the large arteries stiffen with age or due to diseases affecting the cardiovascular (CV) system such as atherosclerosis, hypertension, diabetes and chronic renal failure [Citation9–11]. The reflected wave then appears in the aorta during systole, augmenting systolic C-BP and cardiac afterload [Citation11], which in turn enhances the risk of stroke [Citation12] and left ventricular hypertrophy [Citation13]. Aortic stiffness is the gold standard measure of arterial stiffness and is usually obtained by measuring carotid-femoral PWV [Citation9,Citation10]. PWV is highly dependent on BP as well as age [Citation9] and recently reference values for a given age and BP were established [Citation12]. In hypertensive patients, PWV has independent predictive value for fatal and non-fatal CV events [Citation13,Citation14]. Wave reflection can be quantified through the augmentation index (AIx), which is commonly regarded as a measure of both the enhancement (augmentation) of C-BP by a reflected pulse wave as well as a marker of arterial stiffness [Citation14]. C-BP, PWV and AIx could all potentially be affected by SNA-lowering interventions such as RDN via modulation of arterial smooth muscle tone [Citation15,Citation16].
Also, we collected data to analyze whether RDN affected heart rate variability (HRV), a non-invasive measure of cardiac autonomic activity. HRV describes variation in the time interval between heart beats and reflects a mixture of both SNA and parasympathetic nervous system activity (PNA) [Citation17]. The frequency domain HRV-parameter low frequency (LF) power represents both SNA and PNA, whereas high frequency (HF) power represents mainly PNA. Accordingly, the LF/HF ratio is often interpreted as a measure of sympathovagal interactions on heart rate [Citation17].
So far, several studies have investigated changes in arterial stiffness [Citation18–20], C-BP [Citation20–22], AIx [Citation20,Citation22,Citation23] and HRV [Citation24] as a measure of SNA after RDN, but none of these were randomized sham-controlled studies, which to some extent hampers their usefulness when assessing the effects of RDN, since the BP reduction is likely to have occurred for other reasons than RDN itself. In light of this, it seemed very relevant to investigate and report on the effects of RDN on arterial stiffness, C-BP and HRV in a sham-controlled double-blinded setup, which was the aim of the present study.
Methods
Study design
Study design, inclusion criteria and results on 24h-ABPM have previously been published [Citation7]. Briefly, the ReSET-study (acronym for Renal Sympathectomy in Treatment Resistant Essential Hypertension, a Sham Controlled Randomized Trial) was a double blind randomized sham-controlled trial. It was initiated before the SYMPLICITY HTN-3 trial and was conducted between September 2011 and February 2015. The study was investigator initiated and was performed without company support. Seven hypertension outpatient clinics, all located in the Central Region of Denmark, participated in the trial. Patients with therapy-resistant essential hypertension, aged between 30 and 70 years, were randomly assigned to undergo catheter-based RDN or a SHAM procedure in a 1:1 ratio. Patients and caretaking physicians in the hypertension outpatient clinics were blinded concerning the randomization outcome during the 6-month follow-up period.
The main inclusion criteria were: Age [30–70] years; 1 month of stable treatment with at least 3 antihypertensive agents including a diuretic (or in case of diuretics intolerance a minimum of 3 non-diuretic drugs), daytime ABPM systolic blood pressure ≥145 mmHg, preceded by 14 days of scheduled drug intake showing at least 85% adherence.
The main exclusion criteria were: Chronic renal failure (eGFR <30 ml/min per 1.73 m2), secondary hypertension, coronary artery disease, permanent atrial fibrillation, left ventricular ejection fraction <50%, renal artery disease, multiple renal arteries, renal artery diameter <4 mm, renal artery length <20 mm.
Secondary forms of hypertension were excluded by means of computed axial tomography imaging of renal arteries (renal artery stenosis), echocardiography (coarctation of the aorta), hormone analysis (aldosteronism, hyperthyroidism and pheocromocytoma) and physical examination (Cushing disease). The study was conducted in accordance with the ethical standards described in the Helsinki Declaration. The Central Denmark Region Committees on Biomedical Research Ethics approved the study. Clinical Trials ID: NCT01459900. All patients provided written informed consent before randomization.
Renal denervation
All invasive procedures were carried out at one single invasive cardiovascular center and performed by a single experienced invasive cardiologist who, in addition, was both proctored and further qualified by 10 pretrial technically successful RDN procedures, as previously described [Citation25].
Renal angiography was performed to confirm the findings from the renal computed axial tomography angiography that renal artery anatomy was suitable for RDN therapy. At this moment, sedative drugs were administered (fentanyl and midazolam) to obtain a heavy sedation, and the patient was then randomized for a SHAM procedure or a RDN procedure using a computer. If allocated to a SHAM procedure, the diagnostic catheter was kept in situ and dummy radiograph scan performed for another 10–15 min before removing the femoral sheath from the sedated patient. If allocated to RDN treatment, the unipolar Symplicity FlexTM renal denervation catheter (Medtronic) was advanced and four-to-six discrete, low-power radio frequency treatments were systematically applied to cover the entire circumference in a spiral manner along the length of each main renal artery. Each single point of ablation was considered technically successful when 2 min of ramped (5–8 W) and undisrupted energy delivery could be achieved, meaning that impedance and/or temperature levels stayed within the program limits, by which the generator would otherwise switch off. After the procedure, patients were submitted to the ward for routine observation and were discharged in the evening or the next morning.
Blood pressure measurements
ABPM was performed with either the SpaceLabs 90207 or 90217 ABPM monitor with BP readings every 20 min. Nighttime and daytime periods were defined according to the European Society of Hypertension recommendation of short fixed interval on the basis of hour-averaged values; 0100–0600 (night) and 0900–2100 (day) [Citation26]. A minimum of 50% successful readings during nighttime and daytime were demanded for each ABPM to qualify for analysis.
Peripheral brachial BP was measured after 5 minutes of rest with a Microlife BP A100 PLUS automatic oscillometric BP monitor (Widnau, Switzerland), which fulfills current recommendations [Citation27]. The BP monitor was tested regularly for accuracy and precision. Cuff size was selected to fit the circumference of the upper arm. All participants had BP measurements on both arms and if the difference in systolic BP exceeded 20 mmHg or diastolic BP 10 mmHg, the arm with the higher pressure was used. Otherwise BP measurements were recorded on the right arm. Multiple BP measurements were performed on the selected arm to ensure two consecutive measurements with ≤5 mmHg deviation in both systolic BP and diastolic BP and the mean of the last two measurements were used.
Pulse wave analysis and PWV
Pulse wave analysis (PWA) and PWV measurements were performed by trained investigators in a quiet room after at least 5 minutes of supine rest using applanation tonometry applied on the carotid artery (CA), femoral artery (FA), and radial artery with the SphygmoCor (version 8.2, Atcor Medical, Sydney, Australia) system. PWA was performed in duplicate and subsequently averaged using a minimum operator index of 80 (median operator index (range) was 100 (81–100)%). C-BP was estimated by calibrating the waveforms with brachial systolic and diastolic BP obtained as described above. Carotid-femoral PWV was obtained by sequential recordings of pressure waveforms at the CA and FA combined with a simultaneous recording of an electrocardiogram. Capture time was set to 10 seconds. A minimum of two measurements with visually acceptable waveforms and equal heart rates at both sites were obtained using the intersecting tangent algorithm for estimation of transit time. The mean of the two PWV measurements were averaged as recommended [Citation28]. Length was approximated by subtracting the distance between the suprasternal notch and CA from the distance between suprasternal notch and FA. The distance was measured with a tape measure. The newest guideline published after we designed our study recommends the use of 80% of the direct distance between the FA and the CA recording site (CA–FA × 0.8) [Citation29]. Consequently, all PWV values were converted to direct distance in order to facilitate comparison between studies using the equation developed by Vermeersch et al. [Citation30] and employed by The Reference Values for Arterial Stiffness’ Collaboration group [Citation12].
Heart rate variability
Short-term HRV methods, described in detail previously, were used [Citation17,Citation31,Citation32]. HRV was assessed with the SphygmoCor system (SCOR-Hx 8.2) using a five-minute measurement with the patient resting in a supine position and two maneuvers selected to challenge the autonomic nervous system. For the Valsalva maneuver (VM), the patient blew into a mouthpiece with a constant pressure of 40 mmHg for 15 seconds. The stand maneuver (SM) called for active standing from a supine position. The Valsalva/stand ratio is the ratio of the highest heart rate during (or shortly after) the VM/SM to the lowest heart rate occurring after the VM/SM.
Statistical analysis
The main hypothesis behind the study was that RDN would reduce daytime systolic ABPM by 10 mmHg compared to SHAM after 3 months with an SD of 13 mmHg. Based on this assumption power calculation showed a need for 28 patients in each treatment arm (β = 0.8 and α = 0.05) in a double-blinded RCT design as previously reported [Citation7]. Analysis was planned according to the intention-to-treat principle (meaning from the time of randomization), and allowing for dropout we decided to randomize a total of 70 patients. Distributions were tested by histograms and QQ-plots. If data was not normally distributed natural logarithmic transformation was used. The HRV time domain parameter pnn50 (the proportion of N-N intervals having a difference of >50 ms) was transformed by adding 1 to all values (pnn50 + 1) prior to log-transformation because many pnn50-values were equal to zero. Data are presented as mean ± SD or median with range (min–max) if data were not normally distributed. Categorical variables are presented as numbers (%) and compared using chi-square test. Between-group differences and differences from baseline to the follow-up assessment were tested two-sided with the use of unpaired and paired t tests, respectively. Fischer’s exact test and chi-square test were used for testing binary and multilevel categorical variables, respectively. Correlations (baseline parameters vs. BP-response and differences (6-months-baseline) vs. BP-response) were tested with simple linear regression using the square of the Pearson correlation coefficient (r2) as a measure of the goodness of fit of the model. Multivariate linear regression analysis was used to adjust for the impact of comorbidity (age, body mass index (BMI), diabetes) on changes in BP and arterial stiffness. Mean changes are presented as means with 95% confidence intervals unless otherwise stated. p < .05 was considered statistically significant. All data were analyzed with Stata/IC 12.1 (StataCorp LP, College Station, TX 77845 USA).
Results
Baseline characteristics
Fifty-three patients (77% of the original ReSET cohort) were included in this substudy with 27 in the SHAM group and 26 in the RDN group ( and ). Sixteen patients (6 in the SHAM group and 10 in the RDN group) from the original ReSET cohort lacked SphygmoCor measurements and had to be excluded from analysis. Overall, the groups (mean ± SD) were similar at baseline and consisted of predominantly males (SHAM/RDN: 78/65%) with normal renal function (eGFR >60 ml/min/1.73 m2 SHAM/RDN: 85/96%). In both groups, roughly 1/3 of the patients had diabetes and the majority had been diagnosed with hypertension for >10 years with a tendency towards greater percentage in the SHAM group (SHAM/RDN: 78/54%; p = .07). BP at baseline was similar both in terms of office systolic BP: 165 ± 18 mmHg (SHAM) vs. 161 ± 19 mmHg (RDN), brachial systolic BP: 158 ± 18 mmHg (SHAM) vs. 154 ± 17 mmHg (RDN), 24h-ABPM systolic BP: 153 ± 14 mmHg (SHAM) vs. 151 ± 13 mmHg (RDN), and systolic C-BP: 146 ± 20 mmHg (SHAM) vs. 143 ± 17 mmHg (RDN).
Figure 1. CONSORT flow chart ReSET trial.
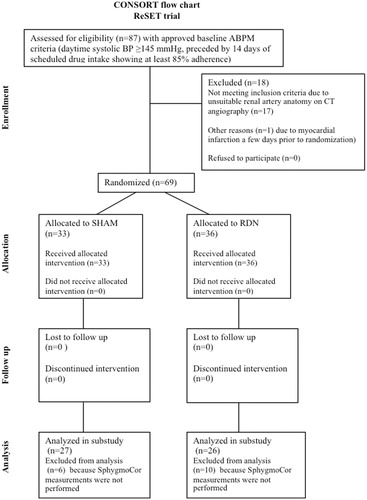
Table 1. Baseline demographics.
In both groups, patients were treated with on average four antihypertensive drugs corresponding to 7 ± 2 (SHAM) and 7 ± 3 (RDN) defined daily doses. The SHAM group was slightly older 59 ± 9 years (SHAM) vs. 54 ± 8 (RDN) years; p = .04 and fewer patients in the SHAM group were treated with a beta-blocker 70% (SHAM) vs. 92% (RDN); p = .04 but more received a calcium channel blocker 93% (SHAM) vs. 58% (RDN); p = .003. Otherwise there were no marked differences regarding the use of other antihypertensive drugs and diuretics including aldosterone inhibitors. Patients with sleep apnea and active smokers were evenly distributed in the two groups.
Blood pressure
Brachial systolic and diastolic BP decreased significantly in the RDN group after six months (mean change with 95% confidence interval): −8 (−15; −1) mmHg (brachial systolic BP); −5 (−9; −1) mmHg (brachial diastolic BP), but changes (Δ) were not significantly different when compared with the SHAM group (p ≥ .16 in all between group comparisons of ΔSHAM vs. ΔRDN) as shown in . Changes in 24h-AMBP were also not significantly different after six months in the two groups despite a significant within group mean decrease after six months in diastolic 24h-AMBP in the SHAM group (−3 (−6; 0) mmHg). Changes in antihypertensive medication were not significantly different in the two groups as previously reported [Citation7].
Table 2. Blood pressure and pulse wave data mean differences (Δ = 6 months-baseline).
Central blood pressure and pulse wave results
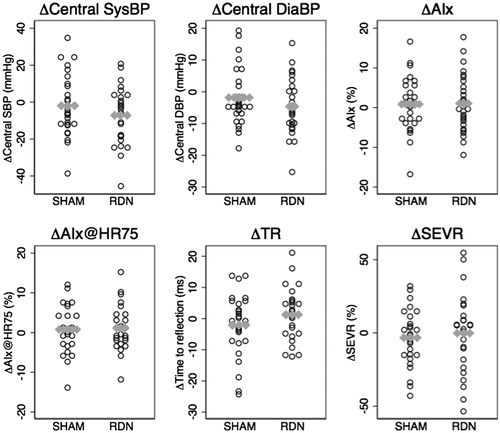
In the RDN group, significant within-group changes in C-BP and PWV were observed after six months ( & ) but changes were not significantly different when compared with the SHAM group (p ≥ .13 in all between group comparisons of ΔSHAM vs. ΔRDN). Mean changes (6 months-baseline) (Δ) with 95% confidence intervals were: ΔSystolic C-BP (−2 (−8; 5) (SHAM) vs. −8 (−15; −1) (RDN) mmHg), ΔDiastolic C-BP (−2 (−6; 2) (SHAM) vs. −5(−9; −1) (RDN) mmHg), ΔPWV (0.1(−0.7; 0.9) (SHAM) vs. −0.6 (−1.1; −0.1) (RDN) m/s). Changes in other pulse wave indices such as AIx, heart rate adjusted AIx (AIx@HR75), time to reflection (TR) and the subendocardial viability ratio (SEVR) which describes the ratio of the diastolic area under the curve (AUC) of the arterial pulse wave to the systolic AUC were also not significantly different in the two groups after six months.
Figure 2. Pulse wave data mean differences (Δ = 6 months-baseline) as dot-plots with group means (gray horizontal dots).
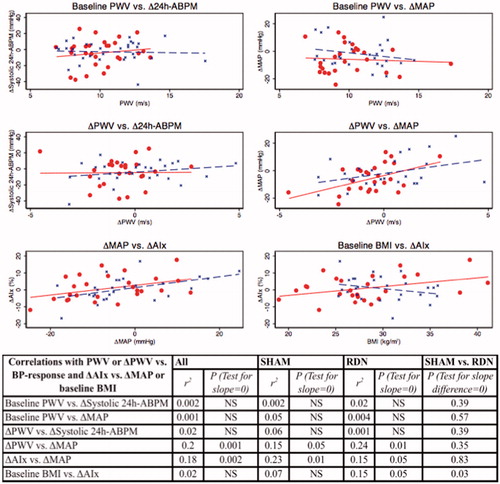
The BP response after RDN or SHAM (change in systolic 24h-ABPM or brachial mean arterial BP after six months) was not significantly correlated with PWV at baseline as shown in . Change in PWV after six months was significantly correlated with change in brachial mean arterial BP response after six months (ΔMAP) regardless of intervention (r2 = 0.15; p = .05 (SHAM); r2 = 0.24; p = .01 (RDN); r2 = 0.20; p = .001 (All patients)). This correlation was similar in the two groups (test for no slope difference (SHAM vs. RDN) yielded p = .35). Change in AIx after six months was significantly correlated with ΔMAP regardless of intervention (r2 = 0.23; p = .01 (SHAM); r2 = 0.15; p = .049 (RDN); r2 = 0.18; p = .002 (All patients)) and this correlation was similar in the two groups (test for no slope difference (SHAM vs. RDN) yielded p = .83) as shown in .
Figure 3. Correlations between baseline PWV or change (Δ = 6 months-baseline) in PWV and BP-response (systolic 24h-ABPM or brachial MAP) and correlations between change in wave reflection (ΔAIx) and ΔMAP or baseline BMI (SHAM = blue; RDN = red).
Effect of comorbidity on change in BP, arterial stiffness and wave reflection
In order to investigate the effect of comorbidity we performed univariate and multivariate analysis (not shown) with either Δ24h-ABPM or ΔMAP or ΔPWV or ΔAIx as outcome and age, diabetes, obesity (BMI) and group allocation (SHAM or RDN) as independent variables. Age and BMI were also tested as dichotomous parameters (young: age <56.6 years vs. old: age ≥56.6 years; lean: BMI <28.5 kg/m2 vs. fat: BMI >28.5 kg/m2) but this did not change the results. Overall, age, diabetes and BMI did not affect change in BP, PWV and AIx, and there were no significant differences between SHAM and RDN except for the correlation between baseline BMI and ΔAIx where test for no slope difference (SHAM vs. RDN) yielded p = .03 in both univariate and multivariate analysis (additional adjustment for age and diabetes). The correlation was quite weak as shown in and the univariate analysis test for slope=0 was only borderline significant in the RDN group (r2 = 0.07; p = .18 (SHAM); r2 = 0.15; p = .05 (RDN); r2 = 0.02; p = .37 (All patients)) indicating a chance finding of little significance.
HRV results
shows HRV parameters in the two groups at baseline and after six months. At baseline, the groups were similar except for the frequency domain parameter high frequency (HF) power which tended to be higher in the SHAM group (given as median with range (min-max) since data was not normally distributed): HF power 148(13–15538) (SHAM) vs. 76 (4–3785) (RDN) ms2; p = .04). This difference was mainly caused by two outliers in the SHAM group and disappeared when these were omitted from the baseline comparison. Beta- or alfa-blocker treatment did not affect HRV parameters at baseline except for the Valsalva ratio. Thus, on a group level, disregarding SHAM/RDN allocation, non-beta-blocker treatment was associated with higher Valsalva ratio whereas non-alfa-blocker treatment was associated with lower Valsalva ratio (Median ratios: 1.15(1.02; 1.30); p = .03 (non-betablocker/beta-blocker), 0.86(0.76; 0.97); p = .02 (non-alfablocker/alfa-blocker). Changes in time- and frequency domain HRV parameters, Valsalva ratio and stand ratio after six months were minor and not significantly different in the RDN and SHAM group ( and ).
Figure 4. Log-transformed HRV-parameters mean differences (Δ = 6 months-baseline) as dot-plots with group means (gray horizontal dots).
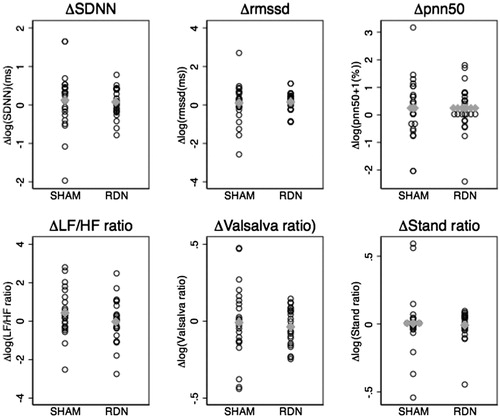
Table 3. HRV data.
In the SHAM group, several baseline HRV-parameters correlated positively with change in systolic 24h-ABPM after six months although not LF/HF ratio (See ). Interestingly, in the RDN group there were no significant correlations between baseline HRV and BP response after six months. When comparing these correlations in SHAM and RDN treated only pnn50 and HF power were significantly different with p = .02 log(pnn50 + 1) and p = .03 log(HF power) in test for no slope difference (SHAM vs. RDN).
Figure 5. Correlations between baseline log-transformed HRV-parameters and change (Δ = 6 months-baseline) in systolic 24h-ABPM (SHAM = blue; RDN = red).
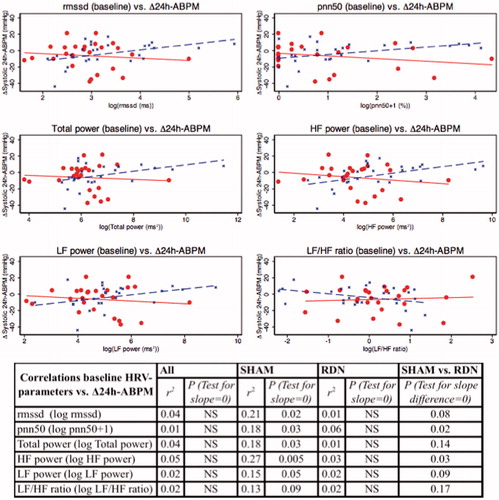
Figure 6. Correlations between change (Δ = 6 months-baseline) in selected log-transformed HRV-parameters and BP-response (Δ24h-ABPM/brachial MAP) (SHAM = blue; RDN = red).
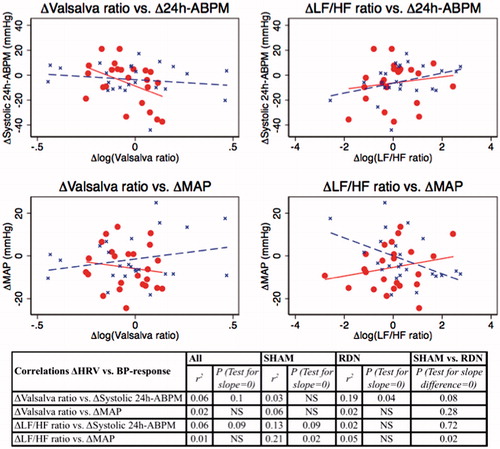
Changes in HRV-parameters after six months were not significantly correlated with systolic 24h-ABPM response after six months except for a negative correlation in the RDN group between Δ(6 months-baseline) systolic 24h-ABPM and Δ(6 months-baseline) log(Valsalva ratio) (r2=0.19; p = .04) but this correlation was not significantly different from the SHAM group with p = .08 in test for no slope difference (SHAM vs. RDN) as shown in .
There were no significant correlations between brachial BP response after six months (ΔMAP) and changes in HRV parameters after six months except for a negative correlation in the SHAM group between ΔMAP and Δ(6 months-baseline) log(LF/HF ratio) (r2=0.21; p = .02). This correlation was significantly different from the RDN group with p = .02 in test for no slope difference ().
Discussion
Similar to the findings based on the entire ReSET-cohort, the current substudy did not find any significant effect of RDN on peripheral brachial BP and 24-h ABPM in a sham-controlled setting. The novel contributions of this study, however, were that C-BP, aortic stiffness and pulse wave indices such as AIx were not significantly affected by RDN after six months in comparison with SHAM, despite significant within-group changes in C-BP and PWV in the RDN group. Aortic stiffness (PWV) did not predict BP response after RDN, but changes in PWV after six months were closely related to changes in BP regardless of intervention. The impact of RDN on HRV was not significantly different in our sham-controlled study. Moreover, there was no obvious correlation between baseline HRV and BP response, suggesting that RDN has little impact on HRV and thereby SNA, or that HRV is imperfect as a marker of changes in SNA.
So far, one of the major problems regarding RDN is the uncertainty about whether full renal sympathetic denervation is achieved and whether the effect is sustained up to and beyond six months [Citation33]. In our pilot study we found a reduction of 19 mmHg in systolic BP which is comparable to other trials, indicating that the quality of RDN in our study was not inferior to others [Citation25] but the effect seems transient. Thus, as previously reported, at 1 month, when medical changes were few, we observed a borderline significant difference in daytime systolic ABPM of 6.0 mmHg in favor of RDN (p = .08) and a significant difference in daytime diastolic ABPM daytime DBP of 4.4 mmHg (p = .02) whereas long-term effects at 6 months were insignificant when compared with SHAM [Citation7]. Unfortunately, we did not measure C-BP, AIx and PWV at 1 and 3 months. Consequently, we cannot rule out a potential initial short-term effect of RDN on central hemodynamics and arterial stiffness.
In the present study, significant within-group changes in brachial BP, C-BP and PWV were observed after six months in the RDN group, but changes were not significantly different when compared with the SHAM group. Previous studies without a sham-control group either found significant improvements of peripheral BP, C-BP, and PWV after RDN [Citation18,Citation20,Citation22] or no effect [Citation19]. Overall, it seems that studies with significant reductions in peripheral brachial BP after RDN [Citation18,Citation20,Citation22] also found significant changes in C-BP and pulse wave indices such as AIx and AIx@HR75, whereas studies such as ours without major differences in peripheral brachial BP and longer follow-up did not [Citation19]. Several methods have been developed to estimate central BP from brachial pressure waves, but common to all is the need for calibration with brachial BP [Citation34]. Accordingly, there is a strong interdependence between C-BP and the peripheral brachial BP and so far the predictive value of C-BP beyond brachial BP seems marginal [Citation35]. AIx, however, is not calibrated with a peripherally obtained brachial BP and is therefore by some advocated as a better measure of central hemodynamics. Thus, in terms of potential BP-independent effects following RDN it is interesting that Hering et al. reported a substantial reduction in AIx and AIx@HR75 in forty RDN-treated resistant hypertensive patients after 3 months and also reported that these changes were unrelated to reductions in BP [Citation23]. BP was in fact in this study reduced significantly in RDN-treated and the study also found a SNA-lowering effect of RDN in terms of lower muscle sympathetic nerve activity (MSNA). However, although the study did include a control group consisting of ten non-RDN treated, it was not a randomized sham-controlled study and the follow-up period was only 3 months. Changes in BP-medication were not reported. Thus, whether the changes in AIx, BP and MSNA were induced by RDN rather than medication and/or better adherence is questionable. Similar limitations apply to the larger study by Brandt et al. who also found lower brachial BP, C-BP, AIx and PWV when comparing 110 RDN-treated with 10 controls [Citation20]. The study used a longer follow-up period of 6 months and also reported that the reduction in PWV at follow-up was greater than predicted according to age- and mean arterial BP-corrected PWV, suggesting that RDN might exert BP-independent effects on arterial stiffness and systolic pulse wave reflections [Citation20]. Similarly, PWV-data from the study by Mortensen et al. indicated that long-term effects at six months follow-up were BP-independent whereas short-term effects were BP-dependent [Citation18]. In our study, change in PWV and AIx after six months were found to be BP-dependent regardless of intervention. Age, diabetes and BMI did not seem to predict responders in terms of BP, PWV and AIx. The impact of age and comorbidities such as obesity and diabetes was not the main objective of our study and given the rather small sample size of our study these results should be interpreted with some caution.
In summary, by ignoring the SHAM group our results seem in good agreement with previous studies as demonstrated by the significant within-group decrease in brachial BP, C-BP and PWV in the RDN group, which further underlines the importance of a SHAM control group when assessing the effects of RDN. In hindsight, a tendency towards publication bias favoring positive results attributed RDN is also worth contemplating.
Usually, reduced HRV is associated with greater SNA and has also been associated with hypertension [Citation36]. In our study, changes in HRV-parameters after six months were minor and not significantly different in the RDN and SHAM group. Thus, using HRV as a marker of SNA there was no indication of SNA reduction. Moreover, there was no obvious correlation between baseline HRV-parameters and BP-response in the RDN-treated. Accordingly, in our study baseline SNA did not predict responders and non-responders, provided that HRV accurately reflects SNA activity. In the SHAM group, several baseline HRV-parameters, although not LF/HF ratio, correlated positively with change in systolic 24h-ABPM after six months. There is no obvious explanation for this other than greater use of beta-blocker treatment in the RDN group which may have affected heart rate and thereby HRV. Alternatively, it may represent a chance finding. The correlation between changes in BP and SNA has previously been examined by Ma¨ki-Peta¨ja¨ et al. and in this study changes in short-term HRV-parameters were closely related to changes in mean arterial BP suggesting that HRV is a reliable measure of the autonomic nervous system activity of the cardiovascular system [Citation37]. Nonetheless, HRV is usually considered to be an indirect measure of SNA as e.g. LF power represents both SNA and PNA, whereas HF power represents mainly PNA, as previously mentioned. MSNA is therefore often considered to be the gold standard measurement of SNA and interpreting HRV-parameters including LF/HF ratio as a direct representative of SNA is probably an oversimplification [Citation38]. A pronounced reduction in MSNA and norepinephrine spillover has been reported after RDN in a casuistic report [Citation39] and in the study by Hering et al. in which MSNA dropped significantly 3 months after RDN as mentioned above [Citation23]. Apart from that, two other studies found no significant impact on HRV and MSNA following RDN [Citation24,Citation40] even though a significant reduction in both office BP and 24-h ABPM was observed [Citation24]. Our findings, in line with these two previous studies suggest that reduced SNA may be the exception rather than the rule after RDN in patients with resistant hypertension, and currently, there is limited evidence to suggest that HRV accurately predicts the BP-lowering effect of RDN.
Strength and limitations
The main strength of the study is the SHAM design with the documented effectiveness of the randomization procedure. Thus, it was documented that the patients were unaware of the group assignment as previously reported [Citation7]. Also, the patients were truly hypertensive and systolic 24-h ABPM was used both as an entry criterion and as follow-up BP. The limit for inclusion was 145 mmHg not 135 as in in most previous studies, and our patients thus had pronounced resistant hypertension. A single experienced invasive cardiologist, who had been proctored and had performed ten RDN procedures prior to the ReSET inclusion, performed all RDN procedures in the present study. In addition, all our patients had a CT-scan of the renal arteries prior to inclusion, and thus had well-defined anatomy. Our patients had on average more ablations during the RDN procedure than in the SYMPLICITY HTN-3 trial, a device company did not sponsor our study and no patients were lost to follow-up. Changes in medication were limited and the use of drugs was largely unchanged from before RDN to the 6-month follow-up point as previously reported [Citation7].
There are also a number of relevant limitations. First, no direct determination of SNA, e.g. norepinephrine spillover or MSNA, was performed, apart from HRV, and, as in previous studies, no direct evidence exists to verify that renal denervation was accomplished as intended. Nevertheless, a significant reduction in plasma levels of aldosterone was found after 1 month in the RDN group as previously described [Citation7], which confirms that some degree of denervation was achieved in line with the borderline significant difference in daytime systolic ABPM observed after 1 months as previously mentioned. Nevertheless, use of a multipolar catheter could theoretically induce a more complete denervation and thereby potentially a greater BP-lowering effect.
Second, the majority of patients in our study had established hypertension for more than ten years, many were obese with an elevated BMI of 28–30 kg/m2 and roughly 30% in both groups had diabetes, which is probably the main reason for the high PWV of around 10 m/s observed at baseline in both groups. SNA-lowering via RDN may have little impact in this high-risk population and we cannot exclude a potential greater effect in newly diagnosed hypertensive patients with lower PWW, less obesity and absence of diabetes.
Third, although scheduled drug intake and drug compliance registration were performed, we did not measure plasma and/or urine levels of antihypertensive medications and we cannot exclude that reduced drug adherence might have affected our results. However, if this should have a major influence on the result, the adherence should be different in the two randomized groups, which is highly unlikely. Fourth, central BP indices were derived from radial artery tonometry measurements rather than invasive intra-aortic BP measurements. The values for central aortic BP and pulse pressures depend on the validity and applicability of the generalized transfer function used to generate the central aortic waveforms and the peripheral BP used for calibration. Reassuringly, the correspondence between estimated and directly measured central aortic systolic BP has been found to be quite good in subjects without severe renal impairment and pronounced vascular calcification with a difference of (mean ± SD) −3.6 ± 5.0 mmHg between estimated central systolic BP and the invasively measured systolic BP [Citation10,Citation41]. Finally, the small sample size of our study might have affected outcome, and a larger study with more participants might have yielded a different result. However, so far all other sham-controlled studies have also been negative in line with this study [Citation5,Citation6].
Conclusion
In accordance with previous studies, we could confirm that peripheral brachial BP, central BP and PWV were reduced in the group randomized for RDN. However, when compared with the SHAM group, there were no significant differences in brachial BP, central aortic BP, pulse wave reflection, arterial stiffness (PWV), and HRV. Baseline HRV or PWV did not predict BP-response after RDN. Thus, the idea of BP-independent effects of RDN on large arteries and cardiac autonomic activity is not supported. Our data strongly underline the importance of including a SHAM group when studying the effect of RDN and other interventions in patients with resistant hypertension. In our view, RDN as a therapy for resistant hypertension does not seem superior to usual care.
Disclosure statement
No potential conflict of interest was reported by the authors.
Additional information
Funding
References
- Grassi G, Cattaneo BM, Seravalle G, et al. Baroreflex control of sympathetic nerve activity in essential and secondary hypertension. Hypertension. 1998;31:68–72.
- Schroeder EB, Liao D, Chambless LE, et al. Hypertension, blood pressure, and heart rate variability: the Atherosclerosis Risk in Communities (ARIC) study. Hypertension. 2003;42:1106–1111.
- Krum H, Schlaich M, Whitbourn R, et al. Catheter-based renal sympathetic denervation for resistant hypertension: a multicentre safety and proof-of-principle cohort study. Lancet. 2009;373:1275–1281.
- Esler MD, Krum H, Sobotka PA, et al. SYMPLICITY HTN-3 Investigators. Renal sympathetic denervation in patients with treatment-resistant hypertension (The Symplicity HTN-2 Trial): a randomised controlled trial. Lancet. 2010;376:1903–1909.
- Bhatt DL, Kandzari DE, O'Neill WW, et al. SYMPLICITY HTN-3 investigators. A controlled trial of renal denervation for resistant hypertension. N Engl J Med. 2014;370:1393–1401.
- Desch S, Okon T, Heinemann D, et al. Randomized sham-controlled trial of renal sympathetic denervation in mild resistant hypertension. Hypertension. 2015;65:1202–1208.
- Mathiassen ON, Vase H, Bech JN, et al. Renal denervation in treatment-resistant essential hypertension. A randomized, SHAM-controlled, double-blinded 24-h blood pressure-based trial. J Hypertens. 2016;34:1639–1647.
- Nichols W, O'Rourke M, Vlachopoulos C. McDonald's blood flow in arteries: theoretical, experimental and clinical principles. 6th ed. London (UK): Hodder Arnold; 2011.
- Svendsen MB, Khatir DS, Peters CD, et al. Differential effects of age on large artery stiffness and minimal vascular resistance in normotensive and mildly hypertensive individuals. Clin Physiol Funct Imaging. 2015;35:359–367.
- Carlsen RK, Peters CD, Khatir DS, et al. Estimated aortic blood pressure based on radial artery tonometry underestimates directly measured aortic blood pressure in patients with advancing chronic kidney disease staging and increasing arterial stiffness. Kidney Int. 2016;90:869–877.
- Laugesen E, Høyem P, Stausbøl-Grøn B, et al. Carotid-femoral pulse wave velocity is associated with cerebral white matter lesions in type 2 diabetes. Diabetes Care. 2013;36:722–728.
- Reference Values for Arterial Stiffness' Collaboration. Determinants of pulse wave velocity in healthy people and in the presence of cardiovascular risk factors: “establishing normal and reference values”. Eur Heart J. 2010;31:2338–2350.
- Laurent S, Boutouyrie P, Asmar R, et al. Aortic stiffness is an independent predictor of all-cause and cardiovascular mortality in hypertensive patients. Hypertension. 2001;37:1236–1241.
- Vlachopoulos C, Aznaouridis K, Stefanadis C. Prediction of cardiovascular events and all-cause mortality with arterial stiffness: a systematic review and meta-analysis. J Am Coll Cardiol. 2010;55:1318–1327.
- Swierblewska E, Hering D, Kara T, et al. An independent relationship between muscle sympathetic nerve activity and pulse wave velocity in normal humans. J Hypertens. 2010;28:979–984.
- Pannier B, Slama MA, London GM, et al. Carotid arterial hemodynamics in response to LBNP in normal subjects: methodological aspects. J Appl Physiol (1985). 1995;79:1546–1555.
- Heart rate variability. Standards of measurement, physiological interpretation, and clinical use. Task Force of the European Society of Cardiology and the North American Society of Pacing and Electrophysiology. Eur Heart J. 1996;17:354–381.
- Mortensen K, Franzen K, Himmel F, et al. Catheter-based renal sympathetic denervation improves central hemodynamics and arterial stiffness: a pilot study. J Clin Hypertens (Greenwich). 2012;14:861–870.
- Verloop WL, Vink EE, Spiering W, et al. Effects of renal denervation on end organ damage in hypertensive patients. Eur J Prev Cardiol. 2015;22:558–567.
- Brandt MC, Reda S, Mahfoud F, et al. Effects of renal sympathetic denervation on arterial stiffness and central hemodynamics in patients with resistant hypertension. J Am Coll Cardiol. 2012;60:1956–1965.
- Ott C, Schmid A, Toennes SW, et al. Central pulse pressure predicts BP reduction after renal denervation in patients with treatment-resistant hypertension. EuroIntervention. 2015;11:110–116.
- Ott C, Janka R, Schmid A, et al. Vascular and renal hemodynamic changes after renal denervation. Clin J Am Soc Nephrol. 2013;8:1195–1201.
- Hering D, Lambert EA, Marusic P, et al. Renal nerve ablation reduces augmentation index in patients with resistant hypertension. J Hypertens. 2013;31:1893–1900.
- Verloop WL, Spiering W, Vink EE, et al. Denervation of the renal arteries in metabolic syndrome: the DREAMS-study. Hypertension. 2015;65:751–757.
- Vase H, Mathiassen ON, Kaltoft A, et al. Catheter-based renal denervation for treatment of resistant hypertension. Dan Med J. 2012;59:A4439.
- Mancia G, Fagard R, Narkiewicz K, et al. 2013 ESH/ESC Guidelines for the management of arterial hypertension: the Task Force for the management of arterial hypertension of the European Society of Hypertension (ESH) and of the European Society of Cardiology (ESC). J Hypertens. 2013;31:1281–1357.
- Belghazi J, El Feghali RN, Moussalem T, et al. Validation of four automatic devices for self-measurement of blood pressure according to the International Protocol of the European Society of Hypertension. Vasc Health Risk Manag. 2007;3:389–400.
- Papaioannou TG, Protogerou AD, Nasothimiou EG, et al. Assessment of differences between repeated pulse wave velocity measurements in terms of “bias” in the extrapolated cardiovascular risk and the classification of aortic stiffness: is a single PWV measurement enough? J Hum Hypertens. 2011;26:594–602.
- Van Bortel LM, Laurent S, Boutouyrie P, et al. Artery Society; European Society of Hypertension Working Group on Vascular Structure and Function; European Network for Noninvasive Investigation of Large Arteries. Expert consensus document on the measurement of aortic stiffness in daily practice using carotid-femoral pulse wave velocity. J Hypertens. 2012;30:445–448.,
- Vermeersch SJ, Rietzschel ER, De Buyzere ML, et al. Distance measurements for the assessment of carotid to femoral pulse wave velocity. J Hypertens. 2009;27:2377–2385.
- Risk M, Bril V, Broadbridge C, et al. Heart rate variability measurement in diabetic neuropathy: review of methods. Diabetes Technol Ther. 2001;3:63–76.
- Nunan D, Sandercock GR, Brodie DA. A quantitative systematic review of normal values for short-term heart rate variability in healthy adults. Pacing Clin Electrophysiol. 2010;33:1407–1417.
- Tank J, Heusser K, Brinkmann J, et al. Spike rate of multi-unit muscle sympathetic nerve fibers after catheter-based renal nerve ablation. J Am Soc Hypertens. 2015;9:794–801.
- Laurent S, Cockcroft J, Van BL, et al. Expert consensus document on arterial stiffness: methodological issues and clinical applications. Eur Heart J. 2006;27:2588–2605.
- Vlachopoulos C, Aznaouridis K, O'Rourke MF, et al. Prediction of cardiovascular events and all-cause mortality with central haemodynamics: a systematic review and meta-analysis. Eur Heart J. 2010;31:1865–1871.
- Carthy ER. Autonomic dysfunction in essential hypertension: a systematic review. Ann Med Surg (Lond). 2014;3:2–7.
- Mäki-Petäjä KM, Barrett SM, Evans SV, et al. The role of the autonomic nervous system in the regulation of aortic stiffness. Hypertension. 2016;68:1290–1297.
- Saul JP, Rea RF, Eckberg DL, et al. Heart rate and muscle sympathetic nerve variability during reflex changes of autonomic activity. Am J Physiol. 1990;258:H713–H721.
- Schlaich MP, Sobotka PA, Krum H, et al. Renal sympathetic-nerve ablation for uncontrolled hypertension. N Engl J Med. 2009;361:932–934.
- Brinkmann J, Heusser K, Schmidt BM, et al. Catheter-based renal nerve ablation and centrally generated sympathetic activity in difficult-to-control hypertensive patients: prospective case series. Hypertension. 2012;60:1485–1490.
- Pauca AL, O'Rourke MF, Kon ND. Prospective evaluation of a method for estimating ascending aortic pressure from the radial artery pressure waveform. Hypertension. 2001;38:932–937.