
Abstract
Background: The International Obesity Task Force recently developed an extended body mass index (BMI) cut-offs for screening thinness, overweight and obesity among children and adolescents. The present study examined the profiles of blood pressure (BP) among children and adolescents with different BMI categories in Shandong, China.
Methods: Data for this study were obtained from a large cross-sectional survey of schoolchildren. A total of 44,630 students (22,404 boys and 22,226 girls) aged 7–18 years participated in this study. The grades of body weight (thinness grade 1–3, normal weight, overweight and obesity grade 1–3) was defined by the international BMI cut-offs. Systolic blood pressure (SBP) and diastolic blood pressure (DBP) were measured on one occasion. High BP was defined as SBP and/or DBP ≥95th percentile for age and gender.
Results: The overall prevalence of thinness (grade 1–3), overweight and obesity (grade 1–3) were 7.80, 18.74 and 8.56% for boys and 11.16, 13.53 and 3.70% for girls, respectively, boys had a lower prevalence of thinness and higher prevalence of overweight and obesity than girls (p < .01). Urban boys and girls had a lower prevalence of thinness and higher prevalence of overweight and obesity than their rural counterparts (p < .01). Children and adolescents with high BMI had a higher BP levels than their counterparts with normal and low BMI.
Conclusion: High BMI is strongly related to elevated BP. Our findings emphasize the importance of the prevention of overweight/obesity to prevent future-related problems such as hypertension in children and adolescents.
Introduction
Body mass index (BMI) is perhaps the most commonly used measure for defining overweight, obesity and thinness in clinical practice and population surveys [Citation1–3]. Recently, an extended international BMI cut-offs for screening thinness, overweight and obesity among children and adolescents has been established [Citation4] Shandong Province, located in the lower reaches of the Yellow River, facing Japan and the Korean Peninsular to the east, is an important littoral province in East China. It has a total area of 156,700 km2 (about 60,500 miles2) and a total population of 97.47 million in 2014 (http://www.stats-sd.gov.cn/tjnj/nj2015/new/indexch_new.htm). In this article, based on provincial data in 2014, we report the categories of BMI and its association with blood pressure (BP) among children and adolescents in Shandong, China.
Subjects and methods
The study was approved by the Ethical Committee of the Shandong Center for Disease Control and Prevention, Shandong, China.
Study population
Data for this study were obtained from a large cross-sectional survey of schoolchildren. A total of 44,630 students (22,404 boys and 22,226 girls) from 17 districts in Shandong Province, students of Han nationality, aged 7–18 years, participated in the National Surveys on Chinese Students’ Constitution and Health, which were carried out in September to October 2014. All subjects voluntarily joined this study with informed consents. The sampling method was stratified multistage sampling based on selected primary and secondary schools. Three urban public schools (one each for primary school, junior high school and senior high school) and three rural public schools (one each for primary school, junior high school and senior high school) from each of the 17 districts in Shandong were randomly selected and invited to participate in the study. From the selected schools, two classes in each grade were selected, and all students of the selected classes were invited to join the study. All subjects were primary and secondary students, ranging from 7 to 18 years of age, and all were of Han ancestry that accounts for ∼99.32% of the total population in Shandong. All subjects were stratified by gender, age and the area of residence (urban or rural).
Measurements and definitions
All measurements were performed by a team of trained health professionals in each of the 17 districts. Each professional is required to pass a training course for anthropometric measurement organized by the investigation team in Shandong. All measurements were taken using the same type of apparatus and followed the same procedures. Stature without shoes was measured using metal column height-measuring stands to the nearest 0.1 cm. Weight was measured using lever scales to the nearest 0.1 kg while the subjects wore their light clothes. Body mass index (BMI) was calculated from their stature and weight (kg/m2). The BMI cut-offs recommended by the International Obesity Task Force were used to define thinness, overweight and obesity [Citation4,Citation5]. The categories of body weight status and corresponding BMI cut-offs at 18 years are as follows: thinness grade 3 (BMI < 16); thinness grade 2 (BMI 16 to <17); thinness grade 1 (BMI 17 to <18.5); normal weight (BMI 18.5 to <25); overweight (BMI 25 to <30); obesity grade 1 (BMI 30 to <35); Obesity grade 2 (BMI 35 to <40); Obesity grade 3 (BMI ≥ 40). Systolic blood pressure (SBP) and diastolic blood pressure (DBP) were measured using a mercury sphygmomanometer after each subject had rested for at least 15 min in a sitting position. BP was measured twice on the right arm with an appropriately sized cuff and the average value was recorded on the study form. DBP was defined via Korotkoff Sound 5. Relatively high BP status was defined as SBP and/or DBP ≥95th percentile for age and gender by the national reference standards [Citation6].
Statistical analyses
The proportions of BMI categories and relatively high BP were determined, and comparisons between different groups were made by χ2 test. Considering the BP levels of children change with age, Z-scores of SBP and DBP were calculated based on the distribution of the total sample, and comparisons of Z-scores for SBP and DBP among different groups were made by one-way ANOVA. All analyses were performed with the statistical package SPSS 11.5. Significance was defined at the 0.05 level.
Results
The proportion of BMI categories in boys and girls aged 7–18 is shown in . Overall, the prevalence of thinness (grade 1–3), overweight and obesity (grade 1–3) were 7.80, 18.74 and 8.56% for boys and 11.16, 13.53 and 3.70% for girls, respectively, boys had a lower prevalence of thinness and higher prevalence of overweight and obesity than girls (p < .01). For children (aged 7–12 years), the prevalence of thinness (grade 1–3), overweight and obesity (grade 1–3) were 6.45, 21.39 and 11.44% for boys and 10.04, 16.92 and 5.64% for girls, and for adolescents (aged 13–18 years), the corresponding figures were 9.17, 16.04 and 5.63% for boys and 12.34, 10.05 and 1.72% for girls, children had a lower prevalence of thinness and higher prevalence of overweight and obesity than adolescents (p < .01, ). Obvious urban-rural difference in the prevalence of thinness, overweight and obesity were also observed. The total prevalence of thinness (grade 1–3), overweight and obesity (grade 1–3) were 7.35, 20.92 and 9.57% for urban boys, 8.23, 16.62 and 7.58% for rural boys, 10.55, 14.61 and 4.18% for urban girls, 11.75, 12.50 and 3.24% for rural girls, respectively, urban boys and girls had a lower prevalence of thinness and higher prevalence of overweight and obesity than their rural counterparts (p < .01).
Figure 1. The proportion of BMI categories in boys and girls (Th1, thinness grade 1. Th2, thinness grade 2. Th3, thinness grade 3. Ob1, obesity grade 1. Ob2, obesity grade 2. Ob3, obesity grade 3. Nor, normal weight. Ov, overweight) *Gender difference p < .01.
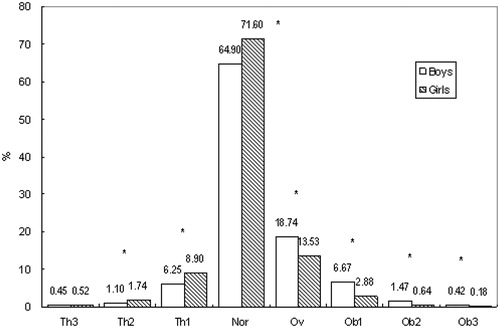
Table 1. The proportion of BMI categories in boys and girls aged 7–18 years.
Comparisons of Z-score of SBP and DBP and the prevalence of relatively high BP among children and adolescents with different BMI categories is shown in . For both boys and girls, statistically significant differences were observed between any two groups (p < .01). Children and adolescents in the high BMI group had a higher BP levels and prevalence of relatively high BP than their counterparts in normal and low BMI groups. Boys aged 7–18 in the high BMI group had a higher SBP and DBP than normal BMI group by 5–6 mmHg and 2–4 mmHg, and than low BMI group by 8–12 mmHg and 4–6 mmHg; girls aged 7–18 in the high BMI group had a higher SBP and DBP than normal BMI group by 4–6 mmHg and 2–4 mmHg, and than low BMI group by 8–11 mmHg and 4–6 mmHg ().
Figure 2. Mean values of SBP and DBP for boys and girls with different BMI.
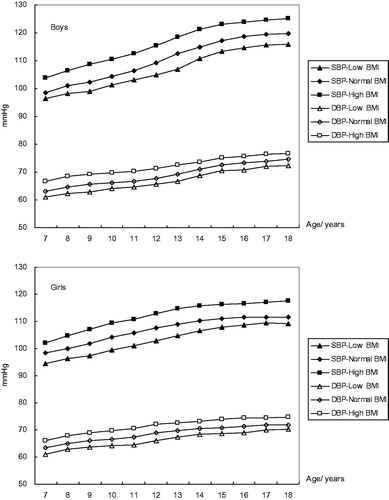
Table 2. Comparisons of Z-score of SBP and DBP and the prevalence of relatively high BP (RHBP) in different groups.
Discussion
This study examined the distribution of BMI and its association with BP among children and adolescents. Obvious urban-rural and gender difference in the nutritional status were observed. Children and adolescents with high BMI had a higher BP levels than their counterparts with normal and low BMI.
Socioeconomic status (SES) may play an important role in the development of obesity [Citation7]. In general, an inverse relationship between childhood obesity and SES was observed in developed countries [Citation8–10], and a positive relationship was observed in developing countries [Citation11,Citation12]. In China, urban residents had higher SES and better living conditions than the countryside, the urban lifestyle including physical inactivity and high-fat, energy-rich diets may be an important factor for the prevalence of obesity. National surveys had demonstrated that urban children had a higher consumption of energy-dense, animal-based foods and a lower consumption of fruit and vegetables than rural children [Citation13]. SES discrepancies might partially explain the urban-rural difference in the prevalence of childhood obesity.
Gender difference in weight status was observed in the present study. Boys had a lower prevalence of thinness and higher prevalence of overweight/obesity than girls, it may be related to the society's traditional preference for sons particularly in rural areas, and boys are likely to enjoy more of the family's resources [Citation14]; boys prefer to have a larger body size than girls [Citation15,Citation16]. We also found that children (aged 7–12 years) showed a lower prevalence of thinness and higher prevalence of overweight/obesity than adolescents (aged 13–18 years). The reason is still unclear, it may be related to the difference in lifestyle and dietary pattern between the two age stages; compared with children, adolescents generally pay more attention to their body shape and engage in more physical activity [Citation17].
Several studies have examined the association between childhood overweight/obesity and high BP. Freedman et al. [Citation18] reported that overweight children in the Bogalusa Heart Study were 4.5 and 2.4 times as likely to have elevated SBP and DBP, respectively; Sorof and Daniels [Citation19] reported a 3 times greater prevalence of hypertension in obese compared with non-obese adolescents in a school-based hypertension and obesity screening study. In the present study, we found that children and adolescents with high BMI (including overweight and obesity grade 1–3) had higher BP levels and prevalence of relatively high BP than their counterparts with normal and low BMI (thinness grade 1–3). Our results, together with above observation, suggest that overweight/obesity is strongly related to elevated BP.
The major strength of this study is that, based on the data from a large population, using internationally agreed standards, it examines the distribution of BMI among children and adolescents in Shandong Province, one of the most populous provinces in China. However, two limitations are noted. First, the BP reading was recorded as the average of two measurements, which were taken after 15-min rest, but on one occasion only (the definition of high BP should be based on BP measured on at least three separate occasions [Citation20]). Thus, the possibility that errors may have occurred in classifying adolescents as having high BP or normal BP cannot be ruled out. However, the purpose of using BP categories in the analysis was to obtain a general idea of the extent of elevated BP in the studied adolescents rather than to diagnose the presence of hypertension among them. Second, the absence of detailed information concerning living environments, dietary patterns and physical activity at the individual level also limited our study.
In summary, the distribution of BMI among children and adolescents by international cut-offs were examined. Our findings emphasize the importance of the prevention of overweight/obesity to prevent future-related problems such as hypertension in children and adolescents.
Acknowledgements
This study was supported by the medical and health program of Shandong, China (2014WS0376). Surveys on students’ constitution and health are conducted under the auspices of the department of education in Shandong Province, China. We thank all the team members and all participants. Special thanks to Mr. B Yu for providing access to the survey data.
Disclosure statement
No potential conflict of interest was reported by the authors.
References
- Barton M. Screening for obesity in children and adolescents: US Preventive Services Task Force recommendation statement. Pediatrics. 2010;125:361–367.
- Cole TJ, Bellizzi MC, Flegal KM, et al. Establishing a standard definition for child overweight and obesity worldwide: international survey. BMJ. 2000;320:1240–1243.
- Cole TJ, Flegal KM, Nicholls D, et al. Body mass index cut offs to define thinness in children and adolescents: international survey. BMJ. 2007;335:194–197.
- Cole TJ, Lobstein T. Extended international (IOTF) body mass index cut-offs for thinness, overweight and obesity. Pediatr Obes. 2012;7:284–294.
- Bervoets L, Massa G. Defining morbid obesity in children based on BMI 40 at age 18 using the extended international (IOTF) cut-offs. Pediatr Obes. 2014;9:e94–e98.
- Mi J, Wang TY, Meng LH, et al. Development of blood pressure reference standards for Chinese children and adolescents. Chin J Evid Based Pediatr. 2010;15:4–14. [in Chinese].
- Wang Y, Lim H. The global childhood obesity epidemic and the association between socio-economic status and childhood obesity. Int Rev Psychiatry. 2012;24:176–188.
- Shrewsbury V, Wardle J. Socioeconomic status and adiposity in childhood: a systematic review of cross-sectional studies 1990-2005. Obesity (Silver Spring). 2008;16:275–284.
- Singh GK, Siahpush M, Kogan MD. Rising social inequalities in US childhood obesity, 2003–2007. Ann Epidemiol. 2010;20:40–52.
- Barriuso L, Miqueleiz E, Albaladejo R, et al. Socioeconomic position and childhood-adolescent weight status in rich countries: a systematic review, 1990–2013. BMC Pediatr. 2015;15:129–143.
- Silva DAS. Socioeconomic inequalities in abdominal obesity in Brazilian female adolescents: a national-based study. Eur J Pediatr. 2013;172:1665–1670.
- Ji CY, Cheng TO. Prevalence and geographic distribution of childhood obesity in China in 2005. Int J Cardiol. 2008;131:1–8.
- Zhang X, van der Lans I, Dagevos H. Impacts of fast food and the food retail environment on overweight and obesity in China: a multilevel latent class cluster approach. Public Health Nutr. 2012;15:88–96.
- Cui Z, Huxley R, Wu Y, et al. Temporal trends in overweight and obesity of children and adolescents from nine Provinces in China from 1991-2006. Int J Pediatr Obes. 2010;5:365–374.
- Li Y, Hu X, Ma W, et al. Body image perceptions among Chinese children and adolescents. Body Image. 2005;2:91–103.
- Chen LJ, Fox KR, Haase AM. Body shape dissatisfaction and obesity among Taiwanese adolescents. Asia Pac J Clin Nutr. 2008;17:457–460.
- Zhang J, Seo DC, Kolbe L, et al. Trends in overweight among school children and adolescents in seven Chinese provinces, from 1991–2004. Int J Pediatr Obes. 2010;5:375–382.
- Freedman DS, Dietz WH, Srinivasan SR, et al. The relation of overweight to cardiovascular risk factors among children and adolescents: the Bogalusa Heart Study. Pediatrics. 1999;103:1175–1182.
- Sorof J, Daniels S. Obesity hypertension in children: a problem of epidemic proportions. Hypertension. 2002;40:441–447.
- Lurbe E, Agabiti-Rosei E, Cruickshank JK, et al. 2016 European Society of Hypertension guidelines for the management of high blood pressure in children and adolescents. J Hypertens. 2016;34:1887–1920.