
Abstract
Purpose: Blood pressure variability is associated with traditional cardiovascular risk factors, but little is known about the association with atrial fibrillation. We compared blood pressure variability in patients with and without atrial fibrillation using data from the Valsartan Antihypertensive Long-term Use Evaluation (VALUE) trial.
Materials and methods: The VALUE trial was a randomised-controlled trial of valsartan versus amlodipine in patients with hypertension and high cardiovascular risk, followed for 4.2 years (mean). For the present analysis we included patients with electrocardiogram at baseline and during follow-up, and ≥3 visits from 6 months onwards. We compared standard deviation (SD) of all blood pressures within each visit averaged across all visits (within-visit variability) and of mean blood pressure at each visit (visit-to-visit variability) in patients with and without atrial fibrillation at baseline. We similarly compared patients who developed non-persistent or persistent atrial fibrillation during follow-up with those who did not, using t-tests, ANOVA and linear regression.
Results: Of 15,245 patients in the VALUE trial, 13,827 were eligible for analysis. SD of visit-to-visit systolic blood pressure was not significantly different between patients with and without atrial fibrillation at baseline (mean difference 0.3 mm Hg, p = 0.4), but significantly higher in patients with incident non-persistent or persistent atrial fibrillation during follow-up than in those who never developed atrial fibrillation (differences 1.2 and 1.8 mm Hg, respectively, p-values <0.0001). Associations with non-persistent and persistent atrial fibrillation were confirmed in linear regression models (p-values <0.0001). SD of within-visit systolic blood pressure was not significantly different between patients with and without atrial fibrillation at baseline (p = 0.4) but significantly higher in patients with persistent atrial fibrillation during follow-up (p = 0.04).
Conclusion: In patients treated for hypertension, atrial fibrillation was not associated with increased blood pressure variability, but blood pressure variability was higher in those who developed atrial fibrillation during follow-up.
Introduction
A number of studies have indicated that increased blood pressure variability contributes to the risk of cardiovascular events and death [Citation1–9], most of which have included patients with atrial fibrillation [Citation2,Citation4–6]. However, patients with atrial fibrillation have an increased variation in heart cycle length and may therefore also have higher blood pressure variability [Citation10]. At the same time the accuracy of oscillometric blood pressure measurement in these patients is questionable, particularly in patients with high heart rate [Citation11–13]. To evaluate if patients with atrial fibrillation have higher blood pressure variability and if these patients should be included in analyses of the prognostic importance of blood pressure variability, we compared blood pressure variability in patients with and without atrial fibrillation at entry into the Valsartan Antihypertensive Long-term Use Evaluation (VALUE) trial. Among those who did not have fibrillation at baseline, we also compared blood pressure variability in patients who developed atrial fibrillation to those who did not develop atrial fibrillation during follow-up.
Material and methods
The VALUE trial was a multinational randomised-controlled, double-masked trial of valsartan versus amlodipine in 15,245 patients with hypertension and at least one additional risk or disease factor for cardiovascular events. Patients were randomly assigned to amlodipine 5 or 10 mg or valsartan 80 mg or 160 mg from visit 1 onwards. In addition, patients could receive hydrochlorothiazide (or loop diuretics in case of impaired renal function) or other blood pressure lowering drugs (except angiotensin receptor blockers and calcium antagonists), if needed to reach the target blood pressure of less than 140/90 mm Hg. The methods of the VALUE trial have been reported previously [Citation14]. Visits took place monthly during the first 6 months, and every 6 months thereafter, up till a maximum of 72 months (17 visits). Blood pressure was measured three times during each visit, with the patient in the sitting position, after 5 minutes of rest. Blood pressure was measured using a calibrated standard sphygmomanometer or a validated digital device, and mean blood pressure was calculated as the mean of all three readings. The presence of atrial fibrillation was determined by a standard 12-lead electrocardiogram (ECG) at baseline. In those without atrial fibrillation at baseline, ECG was repeated annually. Atrial fibrillation that developed during follow-up was classified as non-persistent if it was recorded at least once during follow-up, and as persistent if atrial fibrillation was present at all visits during follow-up [Citation15]. All ECGs were evaluated centrally by an ECG adjudication committee.
For the present analysis, we selected patients with ECG recordings at baseline and during follow-up, and with ≥3 visits from 6 months onwards (visits 6–15). We excluded blood pressure measurements during the first 6 months, when blood pressure variability was influenced by the initial dose titration [Citation2,Citation8]. We excluded measurements from visit 16 onwards (66 to 72 months) as only 187 patients (1.5%) had measurements in this period.
As the primary measure of visit-to-visit blood pressure variability we used the standard deviation (SD) of the mean systolic and diastolic blood pressure from all visits and we also used the coefficient of variation (CV), defined as SD/mean *100%. Within-visit blood pressure variability was defined as the SD of the three blood pressures at each visit, averaged across all visits.
Statistical analysis
We compared baseline variables using analysis of variance (ANOVA) or t-tests for continuous variables, and chi-squared tests for categorical variables. We used t-test to compare differences in blood pressure variability between patients with and without atrial fibrillation at baseline, and ANOVA to compare difference in blood pressure variability between patients who developed non-persistent or persistent atrial fibrillation during follow-up to those who did not develop atrial fibrillation. If the ANOVA indicated an overall statistically significant difference, we conducted Dunnett’s post hoc test to identify which of the pairwise comparisons that was significant. To test for normality of distribution we used Shapiro-Wilk test and to test for homogeneity of variances we used Levene`s test. We also conducted multiple linear regression analysis to evaluate if atrial fibrillation category was associated with blood pressure variability. Separate regression models were performed for patients with or without atrial fibrillation at baseline and patients with or without atrial fibrillation during follow-up. We adjusted for mean systolic blood pressure during follow-up, and baseline prognostic variables that were significantly different between the groups that were compared. A p-value of <0.05 was considered an indicator of statistical significance. Finally, we performed sensitivity analyses to see if the results were similar using the coefficient of variation (CV), and using all blood pressure measurements from baseline to 60 months. All analyses were performed with the SPSS software (SPSS Statistics, Chicago, IL, USA), version 25.0 (2017).
Results
Of the 15,245 patients included in the VALUE trial, 13,827 were included in the present analysis, of which 341 patients had atrial fibrillation and 13,486 had no atrial fibrillation at baseline. summarises the baseline characteristics of patients with and without atrial fibrillation at baseline, and of patients who developed and did not develop non-persistent or persistent atrial fibrillation during follow-up. The number of visits was around 8.7 in all categories of patients. Patients with atrial fibrillation at baseline were older and had more cardiovascular risk factors than patients without atrial fibrillation, but mean systolic blood pressure during follow-up was similar in the two groups. Similarly, patients with atrial fibrillation during follow-up were older and had more cardiovascular risk factors than patients who did not develop atrial fibrillation during follow-up, and mean systolic blood pressure during follow-up was similar.
Table 1. Baseline characteristics of patients with or without atrial fibrillation at baseline, and of patients who developed or did not develop atrial fibrillation during follow-up.
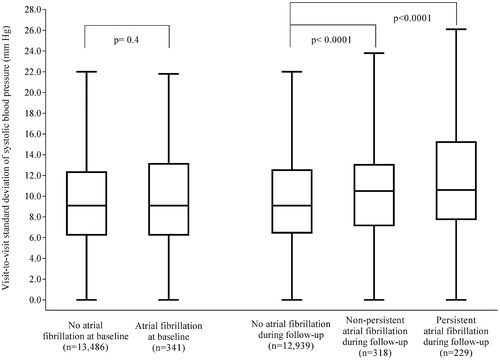
shows the SD of visit-to-visit systolic blood pressure in patients with and without atrial fibrillation at baseline, and in those who developed and those who did not develop atrial fibrillation during follow-up. There was no significant difference between patients with and without atrial fibrillation at baseline (difference 0.3 mm Hg, p = 0.4). However, those who developed atrial fibrillation during follow-up had significantly higher SD than patients without atrial fibrillation during follow-up (non-persistent atrial fibrillation: difference 1.2 mm Hg, 95% CI 0.5–1.8, p < 0.0001; persistent atrial fibrillation: difference 1.8 mm Hg, 95% CI 1.1–2.6, p < 0.0001).
Figure 1. Standard deviation of visit-to-visit systolic blood pressure in patients with or without atrial fibrillation at baseline, and in patients who developed or did not develop atrial fibrillation during follow-up. Data are boxplots of median (solid horizontal line), interquartile range (box outline), minimum, and maximum (whiskers). Extreme values are not shown. No atrial fibrillation at baseline: mean SD 10.0 mm Hg (SD 5.1); Atrial fibrillation at baseline: mean SD 10.3 mm Hg (SD 5.6); No atrial fibrillation during follow-up: mean SD 9.9 mm Hg (SD 5.1); Non-persistent atrial fibrillation during follow-up: mean SD 11.1 mm Hg (SD 5.3); Persistent atrial fibrillation during follow-up: mean SD 11.7 mm Hg (SD 5.5).
The SD of visit-to-visit diastolic blood pressure is shown in Supplementary data Table S1. The difference in SD of diastolic visit-to-visit blood between patients with or without atrial fibrillation at baseline was not significant (difference 0.3 mm Hg, p = 0.052). Again, SD was significantly higher in patients with than without atrial fibrillation during follow-up (non-persistent atrial fibrillation: difference 0.4 mm Hg, 95% CI 0.1–0.7, p = 0.008; persistent atrial fibrillation: difference 0.7 mm Hg, 95 CI% 0.3–1.1, p <0.0001).
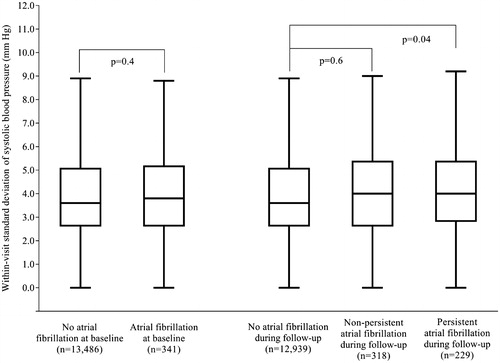
There was no significant difference in SD of within-visit systolic blood pressure between patients with or without atrial fibrillation at baseline (difference 0.1 mm Hg, p = 0.4, ). However, patients with persistent atrial fibrillation during follow-up had higher SD of within-visit systolic blood pressure than patients without (difference 0.3 mm Hg, 95% CI 0.01–0.65, p = 0.04). The difference was not significant for patients with non-persistent atrial fibrillation during follow-up (difference 0.1 mm Hg, 95% CI −0.2–0.4, p = 0.6).
Figure 2. Standard deviation of within-visit systolic blood pressure in patients with or without atrial fibrillation at baseline, and in patients who developed or did not develop atrial fibrillation during follow-up. Data are boxplots of median (solid horizontal line), interquartile range (box outline), minimum, and maximum (whiskers). Extreme values are not shown. No atrial fibrillation at baseline: mean SD 4.0 mm Hg (SD 2.1); Atrial fibrillation at baseline: mean SD 4.1 mm Hg (SD 2.3); No atrial fibrillation during follow-up: mean SD 4.0 mm Hg (SD 2.1); Non-persistent atrial fibrillation during follow-up: mean SD 4.1 mm Hg (SD 2.1); Persistent atrial fibrillation during follow-up: mean SD 4.3 mm Hg (SD 2.1).
The SD of within-visit diastolic blood pressure was higher in patients with atrial fibrillation at baseline than in those without (difference 0.4 mm Hg, 95% CI 0.2–0.5, p < 0.0001, Supplementary data Table S2). The SD was also higher in patients who developed atrial fibrillation during follow-up compared to patients who did not (non-persistent atrial fibrillation: difference 0.2 mm Hg, 95% CI 0.1–0.4, p = 0.003; persistent atrial fibrillation: difference 0.4 mm Hg, 95% CI 0.2–0.6, p < 0.0001).
Table 2. Difference in standard deviation of visit-to-visit systolic blood pressure between patients with and without atrial fibrillation at baseline and between patients who developed and did not develop atrial fibrillation during follow-up.
We also performed multiple linear regression analyses to assess if differences in baseline variables could explain the associations between the atrial fibrillation categories and visit-to-visit systolic blood pressure variability ( ). Atrial fibrillation at baseline was not significantly associated with blood pressure variability compared to no atrial fibrillation at baseline (increase in SD 0.05 mm Hg, p =0.8), while non-persistent and persistent atrial fibrillation during follow-up were significantly associated with blood pressure variability compared to no atrial fibrillation during follow-up (increase in SD 1.02, p < 0.0001, and increase 1.62, p < 0.0001, respectively).
Sensitivity analysis using instead CV as a metric of variability gave similar results (Supplementary data Tables S3 and S4). Using measurements from baseline to 60 months also showed similar differences (Supplementary data Tables S5–S8), with the exception of a significant increase in SD of visit-to-visit diastolic blood pressure in patients with atrial fibrillation at baseline compared to those without (Supplementary data Table S6).
Discussion
In this analysis of the VALUE trial, we found no clear evidence that hypertensive patients with atrial fibrillation have higher systolic blood pressure variability than patients without atrial fibrillation. These data suggest that patients with atrial fibrillation can be included in analyses of the prognostic importance of blood pressure variability in hypertensive patients. This is an important finding, as hypertension and atrial fibrillation often co-exist [Citation16], and most studies of the prognostic importance of blood pressure variability have included patients with atrial fibrillation [Citation2,Citation4–6], without confirmation that this is acceptable from a methodological point of view.
We also found that patients who developed atrial fibrillation during follow-up had higher visit-to-visit blood pressure variability than those without atrial fibrillation during-follow-up, despite similar mean blood pressure during follow-up in the two groups. One explanation can be that atrial fibrillation leads to increased heart rate variability, which can cause labile blood pressure. Another possibility is that patients who develop atrial fibrillation have an increased burden of traditional cardiovascular risk factors, which are known to be associated with increased blood pressure variability [Citation4,Citation5,Citation7,Citation8].
Patients who developed atrial fibrillation during follow-up also had higher within-visit diastolic variability. The difference was small, and should be interpreted with caution, but beat-to-beat diastolic blood pressure variability has previously been reported to be higher in patients with atrial fibrillation than in those with sinus rhythm [Citation10]. Alternatively, the higher diastolic within-visit variability in patients with atrial fibrillation can be related to the lower accuracy of oscillometric blood pressure measurements in patients with atrial fibrillation than in patients with sinus rhythm [Citation11,Citation13,Citation17], and the lower accuracy of diastolic than systolic blood pressure measurements [Citation18,Citation19].
The strengths of this study include the relatively large number of patients with atrial fibrillation, followed with regular visits for a long period of time, with standardised procedures for blood pressure measurements at all visits, and close to complete information about baseline risk factors. The main limitations are the analysis of observational data with risk of confounding, the risk of spurious findings from repeated statistical tests, and the limited number of patients with atrial fibrillation compared to the number of patients without atrial fibrillation. Another limitation is that blood pressure could be measured using either calibrated standard sphygmomanometer or a validated digital device, and blood pressure variability may have been influenced by measurement method [Citation20].
In conclusion, we found that, in patients treated for hypertension, systolic blood pressure variability was not higher in patients with atrial fibrillation than in patients without atrial fibrillation, which suggests that patient with atrial fibrillation can be included in analyses of the prognostic importance of blood pressure variability. However, in patients who developed atrial fibrillation during follow-up, blood pressure variability was higher than in those who never developed atrial fibrillation, although differences were relatively small.
Supplemental Material
Download ()Disclosure statement
The VALUE trial database resides with the authors` institution and analyses have been performed by the authors. MR was national coordinator for the trial. TAH is an employee and receives salary and restricted stocks from Novartis Pharmaceuticals Corporation. The other authors have nothing to disclose in relation to this work.
Additional information
Funding
Related Research Data
References
- Stevens SL, Wood S, Koshiaris C, et al. Blood pressure variability and cardiovascular disease: systematic review and meta-analysis. BMJ. 2016;354:i4098.
- Rothwell PM, Howard SC, Dolan E, et al. Prognostic significance of visit-to-visit variability, maximum systolic blood pressure, and episodic hypertension. Lancet. 2010;375:895–905.
- Mancia G, Schumacher H, Bohm M, et al. Relative and combined prognostic importance of on-treatment mean and visit-to-visit blood pressure variability in ONTARGET and TRANSCEND patients. Hypertension. 2017;70:938–948.
- Vishram JK, Dahlof B, Devereux RB, et al. Blood pressure variability predicts cardiovascular events independently of traditional cardiovascular risk factors and target organ damage: a LIFE substudy. J Hypertens. 2015;33:2422–2430.
- Chowdhury EK, Owen A, Krum H, et al. Systolic blood pressure variability is an important predictor of cardiovascular outcomes in elderly hypertensive patients. J Hypertens. 2014;32:525–533.
- Muntner P, Whittle J, Lynch AI, et al. Visit-to-visit variability of blood pressure and coronary heart disease, stroke, heart failure, and mortality: a cohort study. Ann Intern Med. 2015;163:329–338.
- Muntner P, Shimbo D, Tonelli M, et al. The relationship between visit-to-visit variability in systolic blood pressure and all-cause mortality in the general population: findings from NHANES III, 1988 to 1994. Hypertension. 2011;57:160–166.
- Mehlum MH, Liestol K, Kjeldsen SE, et al. Blood pressure variability and risk of cardiovascular events and death in patients with hypertension and different baseline risks. Eur Heart J. 2018;39:2243–2251.
- Hata J, Arima H, Rothwell PM, et al. Effects of visit-to-visit variability in systolic blood pressure on macrovascular and microvascular complications in patients with type 2 diabetes mellitus: the ADVANCE trial. Circulation. 2013;128:1325–1334.
- Olbers J, Gille A, Ljungman P, et al. High beat-to-beat blood pressure variability in atrial fibrillation compared to sinus rhythm. Blood Press. 2018;27:249–255.
- Lakhal K, Martin M, Ehrmann S, et al. Non-invasive blood pressure monitoring with an oscillometric brachial cuff: impact of arrhythmia. J Clin Monit Comput. 2018;32:707–715.
- Feenstra RK, Allaart CP, Berkelmans GFN, et al. Accuracy of oscillometric blood pressure measurement in atrial fibrillation. Blood Press Monit. 2018;23:59–63.
- Narkiewicz K, Kjeldsen SE, Burnier M, et al. Challenges in oscillometric blood pressure measurement in atrial fibrillation: looking for practical solutions. Blood Press. 2018;27:1–2.
- Julius S, Kjeldsen SE, Weber M, et al. Outcomes in hypertensive patients at high cardiovascular risk treated with regimens based on valsartan or amlodipine: the VALUE randomised trial. The Lancet. 2004;363:2022–2031.
- Schmieder RE, Kjeldsen SE, Julius S, et al. Reduced incidence of new-onset atrial fibrillation with angiotensin II receptor blockade: the VALUE trial. J Hypertens. 2008;26:403–411.
- Dzeshka MS, Shahid F, Shantsila A, et al. Hypertension and atrial fibrillation: an intimate association of epidemiology, pathophysiology, and outcomes. Am J Hypertens. 2017;30:733–755.
- Halfon M, Wuerzner G, Marques-Vidal P, et al. Use of oscillometric devices in atrial fibrillation: a comparison of three devices and invasive blood pressure measurement. Blood Press. 2018;27:48–55.
- Stergiou GS, Kollias A, Destounis A, et al. Automated blood pressure measurement in atrial fibrillation: a systematic review and meta-analysis. J Hypertens. 2012;30:2074–2082.
- Miszkowska-Nagorna E, Neubauer-Geryk J, Wolf J, et al. The accuracy of SpaceLabs 90207 in blood pressure monitoring in patients with atrial fibrillation. Blood Press. 2018;27:3–9.
- Stergiou GS, Parati G, Vlachopoulos C, et al. Methodology and technology for peripheral and central blood pressure and blood pressure variability measurement: current status and future directions - Position statement of the European Society of Hypertension Working Group on blood pressure monitoring and cardiovascular variability. J Hypertens. 2016;34:1665–1677.