
Abstract
Background and aims: Atherogenic index of plasma (AIP), defined as the logarithm of triglycerides to high-density lipoprotein cholesterol (HDL-C) ratio, is a strong predictor of future cardiovascular disease. Our aim was to examine the association of AIP with haemodynamic variables in normotensive and never-treated hypertensive subjects in a cross-sectional study.
Methods: Supine haemodynamics in 615 subjects without antihypertensive and lipid-lowering medications were examined using whole-body impedance cardiography and radial pulse wave analysis. Linear regression analysis was applied to investigate the association of AIP with haemodynamic variables and age, sex, body mass index (BMI), smoking status, alcohol consumption, plasma C-reactive protein, electrolytes, uric acid, low density lipoprotein cholesterol (LDL-C), estimated glomerular filtration rate, and quantitative insulin sensitivity check index.
Results: The demographics and laboratory values of the study population were (mean ± 95% confidence interval): age 44.9 ± 1.0 years, BMI 26.8 ± 0.4 kg/m2, office blood pressure 140.6 ± 1.6/89.4 ± 1.0 mmHg, total cholesterol 5.2 ± 0.08, LDL-C 3.1 ± 0.08, triglycerides 1.2 ± 0.08, HDL-C 1.6 ± 0.04 mmol/l, and AIP −0.15 ± 0.02. Age (standardized coefficient Beta 0.508, p < .001) and aortic systolic blood pressure (Beta 0.239, p < .001) presented with the strongest associations with pulse wave velocity. However, AIP was also associated with pulse wave velocity (Beta 0.145, p < .001). AIP was not related with aortic or radial blood pressure, cardiac output, systemic vascular resistance, or augmentation index.
Conclusions: AIP is directly and independently associated with arterial stiffness, a variable strongly related to cardiovascular risk. This supports more widespread use of AIP in standard clinical cardiovascular disease risk evaluation.
Introduction
Cardiovascular diseases due to atherosclerosis and its complications, such as myocardial infarction and stroke, are the leading cause of mortality worldwide representing 31% of all deaths [Citation1]. Among 82.6 million U.S. adults, the prevalence of cardiovascular diseases due to high blood pressure (BP), coronary heart disease, and stroke is estimated to exceed 33%, with the majority of the cases found in subjects older than 60 years of age [Citation2].
Dyslipidaemia is a major risk factor for cardiovascular disease, and the primary focus has been on the dominant role of low density lipoprotein cholesterol (LDL-C) in atherosclerosis. The benefits of LDL-C lowering in cardiovascular disease are well recognized [Citation3,Citation4]. In clinical practice, the influence of LDL-C has overridden the significance of high density lipoprotein cholesterol (HDL-C) and triglycerides [Citation3,Citation4]. Previous studies have reported that not only low, but also extremely high, levels of HDL-C increase the risk of cardiovascular disease and mortality [Citation5–7]. Elevated serum triglycerides level is also a risk factor for cardiovascular disease [Citation8,Citation9]. A meta-analysis of 17 population-based prospective studies with 46,413 men and 10,864 women reported that plasma triglyceride level, independent of HDL-C, was a risk factor for cardiovascular disease [Citation10].
Increased pulse wave velocity (PWV) that designates arterial stiffness is a strong predictor of cardiovascular disease and mortality, independent of the level of BP [Citation11]. The role of unfavourable lipid profile in atherosclerosis is well recognized, but the associations of plasma lipids with arterial stiffness are not straightforward. In spite of the dominant role of LDL-C in atherosclerosis, the relationship of LDL-C with PWV is rather weak [Citation12]. Recently, we found that LDL-C was not associated with PWV when the level of BP was taken into account [Citation13], and this finding is concordant with the majority of published papers [Citation12]. High triglycerides concentration in 11,640 and 1,447 subjects, and low HDL-C levels in 15,302 subjects, were associated with increased PWV [Citation14–16]. However, Wang et al. found that HDL-C was inversely associated with PWV in 2,375 Chinese subjects, while total cholesterol or triglycerides were not associated with PWV [Citation17].
The atherogenic index of plasma (AIP) is defined as the logarithm of plasma triglycerides to HDL-C ratio [Citation18–22]. In contrast to plasma triglycerides concentration, AIP shows normal distribution [Citation23], and is therefore well suited for the mathematical modelling of cardiovascular variables. AIP is particularly useful in predicting plasma atherogenicity [Citation18,Citation20–22]. AIP is also a strong marker for the future risk of atherosclerosis and cardiovascular disease [Citation18–21,Citation24–27], and the routine calculation of AIP in clinical cardiovascular disease risk evaluation would seem warranted.
To our knowledge, the association of AIP with haemodynamic variables has not been previously examined. Due to the weak association of LDL-C with arterial stiffness in our previous report [Citation13], our objective in this cross-sectional study was to examine the associations of AIP with functional haemodynamic variables, and especially to test the hypothesis whether AIP is related to arterial stiffness.
Methods
Participants
All subjects were from an ongoing study with the primary aim to examine haemodynamics in primary and secondary hypertension versus normotensive controls (DYNAMIC study; ClinicalTrails.gov identifier NCT01742702). The participant recruitment was recently published in the form of a study flow-chart [Citation13], and altogether 615 from 1349 subjects were included. The exclusion criteria for the study were volunteers taking (1) statin or other lipid-lowering or BP-lowering medication, or with a history of (2) coronary artery disease, (3) stroke, (4) heart failure, (5) valvular heart disease, (6) diabetes, (7) chronic kidney disease, (8) secondary hypertension, (9) alcohol or substance abuse, (10) psychiatric illness other than mild depression or anxiety, or (11) abnormal heart rhythm other than sinus.
Physical examination and office BP measurements were performed by a medical doctor, and routine laboratory analyses for elevated BP according to the guidelines of the European Society of Hypertension were performed to all enrolled subjects [Citation28]. Beside the medical history, lifestyle habits and use of dietary supplements, medicines, and other substances not registered as drugs were also documented along with information about smoking and alcohol consumption as standard drinks (∼12 grams of absolute alcohol) per week.
The study included 314 men and 301 women, altogether 615 normotensive and never-treated subjects with primary hypertension, aged 19–72 years. Based on the office BP measurements on a single occasion, 249 (40.5%) of the participants were normotensive and 366 (59.5%) were hypertensive. The subjects were divided into age- and sex-adjusted AIP tertiles (Tertile 1, n = 202; Tertile 2, n = 208; Tertile 3, n = 205). The study complies with the declaration of Helsinki, and was approved by the ethics committee of the Tampere University Hospital (study code R06086M) and the Finnish Medicines Agency (Eudra-CT registration number 2006-002065-39). Signed informed consent was obtained from all participants.
Altogether 230 (37.4%) of the 615 persons used some medications. Full description about medicine consumption has been described in our previous study [Citation13].
Laboratory analyses
Blood and urine sampling was performed after ∼12 hours of fasting. Plasma total, HDL-C, LDL-C, triglycerides, C-reactive protein (CRP), sodium, potassium, glucose, cystatin-C, and creatinine concentrations were determined using Cobas Integra 700/800 (F. Hoffmann-Laroche Ltd, Basel; Switzerland) or Cobas6000, module c501 (Roche Diagnostics, Basel, Switzerland), insulin using electrochemiluminescence immunoassay (Cobas e411, Roche Diagnostics), and blood cell count by ADVIA 120 or 2120 (Bayer Health Care, Tarrytown, NY, USA). To exclude patients with renal disease, urine dipstick analysis was made by an automated refractometer test (Siemens Clinitec Atlas or Advantus, Siemens Healthcare GmbH, Erlangen, Germany). AIP was defined as Lg10(plasma triglycerides/plasma HDL-C) [Citation18–21]. Quantitative insulin sensitivity check index (QUICKI) was calculated for evaluation of insulin sensitivity [Citation29], and glomerular filtration rate (eGFR) was estimated using the CKD-EPI cystatin C formula [Citation30].
Pulse wave analysis
Continuous pulse wave and radial BP were recorded using a tonometric sensor (Colin BP-508T, Colin Medical Instruments Corp., USA) that was attached on the left radial artery pulsation pulse with a wrist band. The radial BP signal was calibrated twice during each 5 minute-period by right brachial BP measurements. Aortic BP was derived with the SphygmoCor system (SpygmoCor PWMx®, AtCor medical, Australia) [Citation31], and augmentation index (AIx, augmented pressure/pulse pressure*100), and AIx adjusted to heart rate 75/min (AIx@75) were determined [Citation32].
Whole-body impedance cardiography
Beat-to-beat heart rate, stroke volume, cardiac output, and PWV were recorded using whole-body impedance cardiography (CircMon®, JR Medical Ltd., Tallinn, Estonia). This method detects changes in body electrical impedance during cardiac cycles, and the electrode configuration has been previously reported [Citation33]. Systemic vascular resistance was calculated from the tonometric BP and cardiac index measured by CircMon® so that normal central venous pressure (4 mmHg) was subtracted from mean arterial pressure and the value was divided by cardiac output. Systemic vascular resistance and cardiac output were related to body surface area and presented as indexes (cardiac index, and systemic vascular resistance index (SVRI), respectively). The stroke volume values measured using CircMon® correlate well with 3 dimensional ultrasound [Citation34]. The supine cardiac output values measured with CircMon® correlate well with the values measured using thermodilution [Citation33].
To measure the PWV, the CircMon® software records the time difference between the onset of the decrease in the impedance of the whole-body signal and the signal from the popliteal artery region, and PWV is then determined from the time difference and the distance between the electrodes [Citation35]. Thus, the values measured using this method reflect cardio-popliteal PWV. The whole-body impedance cardiography tends to overestimate PWV, and a validated equation was utilized to calculate values correspond to the ultrasound method (PWV = PWVimpedance * 0.696 + 0.864) [Citation35]. By the use of this equation, the PWV values recorded using CircMon® show very good correlations with values measured using either the tonometric SphygmoCor® method (r = 0.82, bias 0.02 m/s, 95% confidence interval −0.21 to 0.25) [Citation32] or ultrasound (r = 0.91) [Citation35].
Experimental protocol
Haemodynamics were recorded by research nurses in a quiet, temperature-controlled laboratory. Smoking, caffeine containing products or heavy meals were to be avoided for ≥4 hours, and alcohol consumption for >24 hours prior to the participation in the studies. The subjects rested supine, the left arm with the tonometric sensor abducted to 90 degrees in an arm support. After getting accustomed to the laboratory for about 10 minutes, supine haemodynamics were recorded for five minutes. For the statistical analyses the mean values of each 1-minute period of recording were calculated. The good repeatability and reproducibility of the measurement protocol has been demonstrated [Citation36].
Statistics
Continuous variables were expressed as the mean, standard deviation (SD) or 95% confidence interval (CI) of the mean. Baseline characteristics were depicted as age- and sex-adjusted tertiles of AIP (). The demographic and laboratory data was analysed using analysis of variance (ANOVA), and the Bonferroni correction was applied in the post-hoc analyses. For the illustrations, the haemodynamic differences between the tertiles were examined using one-way ANOVA with the Bonferroni correction in the post-hoc analyses. The homogeneity of variances was tested with the Levene’s test.
Table 1. Age and sex adjusted characteristics of the study population in tertiles of atherogenic index of plasma.
Spearman’s correlations (rS) were calculated, and the variables that correlated with the variable of interest with p < .1 were included in the regression analyses, as appropriate. The skewed distributions of CRP and PWV were corrected by Lg10-transformation for these analyses, while alcohol intake was treated as a series of discrete variables that were assigned a score of either 0 or 1; cut-points for women 0, 1–7, 8–14, and above 15 doses per week; for men 0, 1–14, 15–24, and above 25 doses per week, according to the Finnish Guidelines [Citation37]. Multiple regression analysis with stepwise elimination was applied to evaluate the associations between age, sex, body mass index (BMI), smoking status, alcohol consumption, insulin sensitivity evaluated by QUICKI [Citation29], plasma CRP, sodium, uric acid, LDL-C, AIP, and cystatin C based eGFR [Citation30] (independent variables), and radial systolic and diastolic BP, heart rate, and PWV (dependent variables). In the case of PWV, heart rate was also included as an independent variable. The above variables comprised the model 1. The variables in the model 2 were model 1 + PWV (independent variables) for radial systolic and diastolic BP and heart rate (dependent variables), and model 1 + aortic systolic BP (independent variables) for PWV (dependent variable). The coefficient B, standardized coefficient Beta, and R squared values were presented in the , and p < .05 was considered statistically significant. SPSS version 25.0 (IBM SPSS Statistics, Armonk, NY, USA) was used for the statistics.
Table 2. Explanatory factors for haemodynamic variables in linear regression analyses with stepwise elimination.
Results
Study population and laboratory values
Altogether, 314 (51%) male and 301 (49%) female subjects were included in the analyses (). The age range was 19–72 years. The demographics and laboratory values of the study population were (mean ± SD): age 45 ± 12 years, BMI 27 ± 4 kg/m2, office systolic/diastolic BP 141 ± 21/90 ± 12 mmHg, eGFR 98.8 ± 18.1 ml/min/1.73 m2, total cholesterol 5.2 ± 1.0, LDL-C 3.1 ± 0.6, triglycerides 1.2 ± 0.8, HDL-C 1.6 ± 0.4 mmol/l, and AIP −0.15 ± 0.3 (). In the morning urine sample, none of the study participants had glucosuria or proteinuria. The fasting plasma glucose was in the range of 7.1–10.3 mmol/l in 6 (1%) subjects, while impaired fasting plasma glucose (6.1–7.0 mmol/l) was detected in 80 (13%) of the subjects.
The participants were divided into age- and sex-adjusted AIP tertiles. The average AIP in the tertiles ranged from −0.44 ± 0.17 (Tertile 1) to 0.15 ± 0.23 (Tertile 3) (). The age and sex adjusted AIP tertiles presented with differences in BMI, office systolic and diastolic BP, eGFR, QUICKI, and plasma cystatin C, uric acid, CRP, total cholesterol, triglycerides, HDL-C, LDL-C and glucose concentrations. Age, alcohol intake, smoking status, and plasma creatinine, sodium, potassium, and insulin concentrations were not different between the tertiles ().
Haemodynamic variables in the tertiles of AIP adjusted for age and sex
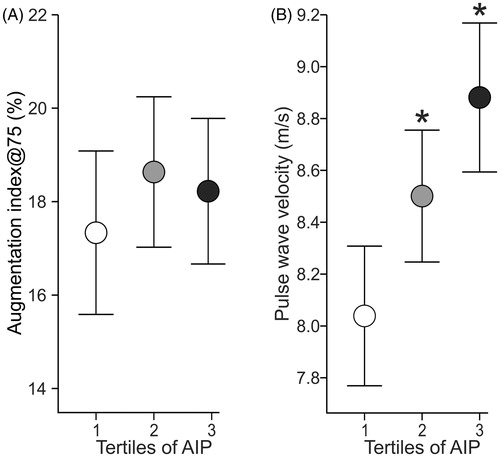
Radial and aortic systolic and diastolic BP and heart rate were higher in the highest than in the lowest AIP tertile, while radial systolic BP and heart rate were also higher in the highest versus the middle AIP tertile (, ). Cardiac index, SVRI and AIx@75 (, ) were not different between the tertiles. PWV was higher in the highest and the middle tertile than in the lowest AIP tertile ().
Figure 1. Averages of radial systolic (A) and diastolic (B) blood pressure, and aortic systolic (C) and diastolic (D) blood pressure in age- and sex-adjusted tertiles of atherogenic index of plasma (AIP) during 5-minute recordings in the supine position. Tertile 1 (n = 202), Tertile 2 (n = 208), and Tertile 3 (n = 205); mean and 95% confidence interval; *p < .05 vs Tertile 1; †p < .05 vs Tertile 2, one-way ANOVA.
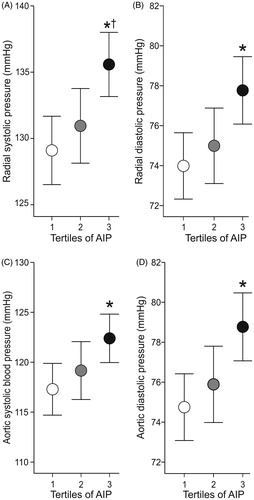
Figure 2. Averages of heart rate (A), cardiac index (B), and systemic vascular resistance index (C) in age- and sex-adjusted atherogenic index of plasma (AIP) during 5-minute recordings in the supine position; mean and 95% confidence interval; *p < .05 vs Tertile 1; †p < .05 vs Tertile 2, one-way ANOVA.
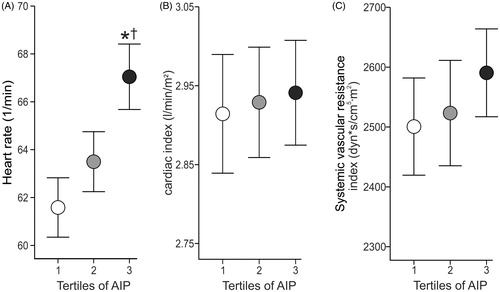
Figure 3. Averages of augmentation index adjusted to heart rate of 75 beats per minute (A), and pulse wave velocity (B) in age- and sex-adjusted atherogenic index of plasma (AIP) during 5-minute recordings in the supine position; mean and 95% confidence interval; *p < .05 vs Tertile 1; †p < .05 vs Tertile 2, one-way ANOVA.
AIP and haemodynamic variables in stepwise linear regression analyses
To examine the relationships of AIP with BP, heart rate and PWV, we performed linear regression analyses with two applied models (see methods) (). The regression analyses were not performed for cardiac index and SVRI, as these variables were not different between the AIP tertiles (). The univariate correlations (rS) between AIP and radial systolic and diastolic BP, heart rate, and PWV were 0.296, 0.252, 0.169, and 0.401 (p < .001 for all), respectively.
In the regressions analyses AIP was not an explanatory factor for radial systolic and diastolic BP in either model, in contrast to PWV, QUICKI, eGFR, age, sex, BMI, present smoker, high alcohol consumption, and plasma sodium and LDL-C concentrations (). AIP was a moderate explanatory factor for heart rate in model 1, in addition to QUICKI, CRP, sex, and moderate alcohol consumption, however when PWV was included in the model, AIP was no longer an explanatory factor for heart rate ().
In both of the applied models, AIP was a significant independent explanatory factor for PWV (). The other significant explanatory factors for PWV were age, aortic systolic BP, heart rate, plasma uric acid and present smoking (, model 2). If aortic systolic BP was replaced by aortic mean BP or aortic diastolic BP in the model 2, AIP still remained as an independent explanatory factor for PWV (data not shown).
Discussion
There is paucity of studies on the associations of AIP with haemodynamic variables. Although some reports have associated triglycerides and HDL-C with arterial stiffness [Citation14–16], all studies do not support this finding [Citation38–40]. Moreover, the association of LDL-C with arterial stiffness has been surprisingly weak in the published literature [Citation12,Citation13]. Therefore, our goal was to assess the association between AIP and functional cardiovascular variables using non-invasive recordings of haemodynamics. The present results showed that AIP was independently associated with arterial stiffness, while it was not related to aortic or radial BP, cardiac output, systemic vascular resistance, or AIx.
The present evaluation of arterial stiffness was performed by the measurement of cardio-popliteal PWV, the pressure wave thus travelling along the thoracic and abdominal aorta, iliac artery, and the femoral artery. The elastic properties of the thoracic and abdominal aorta are higher than those of the more muscular iliac and femoral arteries [Citation41]. According to an expert consensus, PWV is normally 4–5 m/s in the ascending aorta, 5–6 m/s in the abdominal aorta, and 8–9 m/s in the iliac and femoral arteries [Citation41,Citation42]. This explains why cardio-popliteal PWV is higher than carotid-femoral PWV. Moreover, PWV in the aorta increases progressively with age due to the loss of elasticity, while PWV in the femoral artery is only moderately increased in the course of aging [Citation43]. On the other hand, both the aorta and the femoro-popliteal arteries are frequently affected by atherosclerosis, making both of these regions relevant in the study of large arterial pathophysiology [Citation44].
Meta-analyses have demonstrated that statin-induced reduction in LDL-C reduces cardiovascular morbidity and mortality, while several statin trials have also revealed an associated reduction in BP [Citation3,Citation4]. We previously found that LDL-C showed an independent inverse relation with BP and systemic vascular resistance in subjects naive to cardiovascular drugs, but was not associated with arterial stiffness. Thus, LDL-C is not only a major risk factor for atherosclerosis, but it can also be considered as a predisposing factor for elevated BP [Citation13]. However, even when LDL-C is reduced to the recommended levels, some residual cardiovascular risk remains that has been related e.g. to inflammation, and this has encouraged the search for new cardiovascular disease predictors [Citation45,Citation46].
High LDL-C level, smoking, and hypertension have been identified as causes for atherosclerosis that is an intimal disease, while ageing, diabetes, and chronic kidney disease have been associated with arteriosclerosis, which is a medial disease and especially related to arterial stiffening [Citation47]. Though LDL-C has been the major focus on the link between lipids and cardiovascular disease, the combination of reduced HDL-C and elevated triglycerides has been identified as atherogenic dyslipidaemia [Citation48]. This combination has been associated with more unfavourable cardiovascular risk profile, higher heart rate and systolic BP than hypertriglyceridemia or low HDL-C levels alone [Citation48]. Furthermore, reduced HDL-C together with elevated triglycerides, and also elevated AIP, have been associated with decreased insulin sensitivity [Citation19,Citation48,Citation49]. This view corresponds to the present findings whereby insulin sensitivity, as evaluated by means of QUICKI, was different in every AIP tertile with the lowest values in the highest AIP tertile. In the present regression analyses, insulin sensitivity was also inversely related with BP and heart rate ().
The ratio of triglycerides to HDL-C is related to the processes involved in LDL size pathophysiology [Citation50]. An increased proportion of small, dense LDL particles is characteristic of patients with diabetes and the metabolic syndrome, and both of these groups have increased risk for cardiovascular disease [Citation51,Citation52]. The mean LDL particle size was also found to be smaller in patients with stroke than in control subjects, despite similar total LDL-C concentrations [Citation53]. When compared with age-matched men with normal lipid levels, young men with hypertriglyceridemia presented with small dense LDL particles that were associated increased serum levels of adhesion molecules and impaired flow mediated vasodilation [Citation54]. Some studies have suggested that the definite way to assess potential atherogenicity of LDL particles would be a direct measurement of the LDL particle size [Citation55,Citation56].
AIP reflects the lipoprotein composition in plasma, and it has been postulated as a surrogate marker for small dense LDL particles, and also as a predictor of atherosclerosis, cardiovascular risk, and even effectiveness of therapy [Citation18–21,Citation25,Citation27]. AIP was found to be higher in 2936 patients with coronary artery disease versus 2451 controls [Citation25], while AIP has also been suggested as an independent risk factor for coronary artery disease [Citation24,Citation25]. An AIP value below 0.11 has been associated with low, values from 0.11 to 0.24 with intermediate, and values exceeding 0.24 with high cardiovascular disease risk [Citation20–22,Citation24,Citation57]. Dobiášová et al. examined 1433 subjects with various risks of atherosclerosis and reported that AIP directly correlated with the fractional esterification rate of HDL (r = 0.803), and inversely correlated with LDL particle size (r = −0.776). The fractional esterification rate of HDL strongly predicted particle size in LDL (r = −818), and the use of lg10(triglycerides/HDL-C) ratio was considered as a useful predictor of plasma atherogenicity, as it reflected the metabolic interactions within the whole lipoprotein complex [Citation18,Citation20,Citation22].
Plasma triglycerides levels have been previously associated with arterial stiffness [Citation14,Citation16], but contradictory findings have been published. A study in young type 1 diabetic patients found that an increase in triglycerides level of 48 mg/dl (0.54 mmol/L) resulted in a 1.0% higher PWV during a 4.8-year follow-up, but this increase was no longer significant after adjustment for baseline waist circumference, LDL-C, and HbA1c [Citation39]. In 917 middle-aged French men and women, neither plasma triglycerides nor HDL-C were independently related with carotid-femoral PWV [Citation38]. Although some reports have inversely associated HDL-C with arterial stiffness [Citation15,Citation17], HDL-C was not correlated with brachial-ankle PWV in 12,900 Chinese adults aged 20–79 years [Citation40].
In the present study, the highest tertile with a mean AIP of 0.15 presented with the highest PWV. In the regression analyses, age and the prevailing level of BP showed the strongest associations with PWV, corresponding to previous studies [Citation12,Citation13]. However, AIP was also significantly and independently related with arterial stiffness (Beta values in the two models 0.100–0.145, p ≤ .007 for both). As discussed above, controversies remain about the associations of triglycerides and HDL-C with arterial stiffness, while our findings for the first time suggest that AIP is directly and independently associated with PWV, an acknowledged marker of large arterial stiffness that is also strongly related to cardiovascular risk [Citation11]. The present results do not provide an explanation why AIP is better correlated with arterial stiffness than LDL-C. The process leading to increased large arterial stiffness is complex and comprises influences mediated via mechanical pulsatile stress, inflammatory cells, growth factors, and alterations in endothelial function, enzymes that degrade elastin, changes in smooth muscle cells from the contractile to the synthetic phenotype, and increased extracellular matrix production by fibroblasts [Citation47]. Plasma triglycerides and HDL-C are known to have opposite influences on oxidative stress, inflammation, extracellular matrix formation, and on the change in vascular smooth muscle from the contractile to the synthetic phenotype, and the index AIP summarizes these influences [Citation43].
The current study has limitations and the interpretation of the results should be done cautiously. The present methods have been validated against invasive measurements, 3 dimensional ultrasound, and tonometric recordings of PWV [Citation31–34]. Nevertheless, the non-invasive evaluation of stroke volume and cardiac output is based on mathematical analysis of the bioimpedance signal that simplifies physiology [Citation33]. The present recordings lasted for 5 minutes, which gives a rather narrow window of observation for the examination of haemodynamics. Yet, when compared with single measurements of BP and heart rate, the present analyses were based on recordings collected from more than 300 cardiac cycles. The haemodynamic recordings were performed in subjects who themselves were willing to participate, and this makes a potential source for selection bias. The inclusion of PWV in the regression model 2 resulted in an inverse relationship between age and systolic and diastolic BP in the present population, probably due to the strong interrelationship between PWV and age (rS = 0.67, p < .001). A small but significant inverse association between present smoking and PWV was perceived. According to our previous report that was focused on the haemodynamic effects of smoking, and also to a comprehensive review, smoking does not usually influence PWV [Citation12,Citation58]. In our previous study, present smokers had a clear reduction in systemic vascular resistance [Citation58], and such a haemodynamic change may favour reductions in PWV. Finally, the cross-sectional design does not allow conclusions about causality, and the present findings should be confirmed in follow-up studies.
In conclusion, the present results showed that AIP was directly and independently associated with arterial stiffness. AIP is known to inversely correlate with LDL particle size [Citation18,Citation21], and it can be readily calculated from the routine lipid profiles. The link between AIP and large arterial stiffness further supports the view that calculation of AIP should be included in the normal clinical cardiovascular disease risk evaluation.
Financial support
This work was financially supported by Aarne Koskelo Foundation, Competitive State Research Financing of the Expert Responsibility Area of Tampere University Hospital, Finnish Foundation for Cardiovascular Research, Paavo Nurmi Foundation, Päivikki and Sakari Sohlberg Foundation, Sigrid Jusélius Foundation, and Pirkanmaa Regional Fund of the Finnish Cultural Foundation.
Acknowledgements
The authors are deeply grateful to Paula Erkkilä, research nurse (RN), and Reeta Kulmala, RN, for invaluable technical assistance. The CSC – IT Center for Science, Finland, is sincerely acknowledged for computational resources.
Disclosure statement
The authors declare no conflicts of interest with respect to this manuscript.
Data availability
Analyses and generated datasets that support the current study are not available publicly. The datasets are available from the corresponding author on reasonable request.
References
- World health organisation. WHO | Cardiovascular diseases (CVDs). WHO. 2017. http://www.who.int/mediacentre/factsheets/fs317/en/.
- Roger VL, Go AS, Lloyd-Jones DM, et al. Heart disease and stroke statistics-2011 update: a report from the American Heart Association. Circulation. 2011;123:e18–e209.
- Cholesterol Treatment Trialists’ (CTT) Collaborators. The effects of lowering LDL cholesterol with statin therapy in people at low risk of vascular disease: meta-analysis of individual data from 27 randomised trials. Lancet. 2012;380:581–590.
- Lamarche F, Agharazii M, Nadeau-Fredette A-C, et al. Central and brachial blood pressures, statins, and low-density lipoprotein cholesterol: a mediation analysis. Hypertension. 2018;71:415–421.
- Madsen CM, Varbo A, Nordestgaard BG. Extreme high high-density lipoprotein cholesterol is paradoxically associated with high mortality in men and women: two prospective cohort studies. Eur Heart J. 2017;38:2478–2486.
- Scandinavian Simvastatin Survival Study Group. Randomised trial of cholesterol lowering in 4444 patients with coronary heart disease: the Scandinavian Simvastatin Survival Study (4S). Lancet. 1994;344:1383–1389.
- Stone NJ, Robinson JG, Lichtenstein AH, et al. 2013 ACC/AHA guideline on the treatment of blood cholesterol to reduce atherosclerotic cardiovascular risk in adults: a report of the American College of Cardiology/American Heart Association task force on practice guidelines. J Am Coll Cardiol. 2014;63:2889–2934.
- Nordestgaard BG, Benn M, Schnohr P, et al. Nonfasting triglycerides and risk of myocardial infarction, ischemic heart disease, and death in men and women. JAMA. 2007;298:299–308.
- Sarwar N, Danesh J, Eiriksdottir G, et al. Triglycerides and the risk of coronary heart disease: 10,158 incident cases among 262,525 participants in 29 Western prospective studies. Circulation. 2007;115:450–458.
- Hokanson JE, Austin MA. Plasma triglyceride level is a risk factor for cardiovascular disease independent of high-density lipoprotein cholesterol level: a meta-analysis of population-based prospective studies. J Cardiovasc Risk. 1996;3:213–219.
- Vlachopoulos C, Aznaouridis K, O'Rourke MF, et al. Prediction of cardiovascular events and all-cause mortality with central haemodynamics: a systematic review and meta-analysis. Eur Heart J. 2010;31:1865–1871.
- Cecelja M, Chowienczyk P. Dissociation of aortic pulse wave velocity with risk factors for cardiovascular disease other than hypertension: a systematic review. Hypertension. 2009;54:1328–1336.
- Choudhary MK, Eräranta A, Tikkakoski AJ, et al. LDL cholesterol is associated with systemic vascular resistance and wave reflection in subjects naive to cardiovascular drugs. Blood Press. 2019;28:4–14.
- Wang X, Ye P, Cao R, et al. Triglycerides are a predictive factor for arterial stiffness: a community-based 4.8-year prospective study. Lipids Health Dis. 2016;15:97.
- Wang X, Du Y, Fan L, et al. Relationships between HDL-C, hs-CRP, with central arterial stiffness in apparently healthy people undergoing a general health examination. PLoS ONE. 2013;8:e81778.
- Kawasoe S, Ide K, Usui T, et al. Association of serum triglycerides with arterial stiffness in subjects with low levels of low-density lipoprotein cholesterol. Circ J. 2018;82:3052–3057.
- Wang F, Ye P, Luo L, et al. Association of serum lipids with arterial stiffness in a population-based study in Beijing. Eur J Clin Invest. 2011;41:929–936.
- Dobiás˘ová M, Frohlich J. The plasma parameter log (TG/HDL-C) as an atherogenic index: correlation with lipoprotein particle size and esterification rate inapob-lipoprotein-depleted plasma (FERHDL). Clin Biochem. 2001;34:583–588.
- Tan MH, Johns D, Glazer NB. Pioglitazone reduces atherogenic index of plasma in patients with type 2 diabetes. Clin Chem. 2004;50:1184–1188.
- Dobiášová M. Atherogenic index of plasma [Log(triglycerides/HDL-cholesterol)]: theoretical and practical Implications. Clin Chem. 2004;50:1113–1115.
- Dobiášová M, Frohlich J, Šedová M, et al. Cholesterol esterification and atherogenic index of plasma correlate with lipoprotein size and findings on coronary angiography. J Lipid Res. 2011;52:566–571.
- Frohlich J, Dobiášová M. Fractional esterification rate of cholesterol and ratio of triglycerides to HDL-cholesterol are powerful predictors of positive findings on coronary angiography. Clin Chem. 2003;49:1873–1880.
- Holmes DT, Frohlich J, Buhr KA. The concept of precision extended to the atherogenic index of plasma. Clin Biochem. 2008;41:631–635.
- Cai G, Shi G, Xue S, et al. The atherogenic index of plasma is a strong and independent predictor for coronary artery disease in the Chinese Han population. Medicine (Baltimore). 2017;96:e8058.
- Wu T-T, Gao Y, Zheng Y-Y, et al. Atherogenic index of plasma (AIP): a novel predictive indicator for the coronary artery disease in postmenopausal women. Lipids Health Dis. 2018;17:197.
- Cure E, Icli A, Uslu AU, et al. Atherogenic index of plasma: a useful marker for subclinical atherosclerosis in ankylosing spondylitis: AIP associate with cIMT in AS. Clin Rheumatol. 2018;37:1273–1280.
- Shen S, Lu Y, Qi H, et al. Association between ideal cardiovascular health and the atherogenic index of plasma. Medicine (Baltimore). 2016;95:e3866.
- Williams B, Mancia G, Spiering W, et al. 2018 ESC/ESH Guidelines for the management of arterial hypertension. Eur Heart J. 2018;39:3021–3104.
- Katz A, Nambi SS, Mather K, et al. Quantitative insulin sensitivity check index: a simple, accurate method for assessing insulin sensitivity in humans. J Clin Endocrinol Metab. 2000;85:2402–2410.
- Inker LA, Schmid CH, Tighiouart H, et al. Estimating glomerular filtration rate from serum creatinine and cystatin C. N Engl J Med. 2012;367:20–29.
- Chen C-H, Nevo E, Fetics B, et al. Estimation of central aortic pressure waveform by mathematical transformation of radial tonometry pressure: validation of generalized transfer function. Circulation. 1997;95:1827–1836.
- Wilenius M, Tikkakoski AJ, Tahvanainen AM, et al. Central wave reflection is associated with peripheral arterial resistance in addition to arterial stiffness in subjects without antihypertensive medication. BMC Cardiovasc Disord. 2016;16:131.
- Kööbi T, Kaukinen S, Ahola T, et al. Non-invasive measurement of cardiac output: whole-body impedance cardiography in simultaneous comparison with thermodilution and direct oxygen fick methods. Intensive Care Med. 1997;23:1132–1137.
- Koskela JK, Tahvanainen A, Haring A, et al. Association of resting heart rate with cardiovascular function: a cross-sectional study in 522 Finnish subjects. BMC Cardiovasc Disord. 2013;13:102.
- Kööbi T, Kähönen M, Iivainen T, et al. Simultaneous non-invasive assessment of arterial stiffness and haemodynamics - a validation study. Clin Physiol Funct Imaging. 2003;23:31–36.
- Tahvanainen A, Koskela J, Tikkakoski A, et al. Analysis of cardiovascular responses to passive head-up tilt using continuous pulse wave analysis and impedance cardiography. Scand J Clin Lab Invest. 2009;69:128–137.
- Finnish Guidelines for the Current Care of Subjects with Alcohol Problem. 2015. http://www.kaypahoito.fi/web/kh/suositukset/suositus?id=hoi50028#NaN.
- Czernichow S, Bertrais S, Blacher J, et al. Metabolic syndrome in relation to structure and function of large arteries: a predominant effect of blood pressure. A report from the SU.VI.MAX. Vascular Study. Am J Hypertens. 2005;18:1154–1160.
- Dabelea D, Talton JW, D'Agostino R, et al. Cardiovascular risk factors are associated with increased arterial stiffness in youth with type 1 diabetes: the SEARCH CVD study. Diabetes Care. 2013;36:3938–3943.
- Weng C, Yuan H, Tang X, et al. Age- and gender dependent association between components of metabolic syndrome and subclinical arterial stiffness in a Chinese population. Int J Med Sci. 2012;9:730–737.
- Vlachopoulos C, O'Rourke M, Nichols WW. McDonald’s Blood Flow in Arteries, sixth edition: theoretical, experimental and clinical principles. Florida (FL): CRC Press; 2011.
- Laurent S, Cockcroft J, Van Bortel L, et al. Expert consensus document on arterial stiffness: methodological issues and clinical applications. Eur Heart J. 2006;27:2588–2605.
- O’Rourke MF, Staessen JA, Vlachopoulos C, et al. Clinical applications of arterial stiffness; definitions and reference values. Am J Hypertens. 2002;15:426–444.
- Lowry D, Saeed M, Narendran P, et al. A review of distribution of atherosclerosis in the lower limb arteries of patients with diabetes mellitus and peripheral vascular disease. Vasc Endovasc Surg. 2018;52:535–542.
- Ridker PM, Everett BM, Thuren T, et al. Antiinflammatory therapy with canakinumab for atherosclerotic disease. N Engl J Med. 2017;377:1119–1131.
- Ridker PM, Rifai N, Rose L, et al. Comparison of C-reactive protein and low-density lipoprotein cholesterol Levels in the prediction of first cardiovascular events. N Engl J Med. 2002;347:1557–1565.
- Lacolley P, Regnault V, Segers P, et al. Vascular smooth muscle cells and arterial stiffening: relevance in development, aging, and disease. Physiol Rev. 2017;97:1555–1617.
- Kutkiene S, Petrulioniene Z, Laucevicius A, et al. Cardiovascular risk profile of patients with atherogenic dyslipidemia in middle age Lithuanian population. Lipids Health Dis. 2018;17:208.
- Valensi P, Avignon A, Sultan A, et al. Atherogenic dyslipidemia and risk of silent coronary artery disease in asymptomatic patients with type 2 diabetes: a cross-sectional study. Cardiovasc Diabetol. 2016;15:104.
- Boizel R, Benhamou PY, Lardy B, et al. Ratio of triglycerides to HDL cholesterol is an indicator of LDL particle size in patients with type 2 diabetes and normal HDL cholesterol levels. Diabetes Care. 2000;23:1679–1685.
- Hirayama S, Miida T. Small dense LDL: an emerging risk factor for cardiovascular disease. Clin Chim Acta. 2012;414:215–224.
- Moin DS, Rohatgi A. Clinical applications of advanced lipoprotein testing in diabetes mellitus. Clin Lipidol. 2011;6:371–387.
- Cure MC, Tufekci A, Cure E, et al. Low-density lipoprotein subfraction, carotid artery intima-media thickness, nitric oxide, and tumor necrosis factor alpha are associated with newly diagnosed ischemic stroke. Ann Indian Acad Neurol. 2013;16:498–503.
- Lupattelli G, Lombardini R, Schillaci G, et al. Flow-mediated vasoactivity and circulating adhesion molecules in hypertriglyceridemia: association with small, dense LDL cholesterol particles. Am Heart J. 2000;140:521–526.
- Superko HR. Beyond LDL cholesterol reduction. Circulation. 1996;94:2351–2354.
- Lamarche B, Tchernof A, Moorjani S, et al. Small, dense low-density lipoprotein particles as a predictor of the risk of ischemic heart disease in men. Prospective results from the Québec Cardiovascular Study. Circulation. 1997;95:69–75.
- Dobiásová M. AIP–atherogenic index of plasma as a significant predictor of cardiovascular risk: from research to practice. Vnitr Lek. 2006;52:64–71.
- Choudhary MK, Eräranta A, Tikkakoski AJ, et al. Effect of present versus previous smoking on non-invasive haemodynamics. Sci Rep. 2018;8:13643.