
Abstract
Purpose: The underlying causes of primary hypertension are not fully understood. Evidence on the relation of plasma calcium concentration with blood pressure (BP) is inconsistent and relies largely on studies utilizing office BP measurements in populations using cardiovascular drugs. In many studies adjustment for confounders was not optimal. In this cross-sectional study we examined the association of plasma total calcium concentration with the haemodynamic determinants of blood pressure.
Subjects and methods: Supine haemodynamics were recorded using pulse wave analysis, whole-body impedance cardiography, and heart rate variability analysis in 618 normotensive or never-treated hypertensive subjects (aged 19–72 years) without diabetes, cardiovascular or renal disease, or cardiovascular medications. Linear regression analysis was used to investigate factors associated with haemodynamic variables.
Results: Mean age was 45.0 years, body mass index 26.8 kg/m2, seated office BP 141/89 mmHg, and 307 subjects (49.7%) were male. Mean values of routine blood and plasma chemistry analyses were within the reference limits of the tests except for low-density lipoprotein cholesterol (3.05 mmol/l). In the laboratory, mean supine radial BP was 131/75 mmHg, and both systolic and diastolic BP correlated directly with plasma total calcium concentration (r = 0.25 and r = 0.22, respectively, p < 0.001 for both). In regression analysis plasma total calcium concentration was an independent explanatory variable for radial and aortic systolic and diastolic BP, and systemic vascular resistance, but not for cardiac output, pulse wave velocity, or any of the heart rate variability parameters.
Conclusion: Plasma total calcium concentration was directly associated with systolic and diastolic BP and systemic vascular resistance in normotensive or never-treated hypertensive subjects without comorbidities and cardiovascular medications. Higher plasma calcium concentration potentially plays a role in primary hypertension via an effect on vascular resistance.
Introduction
Despite the high global prevalence of hypertension and its known clinical consequences, the underlying causes of hypertension are still not fully understood. In a vast majority of hypertensive subjects (∼90%) the aetiology cannot be defined, and hence the term primary hypertension is used [Citation1,Citation2]. The identification of novel risk factors for hypertension is an important step to better understand its aetiology, find novel treatment targets, and reduce the associated burden of morbidity and mortality.
Calcium and hormones regulating calcium balance have been shown to be linked to the regulation of BP [Citation3–7] and risk of incident hypertension [Citation8–10]. However, a comprehensive understanding of the relation between calcium metabolism and BP remains to be established. This is probably due to the complex nature of calcium ion as an intracellular and extracellular messenger [Citation11,Citation12], the complexity of calcium metabolism with many interdependent hormones [Citation13], the bidirectional relationship between calcium metabolism and the renin-angiotensin-aldosterone-system [Citation14–17], and the putative direct functional role of the calcium-sensing receptor (CaSR) in the vasculature [Citation18–20].
Alterations in extracellular calcium levels may influence calcium-mediated intracellular signalling and potentially play a role in the pathogenesis of primary hypertension in humans [Citation21]. However, serum calcium concentration is tightly regulated by extracellular CaSR in the parathyroid glands, and a concerted interplay between the calcium regulating hormones parathyroid hormone (PTH), vitamin D3 and to a lesser extent calcitonin [Citation12]. Studies that have examined the association between serum total calcium concentration and BP have yielded conflicting results (Supplemental Table 1). Some studies reported a direct association, while others found no association. Some of these studies were characterized by relatively small sample sizes, and some by suboptimal adjustment for confounders like smoking habits, alcohol use, renal function, and plasma concentrations of vitamin D metabolites and PTH. In addition, all except two of the previous studies utilized office BP measurements without detailed haemodynamic analyses, and several investigations included subjects using antihypertensive medications or other drugs with direct cardiovascular influences (Supplemental Table 1).
The inconsistent findings in the previous observations as well as the methodological questions presented above warrant further investigations of the associations between calcium metabolism and haemodynamics. We examined in a cross-sectional study whether plasma total calcium concentration is associated with the haemodynamic determinants of BP in 618 normotensive or never-treated hypertensive subjects without diabetes, cardiovascular or cerebrovascular disease, renal impairment, or medications with direct cardiovascular influences. Haemodynamics were characterized using pulse wave analysis, whole-body impedance cardiography and heart rate variability analysis.
Subjects and methods
Study population
This study is part of an ongoing research on haemodynamics in primary and secondary hypertension (the DYNAMIC-study, clinical trial registration NCT01742702). The study complies with the Declaration of Helsinki, and was approved by the ethics committee of the Tampere University Hospital (code R06086M) and the Finnish Medicines Agency (Eudra-CT number 2006-002065-39). All methods were carried out in accordance with the relevant guidelines and regulations.
The present study subjects were screened from 1349 participants who were recruited via announcements in local newspapers and in facilities of Tampere University Hospital, University of Tampere, Varala Sports Institute, and local organizations that provide occupational health care. Signed informed consent was obtained from all participants, and they were interviewed and examined by a physician. Smoking status was recorded and cigarette consumption calculated as pack-years. Alcohol consumption was recorded as standard drinks (∼12 grams of absolute alcohol) per week. The use of medicines, dietary supplements, and other substances not registered as drugs was documented. Dairy product consumption was recorded as standard daily doses. Seated office BP was measured by a physician according to ESH/ESC Guideline [Citation22] using a manual sphygmomanometer (Heine Gamma G7, Herrsching, Germany). The phase I and V Korotkoff sounds were used to identify systolic and diastolic BP, respectively.
The exclusion criteria and number of subjects excluded due to each reason were: 1) use of antihypertensives or other medications with direct haemodynamic influences (like α1-adrenoceptor blockers for prostate hyperplasia, and β2-adrenoreceptor agonists for asthma) (n = 619); 2) history of cardiovascular or cerebrovascular disease (n = 176); 3) heart rhythm other than sinus (n = 14); 4) diabetes mellitus (n = 108); 5) chronic kidney disease [estimated glomerular filtration rate (GFR) <60 ml/min/1.73 m2, or proteinuria] (n = 73); 6) chronic liver disease (n = 0); 7) secondary hypertension [Citation22] (n = 221); 8) psychiatric illness other than mild depression or anxiety (n = 4); 9) alcohol or substance abuse (n = 23). No recordings were performed for subjects with any acute illness.
The study group consisted of 618 subjects (307 men and 311 women) aged 19–72 years. Based on the office BP measurements, 248 (40.1%) of the participants were normotensive (95 men and 153 women) and 370 (59.9%) were hypertensive (212 men and 158 women) [Citation22]. In total 240 (38.9%) of the participants used some medications. Seventy-six women used hormones for contraception or hormone replacement therapy, while 104 women were post-menopausal. Thirteen subjects used statins, 1 took ezetimibe, 22 used thyroxin for hypothyroidism, 15 took inhaled corticosteroids for asthma, 39 used antidepressants (mainly selective serotonin reuptake inhibitors, while 5 subjects used amitriptyline, 4 subjects venlafaxine, 2 subjects duloxetine, and 2 subjects mirtazapine), 6 were taking anxiolytics (benzodiazepines), and 2 subjects used antiepileptics. Four subjects used COX-2 inhibitors and 5 subjects non-selective NSAIDs.
Laboratory analyses
Blood and urine samples were collected after ∼12 h fasting. Plasma total calcium and other electrolytes, cystatin C, creatinine, C-reactive protein (CRP), alanine aminotransferase (ALT), alkaline phosphatase (ALP), glucose, uric acid, and lipid determinations were carried out using Cobas Integra 700/800 (F. Hoffmann-LaRoche Ltd., Basel, Switzerland) or Cobas 6000, module c501 (Roche Diagnostics, Basel, Switzerland). PTH and insulin were determined using electrochemiluminescence immunoassay (Cobas e411, Roche Diagnostics), and insulin sensitivity was evaluated by calculating quantitative insulin sensitivity check index (QUICKI) [Citation23]. Blood cell counts were analysed using ADVIA 120 or 2120 (Bayer Health Care, Tarrytown, NY, USA). Plasma renin activity was measured using GammaCoat Plasma Renin Activity assay (Diasorin S.p.A., Saluggia, Italy), and aldosterone concentrations using active aldosterone radioimmunoassay (Diagnostics Systems Laboratories, Beckman Coulter, Webster, TX, USA). Plasma concentrations of calcidiol (25(OH)D3) and calcitriol (1,25(OH)2D3) were analysed using enzyme immunoassay (Immunodiagnostic Systems, Boldon, UK). Kidney disease was excluded by estimating GFR using CKD-EPI cystatin C formula [Citation24], and by urine dipstick analysis using an automated refractometer test (Siemens Clinitec Atlas or Advantus, Siemens Healthcare GmbH, Erlangen, Germany).
Protocol for haemodynamic measurements
Prior to the recordings the participants were instructed to abstain from caffeine-containing products, smoking, and heavy meals for ≥4 h, and from alcohol for ≥24 h. Haemodynamics were recorded in a quiet temperature-controlled laboratory by a trained nurse. The subjects rested supine for ∼10 min, and then the nurse measured BP twice by a manual sphygmomanometer (Heine Gamma G7). Thereafter beat-to-beat supine haemodynamic data was recorded for 5 min. The mean values of the variables during the last 3 min were used in the analyses, as this was the most stable period. On average the data from each subject represented ≥180 cardiac cycles. For the heart rate variability analyses the mean values of the whole 5-minute recording period were used.
Pulse wave analysis
Radial BP and pulse wave form were continuously recorded using a tonometric sensor (Colin BP-508T, Colin Medical Instruments Corp., San Antonio, TX, USA) fixed on the left radial pulse. Radial BP measurement was calibrated twice during the 5-minute recording by contralateral brachial BP measurement using an oschillometric cuff at the upper arm. Aortic BP and pulse wave reflections were derived from the tonometric signal with the SphygmoCor® system (SphygmoCor® PWMx, AtCor Medical, Australia) utilizing a validated transfer function [Citation25]. Heart rate, aortic pulse pressure, aortic augmentation pressure, and augmentation index (AIx, aortic augmentation pressure ∕ aortic pulse pressure × 100) were also determined. AIx adjusted for heart rate of 75 beats/min (AIx@75) was determined with the SphygmoCor® software.
Whole-body impedance cardiography
Whole-body impedance cardiography (CircMon® device, JR Medical Ltd., Estonia), which detects changes in body’s electrical impedance during cardiac cycles, was utilized to determine beat-to-beat heart rate, stroke volume, cardiac output, aortic-to-popliteal pulse wave velocity (PWV), extracellular water volume (ECW), and ECW balance. The method and electrode configuration have been described previously [Citation26]. Finger BP was recorded using a plethysmographic cuff (Finapres, Enschede, the Netherlands) in the left middle finger. Systemic vascular resistance (SVR) was calculated from tonometric BP and cardiac output so that the assumed normal central venous pressure (3 mmHg) was subtracted from mean arterial pressure and the value was divided by cardiac output [Citation26]. Cardiac output, stroke volume and SVR were normalized for body surface area to obtain cardiac index, stroke index and SVR index.
ECW was evaluated with the CircMon device by the formula ECW = k × (height2/Z). The coefficient k (Ω × cm) is derived from blood resistivity and the relation between the distance of voltage electrodes and body height in centimeters, and Z is the recorded impedance of the body. The ECW balance was calculated as ECW/ECWpredicted. The formula for ECWpredicted was 2.4 × (0.0236 × height0.725 × weight0.423 − 1.229) in males and 2.6×(0.0248 × height0.725 × weight0.423 − 1.9549) in females [Citation27–29]. For easier interpretation, the results of the ECW balance were adjusted so that the mean value in the lowest calcium tertile was 1.0.
Stroke volume measured using CircMon® correlates well with values obtained with 3-dimensional echocardiography [Citation30]. Cardiac output measured with CircMon® correlates well with values measured with the thermodilution and the direct oxygen Fick methods [Citation26,Citation31]. As the whole-body impedance cardiography slightly overestimates PWV, a validated equation (PWV = PWVimpedance × 0.696 + 0.864) was used to calculate values corresponding to Doppler ultrasound method [Citation32]. PWV values obtained using this equation correlate well with values measured with Doppler ultrasound or applanation tonometry [Citation32,Citation33]. Whole-body bioimpedance-derived ECW correlates well with 51Cr-EDTA dilution-based measurement of ECW (r = 0.74, bias 0.2 ± 1.1 litres), as well as with perioperative weight changes of patients [Citation34]. The repeatability and reproducibility of this measurement protocol has been previously established [Citation32,Citation35,Citation36].
Frequency domain analysis of heart rate variability
The electrocardiograms were recorded by the CircMon® device at sampling rate of 200 Hz, and analysed using Matlab software (MathWorks Inc., Natick, MA, USA). Normal R-R intervals were recognized, and if the interval differed over 20% from the previous values the beat was considered as ectopic. The artefacts were processed using the cubic spline interpolation method, and the frequency domain variables were calculated using the Fast Fourier Transformation method [Citation37], consisting of 1) power in low frequency (LF) range (0.04–0.15 Hz), 2) power in high frequency (HF) range (0.15–0.40 Hz), and 3) LF/HF ratio. Both LF and HF power were transformed to the natural logarithm before analyses to yield normal non-skewed distributions.
Statistical analyses
The subjects were divided into tertiles of plasma total calcium concentration separately within each sex, and the sex-specific tertiles were applied in the subsequent analyses. The participants were also grouped according to the use of calcium and/or vitamin D supplements. One-way analysis of variance (ANOVA) was applied to assess the differences in the clinical characteristics, blood and plasma chemistry test values, haemodynamic variables, and consumption of supplements and dairy products. The Bonferroni correction was applied in the post-hoc analyses and Levene’s test was used to test homogeneity of variances.
Variables for linear regression analysis were selected by utilizing Spearman’s nonparametric correlation analysis for radial systolic and diastolic BP, and p < 0.05 was used as the inclusion criterion. The normality of the distributions of the variables was assessed using skewness and kurtosis data, and with normal Q-Q plot, and with the Shapiro–Wilk test. Due to skewed distributions, ECW balance, PTH, 1,25(OH)2D3, uric acid, CRP, triglycerides, high-density lipoprotein (HDL) cholesterol, ALP, ALT, and renin were corrected by Lg10-transformation. Smoking status was categorized using two discrete variables that enabled classification to current smokers, previous smokers or never smokers (category for smoking or previous smoking was either 0 or 1, thus a never smoker received a category 0 for both). Alcohol consumption was categorized using three discrete variables (category either 0 or 1); cut-points for women 0 (abstinence), 1–7 (low consumption), 8–14 (moderate consumption), and ≥15 doses per week (high consumption); for men 0, 1–14, 15–24, and ≥25 doses per week, respectively, according to the Finnish Guidelines [Citation38]. Linear regression analyses with backward elimination were used to investigate explanatory variables associated with the haemodynamic variables of interest. The final regression model included age, sex, body mass index (BMI), categorized alcohol consumption, smoking status; use of dairy products, calcium supplements, vitamin D supplements; QUICKI; plasma concentrations of calcium, phosphate, sodium, cystatin C, low-density lipoprotein (LDL) cholesterol; and Lg10 of plasma concentrations of CRP, PTH, 1,25(OH)2D3, uric acid, ALP, ALT, triglycerides, HDL cholesterol, renin; and Lg10 of ECW balance. In additional analyses the subjects were divided into tertiles according to age, and each tertile analysed separately. SPSS version 25.0 for Windows software (IBM SPSS, Armonk, NY, USA) was used for statistics. The results are presented as mean with standard deviation (SD) of the mean or with 95% confidence interval (CI) of the mean, and p < 0.05 was considered statistically significant.
Results
Study population
The total study population comprised of 618 subjects and 49.7% (307) were men. Mean age was 45.0 years (range 19–72 years), mean BMI 26.8 kg/m2, and mean seated office BP 141/89 mmHg. Mean plasma total calcium concentration was 2.28 mmol/l (CI 2.27–2.30) in women, and 2.32 mmol/l (CI 2.31–2.33) in men (p < 0.001). Therefore, the results below concerning the tertiles of plasma calcium concentration were adjusted for sex. The demographics and clinical characteristics in each tertile of plasma total calcium concentration are presented in .
Table 1. Demographics, clinical characteristics and laboratory results per tertile of plasma total calcium concentration.
Mean age, BMI, ECW, percentage of current smokers, dairy product consumption, and percentage of calcium or vitamin D supplement users did not differ between the calcium tertiles. Mean ECW balance was lower in the highest calcium tertile versus the lowest calcium tertile (0.97 vs. 1.00, respectively; p < 0.01). Mean alcohol consumption as standard drinks per week was somewhat higher in the highest calcium tertile versus the lowest calcium tertile (5.4 vs. 3.7, respectively; p < 0.05).
Mean values of blood and plasma chemistry test results were within the reference limits of the tests in all calcium tertiles, except for plasma total and LDL cholesterol concentrations that were slightly above the upper limits of the reference values in the middle and highest tertiles (Supplemental Table 2). In addition to the obvious deviations in mean plasma total calcium concentration, there were small but statistically significant (p < 0.05) differences in the mean plasma chemistry test results between the calcium tertiles: Plasma phosphate was higher in the highest calcium tertile versus the other tertiles, while plasma 25(OH)D3 was higher in the highest calcium tertile versus the lowest calcium tertile. Plasma cystatin C, total and LDL cholesterol were higher, while estimated GFR was lower, in the highest and the middle calcium tertiles versus the lowest calcium tertile (Supplemental Table 2).
In total 511 subjects used no calcium or vitamin D supplements, while 6 subjects took calcium supplements, 88 subjects took vitamin D supplements, and 13 subjects used both calcium and vitamin D supplements (Supplemental Table 3). There were no differences between the groups in mean plasma total calcium, phosphate or PTH concentrations, or in dairy product consumption. However, mean 25(OH)D3 concentration was higher in the two groups using vitamin D supplements when compared with the group using neither calcium nor vitamin D supplements (p < 0.05 for both). The plasma concentration of 1,25(OH)2D3 was higher in the small group (n = 13) taking both calcium and vitamin D supplements when compared with the groups not taking the supplements or using only vitamin D supplement (p < 0.05 for both) (Supplemental Table 3).
BP and haemodynamic variables in the tertiles of plasma total calcium concentration
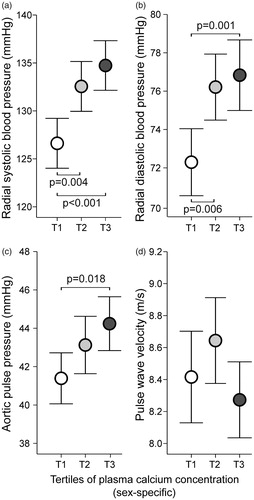
Mean seated office BP did not differ between the calcium tertiles (). However, mean supine systolic BP was higher in the highest and the middle calcium tertile versus the lowest calcium tertile when measured 1) at the brachial level indirectly by the research nurse using the auscultatory method, 2) at the radial level using applanation tonometry, and 3) at the finger level using a plethysmographic cuff (p < 0.01 for all, except for systolic finger BP p < 0.05) (). Mean supine diastolic BP was also higher in the highest tertile versus the lowest tertile at the brachial level, and in the highest and the middle calcium tertile versus the lowest calcium tertile at the radial level (p < 0.01 for all) ().
Mean radial systolic and diastolic BPs were higher in the middle and the highest calcium tertiles when compared with the lowest calcium tertile (). Similarly, mean aortic systolic and diastolic BPs were higher in the middle and the highest calcium tertiles when compared with the lowest calcium tertile (Supplemental Figure 1(a,b)).
Figure 1. Radial systolic blood pressure (a), radial diastolic blood pressure (b), aortic pulse pressure (c), and pulse wave velocity (d) in tertiles of plasma total calcium concentration adjusted for sex; mean (circle) with 95% confidence intervals of the mean (whiskers), one-way ANOVA with the Bonferroni correction in post-hoc analyses.
Plasma total calcium concentration correlated positively with radial systolic and diastolic BP (r = 0.228, and r = 0.195, respectively; p < 0.001 for both), aortic systolic and diastolic BP (r = 0.199, and r = 0.194, respectively; p < 0.001 for both), and finger systolic and diastolic BP (r = 0.147, and r = 0.098; p < 0.001, and p = 0.015, respectively), as well as with seated office systolic and diastolic BP (r = 0.141, and r = 0.129; p < 0.001, and p = 0.001, respectively).
Mean aortic pulse pressure was higher in the highest calcium tertile versus the lowest calcium tertile (), while PVW was not different between the calcium tertiles (. AIx, AIx@75, and aortic augmentation pressure were not different between the calcium tertiles (Supplemental Figure 1(c,d); AIx@75 not shown). Plasma total calcium concentration correlated with aortic pulse pressure (r = 0.144, p < 0.001), but not with PVW, AIx, AIx@75, or aortic augmentation pressure (r < 0.048, p > 0.237 for all).
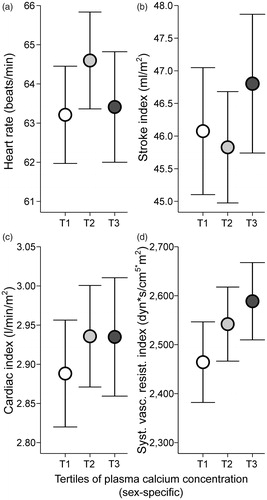
There were no statistically significant (p < 0.05) differences between the calcium tertiles in mean heart rate, stroke index, cardiac index, or SVR index (). Plasma total calcium concentration correlated with SVR index (r = 0.108, p = 0.007), but not with heart rate, cardiac index, or stroke index (r < 0.064, p > 0.113 for all). Also, no differences were observed between calcium tertiles in the low-frequency (LF) power, high-frequency (HF) power, and LF/HF ratio of heart rate variability (Supplemental Figure 2(a–c)). Plasma total calcium concentration did not correlate with any of the heart rate variability parameters (r < 0.069, p > 0.098 for all).
Figure 2. Heart rate (a), stroke index (b), cardiac index (c), and systemic vascular resistance index (d) in tertiles of plasma total calcium concentration adjusted for sex; mean (circle) with 95% confidence intervals of the mean (whiskers), one-way ANOVA with the Bonferroni correction in post-hoc analyses.
BP and haemodynamic variables in linear regression analyses
Linear regression analyses showed that plasma total calcium concentration was an independent explanatory variable for radial systolic and diastolic BP (standardized coefficient Beta = 0.138, and 0.119; p = 0.001, and p = 0.003, respectively) (). In additional analyses plasma total calcium concentration was also an independent explanatory variable for aortic systolic and diastolic BP (Beta = 0.149, and Beta = 0.122; p < 0.001, and p = 0.002, respectively), aortic pulse pressure (Beta = 0.120, p = 0.002), and for finger systolic BP (Beta = 0.137, p = 0.001), but not for seated office systolic or diastolic BP (Beta = 0.044, and Beta = 0.052; p = 0.241, and p = 0.182, respectively).
Table 2. Significant explanatory variables for radial systolic and diastolic blood pressure in linear regression analysis.
As the major determinants of BP, the regression analyses also examined cardiac output and SVR as the variables of interest. Plasma total calcium concentration was not an explanatory variable for cardiac output, but was an independent explanatory factor for SVR (Beta = 0.098, p = 0.029) (). Finally, plasma total calcium concentration was not an independent explanatory variable for PWV, AIx or AIx@75 (Beta = −0.007, Beta = 0.047, and Beta = 0.046; p = 0.823, p = 0.145, and p = 0.137, respectively).
Table 3. Significant explanatory variables for cardiac output and systemic vascular resistance in linear regression analysis.
Additional analyses in tertiles of age
Although age did not correlate with plasma total calcium concentration (r = 0.004, p = 0.923), additional analyses were performed so that the subjects were divided into tertiles of age. The age ranges in the Tertiles 1, 2 and 3 were: 19.0–40.0, 40.1–52.0, and 52.1–72.0 years, with the mean (SD) ages of 31.1 (6.0), 46.8 (3.3), and 58.0 (4.1) years, respectively. When each tertile was analysed separately using linear regression analysis, plasma total calcium concentration was an independent explanatory variable for radial systolic BP in all tertiles (Tertile 1 Beta = 0.203, p = 0.001; Tertile 2 Beta = 0.151, p = 0.029; and Tertile 3 Beta = 0.265, p < 0.001), and for radial diastolic BP in the middle and the highest tertile (Tertile 1 Beta = 0.117, p = 0.076; Tertile 2 Beta = 0.158, p = 0.023; and Tertile 3 Beta = 0.246, p = 0.001, respectively).
Discussion
In our study in 618 Caucasian normotensive or never-treated hypertensive subjects, plasma total calcium concentration was directly associated with radial and aortic systolic and diastolic BP, as well as systemic vascular resistance, but not with cardiac output, pulse wave velocity, or any of the heart rate variability parameters. All participants were without previously diagnosed diabetes, cardiovascular or cerebrovascular disease, renal insufficiency, and medications with direct cardiovascular influences. The association of plasma total calcium concentration with haemodynamics was investigated using whole-body impedance cardiography and analyses of pulse wave and heart rate variability, and a comprehensive adjustment for confounders was applied.
Our data indicates a direct association between plasma total calcium concentration and central and peripheral BP. Some previous reports observed a direct relation between serum total calcium concentration and seated office BP (Supplemental Table 1), while in the present regression analyses plasma calcium concentration was not an explanatory factor for seated office systolic and diastolic BP. Probably, the powerful confounding by the white-coat effect interfered with the BP measurements in the office [Citation22], as statistically significant (p < 0.05) differences in BP between the present calcium tertiles were found in the laboratory measurements performed by the research nurses using the auscultatory, tonometric and plethysmographic techniques. The observed direct association between plasma total calcium concentration and BP was not driven by age, as a direct association was present when all age tertiles were analysed separately. These findings indicate that plasma total calcium concentration should be considered as a potential contributor to the pathophysiology of primary hypertension. The observed differences in the supine systolic BP (7 mmHg) and diastolic BP (5 mmHg) between the highest and lowest calcium tertiles are also clinically significant, as such a difference is associated with an increased risk of cardiovascular disease [Citation39,Citation40]. Previously, Kim et al. [Citation8] found that higher plasma total calcium concentration (≥2.37 vs. <2.37 mmol/l) was associated with 1.24-fold increase in the incidence of hypertension during 6 years of follow-up in a Korean cohort of 5560 subjects.
The present regression analyses indicate that the observed direct association between plasma total calcium concentration and BP was mediated via SVR. In most of the earlier studies, the haemodynamic components involved in BP regulation were not addressed (Supplemental Table 1). However, Schutte et al. [Citation41] investigated the associations of serum total calcium concentration with 24-h ambulatory BP and Finometer® measurements during a stress test in 99 African men. They found that in younger men (<43 years, n = 50), but not in older men, serum total calcium concentration was directly associated with 24-h ambulatory BP and total peripheral resistance during the stress test [Citation41]. Previous experimental studies have suggested that higher extracellular calcium level increases calcium influx into arterial smooth muscle, induces smooth muscle contraction, and thus elevates SVR [Citation4,Citation42]. Experimental studies have found that CaSR activation in vascular smooth muscle sensitizes the arterial wall to contractile stimuli [Citation20] and potentially influences the regulation of SVR [Citation43]. The CaSR is also expressed in the human arterial wall [Citation18]. Furthermore, acute calcium infusion has been reported to impair endothelium-dependent relaxation in healthy subjects [Citation44], whereby extracellular calcium concentration may induce changes in endothelium-mediated control of arterial tone that contributes to the increase in SVR.
In the present study, plasma total calcium concentration was not associated with PWV, wave reflection (AIx), cardiac index, or ECW. Therefore, changes in large arterial stiffness, cardiac output, or volume status did not explain the higher BP associated with higher plasma total calcium concentration. ECW balance was actually lowest in the highest calcium tertile. Nevertheless, plasma total calcium concentration was directly associated with aortic pulse pressure. This finding can readily be attributed to higher vascular resistance, as SVR has been shown to be one of the major determinants of central pulse pressure in middle-aged subjects [Citation45]. Recently Mateus-Hamdan et al. [Citation46] reported a direct association between plasma total calcium concentration and supine brachial pulse pressure in 610 women aged ≥75 years, independently of serum PTH and vitamin D levels. They discussed that this direct association may be due to an increased arterial stiffness and vascular calcification. However, PWV or other variables reflecting large arterial stiffness were not measured in that study [Citation46].
We evaluated cardiac autonomic tone using analyses of heart rate variability [Citation47]. The 5-minute recording was analysed by the frequency domain methods according to the published standards [Citation37]. The HF oscillations of the recordings relate to parasympathetic tone, whereas the LF fluctuations are mediated by changes in both sympathetic and parasympathetic tone [Citation48]. The LF/HF ratio allows the evaluation of the balance between these two components of the autonomic nervous system [Citation49]. We found no differences in the HF power, LF power, or LF/HF ratio between the calcium tertiles. Also, plasma total calcium concentration did not correlate with any of the heart rate variability parameters. These results suggest that the direct association of plasma total calcium concentration with BP was not explained by changes in autonomic tone. Comparable levels of heart rate, cardiac output, plasma renin activity, and ECW across the calcium tertiles support unchanged autonomic tone, as these variables would be expected to increase during activated sympathetic tone [Citation50,Citation51].
Plasma total calcium comprises of three major forms: normally about 47% of the calcium is in the biologically active free ionized form, 40% is bound to serum proteins, mainly albumin, and the remaining 13% is complexed with anions such as bicarbonate, phosphate, and lactate [Citation52]. The determination of free ionized calcium requires special sample handling and carries higher risk of sources of error when compared to plasma total calcium measurement [Citation53]. Moreover, plasma total calcium concentration is highly correlated with ionized calcium concentration in patients without serum protein or acid-base abnormalities [Citation53]. Plasma total calcium concentration is influenced by the plasma albumin level. Numerous algorithms have been developed to allow correction of plasma total calcium concentration with the plasma albumin level, but their reliability remains questionable [Citation54–56]. In the present study, we excluded participants with potential causes for abnormal plasma albumin concentration, like patients with renal disease, diabetes, liver disease, or any severe acute or chronic illness, and did not use albumin correction for the plasma total calcium values.
Our study has limitations. Conclusions about causal relationships are precluded by the cross-sectional design. We cannot rule out a potential selection bias caused by the recruitment and exclusion protocol. Some of the variables were different between the lowest and highest plasma calcium tertiles, and although these variables were adjusted for in the regression analysis, they could have caused some residual confounding. Also, we utilized indirect non-invasive methods requiring mathematical processing to derive stroke volume, cardiac output and PWV from the bioimpedance signal [Citation26], and central aortic BP waveform from applanation tonometry signal [Citation25], and therefore the results must be interpreted with caution, even though the methods have been validated against direct or invasive measurements [Citation30–32]. However, the approach to examine central haemodynamics, rather than just to focus on brachial or radial artery pressure, may be better related with the level of cardiovascular risk [Citation57,Citation58]. We cannot exclude increased renal sympathetic nerve activity as a cause for elevated BP, as we only evaluated cardiac autonomic tone by the use of heart rate variability analysis. Nevertheless, normal plasma renin activity and ECW support the view that renal sympathetic drive was not altered. The heart rate variability data was filtered by the use of a computer programme to exclude ectopic beats, and unsatisfactory automatic filtering may have exposed the data to potential errors [Citation37]. Finally, we cannot exclude potential multicollinearity problems that were not controlled for by the statistical methods, as some of the clinical characteristics and biochemical variables are strongly correlated with each other.
To conclude, a direct association between plasma total calcium concentration and supine systolic and diastolic BP, and SVR was observed in 19- to 72-year-old normotensive or never-treated hypertensive subjects free of diabetes, cardiovascular or renal comorbidities, and cardiovascular medications. Therefore, plasma calcium concentration potentially plays a role in the pathogenesis of primary hypertension via an effect on vascular resistance. Prospective longitudinal studies are needed to confirm the present finding.
Supplemental_Figures.docx
Download MS Word (16.6 KB)Supplemental_Figure_2.tif
Download TIFF Image (997.6 KB)Supplemental_Figure_1.tif
Download TIFF Image (670 KB)Ca_and_Haemodynamics_Manuscript_Supplemental_Table_3_2019_11_12.docx
Download MS Word (40.5 KB)Ca_and_Haemodynamics_Manuscript_Supplemental_Table_2_2019_11_12.docx
Download MS Word (42.8 KB)Ca_and_Haemodynamics_Manuscript_Supplemental_Table_1_2019_11_12.docx
Download MS Word (42.6 KB)Acknowledgements
The authors thank Paula Erkkilä, RN, Reeta Kulmala, RN, for invaluable technical assistance and Heini Huhtala, MSc, for statistical support. The authors acknowledge CSC – IT Centre for Science, Finland, for computational resources.
Disclosure statement
The authors report no conflict of interest.
Data availability
Analyses and datasets of the current study are not available publicly as the clinical database contains several indirect identifiers and the informed consent obtained does not allow publication of individual patient data. The datasets are available from the corresponding author on reasonable request.
Additional information
Funding
Related Research Data
References
- Carretero OA, Oparil S. Essential hypertension: part I: definition and etiology. Circulation. 2000;101:329–335.
- Messerli FH, Williams B, Ritz E. Essential hypertension. Lancet. 2007;370:591–603.
- Bianchetti MG, Beretta-Piccoli C, Weidmann P, et al. Calcium and blood pressure regulation in normal and hypertensive subjects. Hypertension. 1983;5:II57–II65.
- Suzuki T, Aoki K. Hypertensive effects of calcium infusion in subjects with normotension and hypertension. J Hypertens. 1988;6:1003–1008.
- Hulter HN, Melby JC, Peterson JC, et al. Chronic continuous PTH infusion results in hypertension in normal subjects. J Clin Hypertens. 1986;2:360–370.
- Fliser D, Franek E, Fode P, et al. Subacute infusion of physiological doses of parathyroid hormone raises blood pressure in humans. Nephrol Dial Transplant. 1997;12:933–938.
- Jespersen B, Randlov A, Abrahamsen J, et al. Acute cardiovascular effect of 1,25-dihydroxycholecalciferol in essential hypertension. Am J Hypertens. 1998;11:659–666.
- Kim JW, Ko K-P, Koo HJ, et al. Plasma calcium and risk of hypertension: propensity score analysis using data from the Korean Genome and Epidemiology Study. Osong Public Health Res Perspect. 2011;2:83–88.
- van Ballegooijen AJ, Kestenbaum B, Sachs MC, et al. Association of 25-hydroxyvitamin D and parathyroid hormone with incident hypertension. J Am Coll Cardiol. 2014;63:1214–1222.
- Forman JP, Giovannucci E, Holmes MD, et al. Plasma 25-hydroxyvitamin D levels and risk of incident hypertension. Hypertension. 2007;49:1063–1069.
- Stojilkovic SS, Tomić M, Koshimizu T, et al. Calcium ions as intracellular messengers. In: Conn PM, Means AR, editors. Principles of Molecular Regulation. Totowa (NJ): Humana Press; 2000. p. 149–185.
- Brown EM, MacLeod RJ. Extracellular calcium sensing and extracellular calcium signaling. Physiol Rev. 2001;81:239–297.
- Brown EM. Extracellular Ca2+ sensing, regulation of parathyroid cell function, and role of Ca2+ and other ions as extracellular (first) messengers. Physiol Rev. 1991;71:371–411.
- Ortiz-Capisano MC, Ortiz PA, Garvin JL, et al. Expression and function of the calcium-sensing receptor in juxtaglomerular cells. Hypertension. 2007;50:737–743.
- Maillard MP, Tedjani A, Perregaux C, et al. Calcium-sensing receptors modulate renin release in vivo and in vitro in the rat. J Hypertens. 2009;27:1980–1987.
- Brown JM, Williams JS, Luther JM, et al. Human interventions to characterize novel relationships between the renin–angiotensin–aldosterone system and parathyroid hormone. Hypertension. 2014;63:273–280.
- Brown J, de Boer IH, Robinson-Cohen C, et al. Aldosterone, parathyroid hormone, and the use of renin-angiotensin-aldosterone system inhibitors: the multi-ethnic study of atherosclerosis. J Clin Endocrinol Metab. 2015;100:490–499.
- Molostvov G, James S, Fletcher S, et al. Extracellular calcium-sensing receptor is functionally expressed in human artery. Am J Physiol Ren Physiol. 2007;293:F946–F955.
- Smajilovic S, Tfelt-Hansen J. Novel role of the calcium-sensing receptor in blood pressure modulation. Hypertension. 2008;52:994–1000.
- Schepelmann M, Yarova PL, Lopez-Fernandez I, et al. The vascular Ca2+-sensing receptor regulates blood vessel tone and blood pressure. Am J Physiol Cell Physiol. 2016;310:C193–C204.
- Resnick LM, Gupta RK, Lewanczuk RZ, et al. Intracellular ions in salt-sensitive essential hypertension: possible role of calcium-regulating hormones. Contrib Nephrol. 1991;90:88–93.
- Williams B, Mancia G, Spiering W, et al. 2018 Practice guidelines for the management of arterial hypertension of the European Society of Cardiology and the European Society of Hypertension. Blood Press. 2018;27:314–340.
- Katz A, Nambi SS, Mather K, et al. Quantitative Insulin Sensitivity Check Index: a simple, accurate method for assessing insulin sensitivity in humans. J Clin Endocrinol Metab. 2000;85:2402–2410.
- Inker LA, Schmid CH, Tighiouart H, et al. Estimating glomerular filtration rate from serum creatinine and cystatin C. N Engl J Med. 2012;367:20–29.
- Chen CH, Nevo E, Fetics B, et al. Estimation of central aortic pressure waveform by mathematical transformation of radial tonometry pressure. Validation of generalized transfer function. Circulation. 1997;95:1827–1836.
- Kööbi T, Kaukinen S, Turjanmaa VM, et al. Whole-body impedance cardiography in the measurement of cardiac output. Crit Care Med. 1997;25:779–785.
- Albert SN. Blood volume and extracellular fluid volume. 2nd ed. Springfield (IL): CC Thomas; 1971.
- Nadler SB, Hidalgo JU, Bloch T. Prediction of blood volume in normal human adults. Surgery. 1962;51:224–232.
- Tishchenko MI. [Measurement of the stroke blood volume by an integral rheogram of the human body]. Fiziol Zh SSSR Im I M Sechenova. 1973;59:1216–1224.
- Koskela JK, Tahvanainen A, Haring A, et al. Association of resting heart rate with cardiovascular function: a cross-sectional study in 522 Finnish subjects. BMC Cardiovasc Disord. 2013;13:102–112.
- Kööbi T, Kaukinen S, Ahola T, et al. Non-invasive measurement of cardiac output: whole-body impedance cardiography in simultaneous comparison with thermodilution and direct oxygen Fick methods. Intensive Care Med. 1997;23:1132–1137.
- Kööbi T, Kähönen M, Iivainen T, et al. Simultaneous non-invasive assessment of arterial stiffness and haemodynamics – a validation study. Clin Physiol Funct Imaging. 2003;23:31–36.
- Wilenius M, Tikkakoski AJ, Tahvanainen AM, et al. Central wave reflection is associated with peripheral arterial resistance in addition to arterial stiffness in subjects without antihypertensive medication. BMC Cardiovasc Disord. 2016;16:131–141.
- Kööbi T, Kähönen M, Koskinen M, et al. Comparison of bioimpedance and radioisotope methods in the estimation of extracellular water volume before and after coronary artery bypass grafting operation. Clin Physiol. 2000;20:283–291.
- Tahvanainen A, Koskela J, Tikkakoski A, et al. Analysis of cardiovascular responses to passive head‐up tilt using continuous pulse wave analysis and impedance cardiography. Scand J Clin Lab Invest. 2009;69:128–137.
- Tikkakoski AJ, Tahvanainen AM, Leskinen MH, et al. Hemodynamic alterations in hypertensive patients at rest and during passive head-up tilt. J Hypertens. 2013;31:906–915.
- Task Force of the European Society of Cardiology and the North American Society of Pacing and Electrophysiology. Heart rate variability: standards of measurement, physiological interpretation and clinical use. Circulation. 1996;93:1043–1065.
- Working group appointed by the Finnish Medical Society Duodecim and the Finnish Society of Addiction Medicine. Treatment of alcohol abuse. Current Care Guideline [Internet]. The Finnish Medical Society Duodecim; 2015. Available from: http://www.kaypahoito.fi
- Vasan RS, Larson MG, Leip EP, et al. Impact of high-normal blood pressure on the risk of cardiovascular disease. N Engl J Med. 2001;345:1291–1297.
- Kshirsagar AV, Carpenter M, Bang H, et al. Blood pressure usually considered normal is associated with an elevated risk of cardiovascular disease. Am J Med. 2006;119:133–141.
- Schutte R, Huisman HW, Schutte AE, et al. Serum calcium revisited: associations with 24-h ambulatory blood pressure and cardiovascular reactivity in Africans. Hypertens Res. 2010;33:688–694.
- Aoki K, Miyagawa K. Correlation of increased serum calcium with elevated blood pressure and vascular resistance during calcium infusion in normotensive man. J Hypertens. 1990;8:579–583.
- Ohanian J, Gatfield KM, Ward DT, et al. Evidence for a functional calcium-sensing receptor that modulates myogenic tone in rat subcutaneous small arteries. Am J Physiol Heart Circ Physiol. 2005;288:H1756–H1762.
- Nilsson I-L, Rastad J, Johansson K, et al. Endothelial vasodilatory function and blood pressure response to local and systemic hypercalcemia. Surgery. 2001;130:986–990.
- Segers P, Rietzschel ER, De Buyzere ML, et al. Noninvasive (input) impedance, pulse wave velocity, and wave reflection in healthy middle-aged men and women. Hypertension. 2007;49:1248–1255.
- Mateus-Hamdan L, Beauchet O, Rolland Y, et al. Association of calcium concentration with pulse pressure in older women: data from a large population-based multicentric study. J Nutr Health Aging. 2014;18:323–329.
- Pagani M, Lombardi F, Guzzetti S, et al. Power spectral analysis of heart rate and arterial pressure variabilities as a marker of sympatho-vagal interaction in man and conscious dog. Circ Res. 1986;59:178–193.
- Parati G, Saul JP, Di Rienzo M, et al. Spectral analysis of blood pressure and heart rate variability in evaluating cardiovascular regulation: a critical appraisal. Hypertension. 1995;25:1276–1286.
- Malliani A, Pagani M, Lombardi F, et al. Cardiovascular neural regulation explored in the frequency domain. Circulation. 1991;84:482–492.
- Delacroix S, Chokka RG. Hypertension: pathophysiology and treatment. J Neurol Neurophysiol. 2014;05:1–8.
- Akselrod S, Gordon D, Ubel F, et al. Power spectrum analysis of heart rate fluctuation: a quantitative probe of beat-to-beat cardiovascular control. Science. 1981;213:220–222.
- Moore EW. Ionized calcium in normal serum, ultrafiltrates, and whole blood determined by ion-exchange electrodes. J Clin Invest. 1970;49:318–334.
- Baird GS. Ionized calcium. Clin Chim Acta. 2011;412:696–701.
- Ladenson JH, Lewis JW, Boyd JC. Failure of total calcium corrected for protein, albumin, and pH to correctly assess free calcium status. J Clin Endocrinol Metab. 1978;46:986–993.
- Ridefelt P, Helmersson-Karlqvist J. Albumin adjustment of total calcium does not improve the estimation of calcium status. Scand J Clin Lab Invest. 2017;77:442–447.
- Lian IA, Åsberg A. Should total calcium be adjusted for albumin? A retrospective observational study of laboratory data from central Norway. BMJ Open. 2018;8:e017703.
- Roman MJ, Devereux RB, Kizer JR, et al. Central pressure more strongly relates to vascular disease and outcome than does brachial pressure: the Strong Heart Study. Hypertension. 2007;50:197–203.
- Kollias A, Lagou S, Zeniodi ME, et al. Association of central versus brachial blood pressure with target-organ damage: systematic review and meta-analysis. Hypertension. 2016;67:183–190.