
Abstract
Purpose: Most guidelines for treatment of hypertension in the setting of diabetes recommend a blood pressure (BP) target of <130/80 mmHg. However, uncertainty exists about the extent, effectiveness and safety of lowering BP in diabetics. To expand the evidence on this issue, we analysed data from the Randomised Olmesartan and Diabetes MicroAlbuminuria Prevention (ROADMAP) study population.
Material: Substudy with blood pressure readings.
Methods: The response after initiation of therapy and adequacy of BP control across patients with different BP levels at baseline were analysed.
Results: BP at randomisation was 136.2(15.3)/80.6(9.5) [mean (SD)] mmHg with a range of 87–213/37–123 mmHg. At 1 year, mean BP was 127 (11.9)/75 (8.1) mmHg and the overall control rate (<130/80 mmHg) exceeded 61% in this population. The mean reductions in systolic [−9.4 (15.4) mmHg] and diastolic BP [−5.4 (9.5) mmHg] were highly dependent on the BP stage at Visit 1. At 1 year, treatment decreased the prevalence of patients with baseline BP levels of >160/100 from 9 to 2%[[mean BP change −31 (15.7)/ −14 (9.8) mmHg]] and of 140–159/90–99 mmHg from 32 to 11% [[mean BP change −16(12.7)/ −8.9 (8.7) mmHg]], with corresponding increases in the prevalence of patients with baseline BP levels of 120–139/80–99 from 48 to 65% [[mean BP change −4.1 (10.6)/ −3.1 (7.8) mmHg]]and of <120/80 from 11 to 22% [[mean BP change +5.9 (11.8)/+2.5 (8.6) mmHg]]. These effects did not change significantly thereafter and were maintained throughout follow-up.
Conclusion: Blood pressure control is feasible in patients with diabetes without nephropathy, independent of baseline BP values. Asymmetric BP-lowering in the first year after starting therapy represents a true antihypertensive effect with sustainable shifts in BP severity.
1. Introduction
The importance of elevated blood pressure in the development and progression of cardiovascular disease and the need for lifelong treatment to reduce this risk, dictates the criteria for choosing a specific antihypertensive agent and defining a treatment target. Lowering of blood pressure (BP) is directly and proportionally associated with considerable reductions in the risk of major cardiovascular events. These effects have been constantly observed in all age groups and are even more pronounced in patients with severe hypertension or significant vascular co-morbidities [Citation1–3].
Moreover, early pharmaceutical intervention and prompt attainment of blood pressure goals are equally important determinants of outcome [Citation4,Citation5]. Another important issue, especially in patients with diabetes mellitus, is the impact of blood pressure variability on outcomes, which is not captured by mean BP levels [Citation6–9].
Reporting only mean BP changes between treatment groups at the beginning and the end of a hypertension study can therefore obscure response patterns and bias the analysis of population benefits with antihypertensive therapy. We sought to assess restrictions related to these confounding factors in the ROADMAP trial. The effect of the treatment protocol on BP was evaluated, taking into consideration the ability of the study`s design to record BP control rates across an extremely wide spectrum of baseline BP values. We tested whether sub-grouping defined by baseline BP stages provides useful additional insights into response patterns.
2. Material and methods
2.1. Study design
ROADMAP (Funded by Daiichi Sankyo; ClinicalTrials.gov number, NCT00185159) was a randomised, double-blind, placebo-controlled, parallel-group, multicenter Phase III study, conducted at 262 collaborating centres in 19 European countries. It took place before 2011 and was designed to test whether an angiotensin receptor blocker (ARB, olmesartan medoxomil 40 mg once daily) is superior to placebo in preventing the onset of microalbuminuria in a diabetic population at relatively low cardiovascular risk. Strict BP control (target BP <130/80 mmHg) was mandated for all subjects and either olmesartan or placebo was added in a double-blinded fashion to standard antihypertensive drugs, which the investigator titrated as needed. The study protocol, which complies with the principles of Good Clinical Practice and the Declaration of Helsinki, was approved by the ethics committee of each participating centre. Written informed consent was required from each patient before enrolment in the trial [Citation10].
2.2. Inclusion and exclusion criteria
At the end of the screening period 4449 eligible subjects with type 2 diabetes and confirmed normoalbuminuria (≤35 mg/g in women or ≤25 mg/g in men) , were randomised at baseline visit 1 in a 1:1 ratio to receive double-blind treatment with 40 mg olmesartan medoxomil once daily or placebo. The median duration of follow-up was 3.2 years. All randomised subjects had at least one additional cardiovascular risk factor ((dyslipidemia defined as total cholesterol >200 mg/dL (5.2 mmol/L), concurrent statin treatment, HDL <40 mg/L, or triglycerides between 150 and <400 mg/dL; hypertension defined as SBP ≥130 mmHg and/or DBP ≥80 mmHg or concurrent antihypertensive medication; obesity, defined as BMI ≥28 kg/m2; high waist circumference (>102 cm in men, >88 cm in women); or history of smoking >5 cigarettes/day)). The prevalence of cardiovascular disease was relatively low in the whole population without differences between the treatment arms. Subjects were excluded for known renal disease, recent cardiovascular events, severe hypertension (SBP >200 or DBP >110 mmHg) or recent (<6 month) treatment with ARBs or ACEIs. These analyses of BP responses are focussed on subjects with available datasets at baseline and during follow-up. The cardiovascular disease outcomes of the study have been published elsewhere [Citation11,Citation12].
2.3. Bp measurements
Office blood pressure measurements were performed at 6-month-intervals as trough readings at each visit (between 6–11 am) according to stringent protocol. Values reported are means of 3 consecutive readings obtained in the sitting position using standardised oscillometric OMRON HEM-907 blood pressure monitors. The target blood pressure was defined as 130/80 mmHg. For the present analysis, mean, median and quartiles of BP at each of the yearly study visits were stratified by initial BP category, treatment group and BP responses.
Considering drawbacks, inconsistencies, restrictions, modifications and updates of international guidelines[Citation13–15], patients were classified according to their BP levels at randomisation, as follows: Category I (C-I) if systolic BP (SBP) and diastolic BP (DBP) were <120/80, Category II, (C-2) if SBP and DBP were 120–130/80–89 mmHg, Category III (C-III), if SBP was 140–160 mmHg OR DBP 90–99 mmHg and Category IV (C-IV), if SBP was >160 OR DBP >100 mmHg. Antihypertensive drugs of all classes were prescribed over the course of the study at the discretion of the investigator but conform to the protocol and the international guidelines: Beta blockers (BB), Calcium Channel Blockers (CCB), Diuretics, Central agonists and Vasodilators. ACE inhibitors (ACEIs) and angiotensin blockers (ARBs) were prohibited.
2.4. Statistical analysis
The primary ROADMAP endpoint was occurrence of moderately increased albuminuria (old terminology microalbuminuria) in 2 consecutive analyses. Secondary endpoints included the cumulative incidence of cardiovascular and renal disease mortality and morbidity. Statistical analyses were performed using SAS software version 9.1 (SAS Institute Inc, Cary, NC). The descriptive statistics for metric data as N, mean, SD (standard deviation), min, lower quartile, median, upper quartile and max were calculated as well as the descriptive statistics for nominal data as absolute and percentage frequencies were calculated. Univariate and multivariate analysis to adjust for confounding or other risk factors was performed.
3. Results
Between randomisation (n = 4449) and the 1-year visit (n = 4013), 436 individuals dropped out of the study, largely because of withdrawal of consent. Baseline demographics are shown in . Details of data on BP categories at baseline and respective BP responses at 1 year are presented in Supplementary Table 1.
Table 1. Baseline characteristics of the study subjects at the screening and at the 1-year visit.
demonstrates the histograms of systolic and diastolic BP at visit 1 and at 1 year for the 4013 subjects who completed one full year of therapy and Supplementary Figures 1 and 2 for patients with follow-up data throughout the study. The slopes according to BP category observed in the first year after antihypertensive therapy did not change during the next years of the study ( and Supplementary Figures 3 and 4). demonstrates the data for the BP stages during follow-up and summarises the absolute number and classes of the antihypertensive drugs used.
Figure 1. BP frequency distribution for systolic BP (A) and diastolic BP (B) at baseline and 1 year of follow-up. Actual (bars) and modelled (lines) blood pressure (BP) frequency distributions are shown. Upper panels represent distributions at randomisation (Visit 1) and lower panels after 1-year. BP stages are indicated by dotted lines and shading. Cell widths are 2 mmHg.
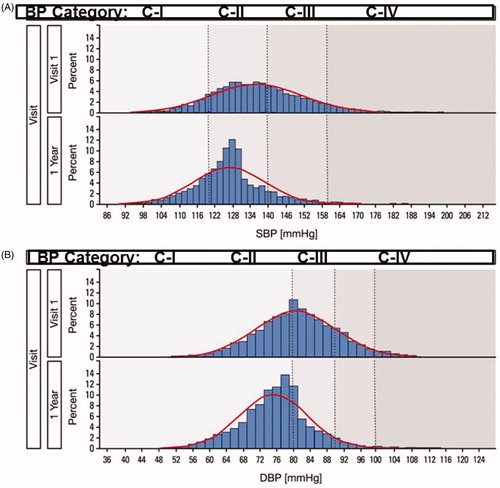
Figure 2. Effect of pre-treatment BP on systolic (A) and diastolic BP response on the first year of therapy.
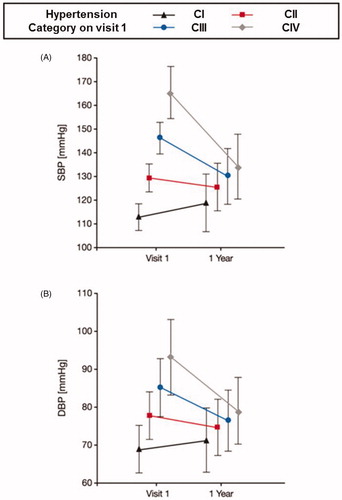
Table 2. Change in the prevalence of BP stages between randomisation and follow-up visits in the olmesartan and placebo groups (analysis restricted to patients with documented BP measurements).
Table 3. Antihypertensive therapy at baseline and during follow-up in the olmesartan and placebo groups (analysis restricted to patients with documented medications).
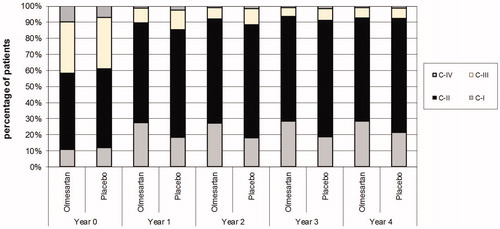
The majority (above 70%) of patients had a BP <130/80 mmHg at month 48 [Citation10]. The percentage of participants reaching the dual target of systolic BP <130 and diastolic BP <80 mmHg increased from 28% at visit 1 to 61% at one year and the mean BP declined by 9.4/5.4 mmHg, from about 136/81 to 127/75 mmHg within one year. Across the population at 1 year, treatment decreased the prevalence of C-IV from 9 to 2% and C-III from 32 to 11%, while increasing the prevalence of C-II from 48 to 65% and C-I from 11 to 22%. The mean number of background (non-olmesartan) antihypertensive medications taken by the participants was about 1.5 at baseline and about 2.0 at one year. Recalling that half of the subjects were randomised to olmesartan, the mean number of all antihypertensive medications given at one year was therefore about 2.5. This overall increase of one antihypertensive agent per subject in the population accounted for the decrease in mean pressure of 9.4/5.4 mmHg in the first year after randomisation. The initial responses in and the further evolution of BP levels across the subgroups did not change after year 1 and were maintained or improved further during follow-up (). The mean number of all antihypertensive medications per patient increased from 2.5 at year 1 to 3 at year 4. There were no significant differences in the antihypertensive drug classes within and between the treatment arms over the course of the study, except for beta blockers, the use of which increased progressively during follow-up. Though explicitly prohibited in the study protocol, a negligible amount of background use of ACEIs/ARBs was detected in the first years of the study. However, the percentage of patients receiving these drugs increased considerably in both groups from year 3 to year 4. This was probably due to the inclusion in the analysis of BP data from patients being on the edge or within the transition period from the termination of the ROADMAP and the beginning of its observational follow-up (OFU) study. In OFU the use of Renin Angiotensin System Blockers (RASB) was allowed in the former placebo arm of ROADMAP and was utilised in over 60% of participating patients. The distribution of the other antihypertensive drugs/drug classes was comparable in both groups of the OFU study [Citation11].
Figure 3. Classification of patients according to BP categories and treatment group at baseline visit and during follow-up.
4. Discussion
Present data demonstrate that stratification by BP stages provides new insights into issues related to BP control in a heterogenous population. The striking degree of “advanced” BP control is higher than that reported in other studies, due in large part to the inclusion of patients with lower BP level in our cohort. Nevertheless, excellent BP control at 1-year and thereafter was achieved in participants with higher baseline BP levels (categories III & IV). These results clearly indicate that outstanding BP control is possible with protocol-based therapy in a general population with type 2 diabetes.
Another important aspect was the effect of a wide range of pre-treatment BP values on therapeutic responses. There was an exceptionally strong correlation between pre-treatment BP and the response to therapy, with a mean BP response at one year of about 16/9 mmHg in C-III and 31/14 mmHg in C-IV. It has been previously demonstrated that the amount of BP lowering for any given antihypertensive drug is proportional to the pre-treatment BP level in the population being studied; the more extreme the initial BP the greater the decline. It is also of interest that individuals with the lowest BP levels at baseline (C-I) demonstrated an increase in blood pressure of nearly 6/3 mmHg at one year. This is unlikely an aging effect and does not represent withdrawal of therapy, so the most likely explanation is that it represents “background noise” or regression to the measurement mean [Citation16] or perhaps is equivalent in magnitude to a placebo effect. If 6/3 mmHg is subtracted from the response signals of the other groups, the resulting net changes of BP after one year would then be about 10/6 and 25/11 mmHg in C-III and C-IV, respectively. There is always a potential for regression to the mean effects in randomised controlled trials because of the large intra-individual variations in BP. This can inadvertently lead to incorrect interpretation of the primary findings with broad implications across trials of medications or devices [Citation16–20]. In our analysis, there was an impressive blood pressure reduction in the first year, whereas changes where then maintained. Moreover, a further improvement in the distribution of the clinically relevant categories II and IV was achieved. Therefore, we believe that though blood pressure variability and regression to the mean effects are reflected in the analysis of the one-year data, their impact on the observed BP control rates over the course of the study were negligible and not significant. Furthermore, the randomisation of participants in the primary study minimises the effects of regression to the mean on any differences between treatment arms.
The morphology of the visualised blood pressure values changed from a Gaussian distribution at baseline to a distinctly leftward-skewed distribution at one year and retained its shape during follow-up. This shape change may be highly relevant to the global relative cardiovascular disease risk estimation for the population and is different from the results that would occur if the normal BP distribution moved leftward and retained its shape, as has been postulated previously in population risk-reduction estimates [Citation21,Citation22]. The effects of blood pressure levels on cardiovascular outcomes in ROADMAP have been published elsewhere [Citation10–12]. In summary, the cardiovascular mortality was higher in the olmesartan group, probably due to excessive blood pressure reductions in patients with pre-existing coronary heart disease, but there was no difference in patients without coronary artery disease at baseline. On the contrary, in the subgroup without coronary heart disease at baseline, a significant reduction in cardiovascular morbidity was observed in the olmesartan treatment arm for the total population (1.1% vs 2.3%, HR:0.48, p < .01) and for populations stratified by baseline and achieved blood pressure levels as well.
Our data add insights into the methodological approaches used for the interpretation of BP outcome data in randomised studies; the results can differ significantly or be misleading if only BP at the baseline visit or BP over time, or both-BP at baseline and BP as a time updated exposure variable – are used for the analysis [Citation10,Citation12]. Beyond that, the different slopes of BP control across the initial BP categories in the first year of ROADMAP may implicate a disproportionately greater or lower probability in patients belonging to the higher BP categories to reach the BP target or to develop a clinical endpoint respectively. Regarding BP control, we corroborated the durability and stability of the different BP responses between the initially different BP categories.
The major strength of our report relies on the ROADMAP treatment protocol itself, which used consistent blood pressure monitoring equipment over time, applied standardised office measurements and accounted for changes in drugs during follow-up. Furthermore, the credibility, reliability and clinical significance of the measurements´ results of office BP were ascertained by 24-hour ABPM recordings, done in nearly every fourth patient at screening and last follow-up visit. In those patients, the magnitude of changes was smaller for 24 h ABPM but the pattern of 24 h ABPM and office sitting systolic and diastolic blood pressure changes was comparable (Supplementary Figures 5 and 6).
Limitations of this study need to be acknowledged. First, blood pressure variability was not directly assessed according to a specific methodological approach; therefore its possible specific quantifiable effects are not proven and remain more or less only speculative. But although not concurrently recorded, the coverage of “some” degree of blood pressure variability cannot be entirely excluded in our report, if we consider the slope of BP changes in the first year after randomisation and the absence of uniformly accepted and validated metrics of BP variability [Citation7,Citation23,Citation24]. Secondly, an in-depth analysis of the specific impact of the effects of the asymmetrical BP reduction on cardiovascular outcomes was not performed. The cardiovascular benefits of BP reduction were rather estimated from sub- and sensitivity analyses of the whole study population and subpopulations stratified by coronary artery disease at baseline or baseline and achieved reductions in BP levels [Citation10,Citation12]. Therefore, the differential effects and the long term implications of the observed asymmetrical BP lowering changes on cardiovascular risk reduction can only be estimated at a population level by means of existing cardiovascular risk calculators [Citation25]. Thirdly, it should be remembered that ROADMAP was not a primary cardiovascular disease study, since it was underpowered to detect cardiovascular events [Citation10,Citation13,Citation26,Citation27] and had a short observation period. Nevertheless, BP outcome data of ROADMAP were incorporated in the determination and specification of treatment targets in patients at high cardiovascular risk [Citation25,Citation28–30]. Fourthly, since ROADMAP included only normoalbuminuric patients, we can speculate that the blood pressure control may be more challenging in diabetic patients with more advanced or established nephropathy. Beyond that, newer antidiabetic drugs that have been introduced in the market the last years, such as SGLT-2 inhibitors have been shown to reduce BP and renal and cardiovascular complications in diabetic patients, with considerable improvements in their survival [Citation31,Citation32]. Lastly, it is important, to know if the blood pressure response results were attributable to regression to the mean or were influenced by the Wilders principle [Citation33,Citation34]. Our results rather reject the last hypothesis, since the BP responses in the first year remained stable, did not change during follow-up and there was a BP increase in the lower categories.
In conclusion, BP recordings within the ROADMAP study clearly show that protocol-based therapy can achieve prompt, excellent, and sustainable BP control in a population of relative healthy diabetic subjects with a wide range of BP levels at baseline. Our findings implicate an individual, not uniform response to BP lowering drugs and thus cardiovascular risk reduction, which can differ considerably in comparison to the cardiovascular protection conferred when only considering differences in mean BP levels.
Suppl_figs.zip
Download Zip (652.1 KB)Supplemental_Data-Revision.docx
Download MS Word (475 KB)Supplementary-Figures_1-6_.docx
Download MS Word (464.1 KB)Supplementary_Table_1.docx
Download MS Word (19.5 KB)Disclosure statement
CC, FSG, AK and PRM have no conflicts of interest to declare. Prof Haller has received lecture fees, advisory board Consultant fees and research funds from Boehringer Ingelheim Astra Zeneca, Alexion Pharmaceuticals, Inc, and Daiichi Sankyo. Prof. Haller was the principal investigator of the ROADMAP study and is since 2019 President of the MDI Biological Laboratory in Maine, USA. Prof Menne receives lecture and/or advisory fees from Alexion Pharmaceuticals, Inc, Astra Zeneca, Berlin-Chemie, Daiichi Sankyo, Boehringer Ingelheim and Novartis.
Correction Statement
This article has been republished with minor changes. These changes do not impact the academic content of the article.
References
- Lewington S, Prospective Studies Collaboration, Clarke R, Qizilbash N, et al. Age-specific relevance of usual blood pressure to vascular mortality: a meta-analysis of individual data for one million adults in 61 prospective studies. Lancet. 2002;360(9349):1903–1913.
- Turnbull F, Blood Pressure Lowering Treatment Trialists' Collaboration. Effects of different blood-pressure-lowering regimens on major cardiovascular events: results of prospectively-designed overviews of randomised trials. Lancet. 2003;362(9395):1527–1535.
- Turnbull F, Neal B, Algert C, Blood Pressure Lowering Treatment Trialists' Collaboration, et al. Effects of different blood pressure-lowering regimens on major cardiovascular events in individuals with and without diabetes mellitus: results of prospectively designed overviews of randomized trials. Arch Intern Med. 2005;165(12):1410–1419.
- Weber MA, Julius S, Kjeldsen SE, et al. Blood pressure dependent and independent effects of antihypertensive treatment on clinical events in the VALUE Trial. Lancet. 2004;363(9426):2049–2051.
- Julius S, Kjeldsen SE, Weber M, et al. Outcomes in hypertensive patients at high cardiovascular risk treated with regimens based on valsartan or amlodipine: the VALUE randomised trial. Lancet. 2004;363(9426):2022–2031.
- Rothwell PM, Howard SC, Dolan E, et al. Effects of beta blockers and calcium-channel blockers on within-individual variability in blood pressure and risk of stroke. Lancet Neurol. 2010;9(5):469–480.
- Webb AJ, Fischer U, Mehta Z, et al. Effects of antihypertensive-drug class on interindividual variation in blood pressure and risk of stroke: a systematic review and meta-analysis. Lancet. 2010;375(9718):906–915.
- Hata J, Arima H, Rothwell PM, et al. Effects of visit-to-visit variability in systolic blood pressure on macrovascular and microvascular complications in patients with type 2 diabetes mellitus: the ADVANCE trial. Circulation. 2013;128(12):1325–1334.
- Stevens SL, Wood S, Koshiaris C, et al. Blood pressure variability and cardiovascular disease: systematic review and meta-analysis. BMJ. 2016;354:i4098
- Haller H, Ito S, Izzo JL, Jr, et al. Olmesartan for the delay or prevention of microalbuminuria in type 2 diabetes. N Engl J Med. 2011;364(10):907–917.
- Menne J, Ritz E, Ruilope LM, et al. The Randomized Olmesartan and Diabetes Microalbuminuria Prevention (ROADMAP) observational follow-up study: benefits of RAS blockade with olmesartan treatment are sustained after study discontinuation. J Am Heart Assoc. 2014;3(2):e000810
- Menne J, Izzo JL, Jr, Ito S, et al. Prevention of microalbuminuria in patients with type 2 diabetes and hypertension. J Hypertens. 2012;30:811–818; discussion 818.
- Chatzikyrkou C, Menne J. Update on the ROADMAP clinical trial report: olmesartan for the prevention or delay of microalbuminuria development in type 2 diabetes. Expert Rev Cardiovasc Ther. 2012;10(9):1087–1092.
- Mancia G, Grassi G. Blood pressure targets in type 2 diabetes. Evidence against or in favour of an aggressive approach. Diabetologia. 2018;61(3):517–525.
- Passarella P, Kiseleva TA, Valeeva FV, et al. Hypertension Management in Diabetes: 2018. Diabetes Spectr. 2018;31(3):218–224.
- Barnett AG, van der Pols JC, Dobson AJ. Regression to the mean: what it is and how to deal with it. Int J Epidemiol. 2004;34(1):215–220.
- Gill JS, Zezulka AV, Beevers DG, et al. Relation between initial blood pressure and its fall with treatment. Lancet. 1985;325(8428):567–569.
- Bhatt DL, Kandzari DE, O'Neill WW, et al. A controlled trial of renal denervation for resistant hypertension. N Engl J Med. 2014;370(15):1393–1401.
- Pocock SJ, Bakris G, Bhatt DL, et al. Regression to the mean in SYMPLICITY HTN-3: implications for design and reporting of future trials. J Am Coll Cardiol. 2016;68(18):2016–2025.
- Howard JP, Shun-Shin MJ, Hartley A, et al. Quantifying the 3 biases that lead to unintentional overestimation of the blood pressure-lowering effect of renal denervation. Circ Cardiovasc Qual Outcomes. 2016;9(1):14–22.
- Chobanian AV, Bakris GL, Black HR, the National High Blood Pressure Education Program Coordinating Committee, et al. Seventh report of the Joint National Committee on Prevention, Detection, Evaluation, and Treatment of High Blood Pressure. Hypertension. 2003;42(6):1206–1252.
- German CA, McEvoy JW, Blaha MJ, et al. Implications of the 2017 American College of Cardiology/American Heart Association Hypertension Guideline in a Modern Primary Prevention Multi-Ethnic Prospective Cohort (Multi-Ethnic Study of Atherosclerosis). Am J Cardiol. 2019;123(7):1076–1082.
- Hastie CE, Jeemon P, Coleman H, et al. Long-term and ultra long-term blood pressure variability during follow-up and mortality in 14,522 patients with hypertension. Hypertension. 2013;62(4):698–705.
- Dolan E, O’Brien E. Is it daily, monthly, or yearly blood pressure variability that enhances cardiovascular risk? Curr Cardiol Rep. 2015;17(11):93.
- Williams B, Mancia G, Spiering W, et al. ESC/ESH Guidelines for the management of arterial hypertension. Blood Pressure. 2018;27(6):314–340.
- Griffin SJ, Borch-Johnsen K, Davies MJ, et al. Effect of early inte2nsive multifactorial therapy on 5-year cardiovascular outcomes in individuals with type 2 diabetes detected by screening (ADDITION-Europe): a cluster-randomised trial. Lancet. 2011;378(9786):156–167.
- Preiss D, Sattar N, McMurray JJ. A systematic review of event rates in clinical trials in diabetes mellitus: the importance of quantifying baseline cardiovascular disease history and proteinuria and implications for clinical trial design. Am Heart J. 2011;161(1):210–219.e1.
- Bangalore S, Kumar S, Lobach I, et al. Blood pressure targets in subjects with type 2 diabetes mellitus/impaired fasting glucose: observations from traditional and bayesian random-effects meta-analyses of randomized trials. Circulation. 2011;123(24):2799–2810. 9 p following 810.
- Chatzikyrkou C, Haller H, Menne J. Therapeutic targets in arterial hypertension and diabetes mellitus. Can medical prevention be harmful? Internist. 2012;53(7):882–892.
- Emdin CA, Rahimi K, Neal B, et al. Blood pressure lowering in type 2 diabetes: a systematic review and meta-analysis. JAMA. 2015;313(6):603–615.
- Kario K, Okada K, Kato M, et al. 24-Hour blood pressure-lowering effect of an SGLT-2 inhibitor in patients with diabetes and uncontrolled nocturnal hypertension: results from the randomized, placebo-controlled SACRA study. Circulation. 2019;139(18):2089–2097.
- Zelniker TA, Wiviott SD, Raz I, et al. SGLT2 inhibitors for primary and secondary prevention of cardiovascular and renal outcomes in type 2 diabetes: a systematic review and meta-analysis of cardiovascular outcome trials. Lancet. 2019;393(10166):31–39.
- Mancia G, Verdecchia P. Clinical value of ambulatory blood pressure: evidence and limits. Circ Res. 2015;116(6):1034–1045.
- Messerli FH, Bangalore S, Schmieder RE. Wilder’s principle: pre-treatment value determines post-treatment response. Eur Heart J. 2015;36(9):576–579.