
Abstract
Purpose: We aimed to identify sex-specific factors associated with increase in blood pressure (BP) and incident hypertension in early midlife.
Materials and methods: 2,008 women and 1,610 men aged 40-43 years were followed for six years in the Hordaland Health Study. Participants taking antihypertensive medication at baseline were excluded. High-normal BP was defined as baseline BP 130-139/85-89 mmHg, and incident hypertension as BP≥140/90 mmHg or use of antihypertensive medication at follow-up.
Results: During follow-up, an increase in systolic (SBP) and diastolic (DBP) BP was observed in 54% and 30% of women vs. 44% and 41% of men, respectively (both p<0.001). In both sexes higher baseline body mass index (BMI) and increases in BMI and serum lipids were associated with increases in SBP and DBP during follow-up (all p<0.05). Incident hypertension was more common in men (14 vs.11%, p<0.01), and predicted by higher BMI and high-normal BP at baseline in both sexes, and by higher serum triglyceride level in women (all p<0.01).
Conclusion: In the Hordaland Health Study, BP development differed between women and men in early midlife. The main factors associated with BP increase in both sexes were higher BMI, weight gain and increases in serum lipids.
Introduction
The World Health Organization has defined hypertension as the leading risk factor for cardiovascular (CV) disease (CVD), and currently, 1 in 4 men and 1 in 5 women have hypertension worldwide [Citation1]. The global obesity epidemic has been identified as a major driver for the increasing incidence and prevalence of hypertension [Citation2,Citation3]. As demonstrated both in the Framingham Study and the Strong Heart Study, the main risk factors for incident hypertension in 50-year-old subjects were obesity and diabetes [Citation2,Citation3]. However, sex-specific results were not presented. In contrast, in the Tromsø Study, high body mass index (BMI) was a more important predictor of blood pressure (BP) increase in women than in men [Citation4].
Although the prevalence of hypertension rises with increasing age in both sexes, there is a striking difference in BP changes between women and men [Citation5,Citation6]. While the rate of increase in BP attenuates in men after 40 years, the rates of increase in both systolic BP (SBP) and diastolic BP (DBP) remain constant with ageing in women [Citation6]. As a consequence, hypertension is more common in men than in women before the age of 40 years, while after the age of 60 years more women have hypertension [Citation5,Citation7]. Even in the very elderly above 90 years of age, a larger proportion of women than men have hypertension [Citation8]. Thus, there is a need for further sex-specific knowledge on factors associated with BP increase and incident hypertension, in particular in early midlife. The aim of the current study was to identify sex-specific factors associated with increases in SBP, DBP and incident hypertension in women and men in their forties, using data from the community-based Hordaland Health study in Western Norway.
Methods
Study population
The Hordaland Health study is a community-based study in Hordaland County in Western Norway, initiated as a collaboration between the National Health Screening Service, the University of Bergen and local health services in 1992 (https://husk-en.w.uib.no/) [Citation9,Citation10]. Eligible subjects were identified from the National Population Registry based on year of birth and site of residence. The current study focused on the 2050 women and 1650 men, born 1950–1951 who had participated at both the 1992–1993 (baseline) and 1997–1999 (follow-up) surveys [Citation9]. Participants who lacked data on BP (n = 6), BMI (n = 7), serum lipids (n = 3), salt intake (n = 2) and level of education (n = 14) were excluded, as well as participants that used antihypertensive treatment at baseline (n = 50), leaving 2,008 women and 1,610 men eligible for the present analysis. For the analysis of incident hypertension, 254 women and 441 men who had SBP ≥140 mmHg and/or DBP ≥90 mmHg at baseline, were excluded. All participants provided written informed consent. The present study was performed according to the declaration of Helsinki, and the study protocol was approved by the Regional Committee for Medical and Health Research Ethics (2017/294).
Blood pressure measurement
Heart rate, SBP and DBP were measured by trained health workers after at least 2 min of rest in the sitting position using calibrated sphygmomanometers (Dinamap 845 XT or Dinamap 8100, Criticon, Tampa, FL) [Citation10]. Brachial BP was measured at the heart level on the right arm. The BP was measured in triplets with one-minute intervals during staff attendance, and the average of the two last measurements was taken as the clinic BP and used for the analyses. High-normal BP was defined as SBP 130–139 mmHg and/or DBP 85–89 mmHg in accordance with European guidelines [Citation11]. Hypertension was defined as BP ≥140/90 mmHg. Incident hypertension was defined as a reported use of antihypertensive medication or hypertension at the follow-up examination.
Other cardiovascular risk factors
Height and weight were measured without shoes, height to the nearest centimeter, and weight with light clothing to the nearest half-kilogram on a calibrated scale. BMI was calculated as weight in kg/height2. Overweight was defined as BMI 25.0–29.9 kg/m2 and obesity as BMI ≥30.0 kg/m2 [Citation12]. Information about medical history, CV risk factors including smoking, alcohol intake, use of extra table salt on food, education, menopausal status, contraceptive pills, hormone replacement therapy, antihypertensive medication and time since last meal was collected in self-reported questionnaires at both surveys. Smoking was defined as current daily smoking and education was classified as (1) primary education/lower secondary school, (2) upper secondary school and (3) higher education. Non-fasting blood samples were analyzed for serum triglycerides and total cholesterol.
Outcome
The following outcomes were assessed (1) change in SBP during follow up, (2) change in DBP during follow up and (3) incident hypertension, defined as recorded BP ≥140 mmHg systolic and/or 90 mmHg diastolic or reported use of antihypertensive medication at the follow-up examination.
Statistical analyses
Statistical analyses were done using STATA, version 15 (StataCorp LP, College Station, TX). Continuous variables are expressed as means and standard deviations (SD) or medians and interquartile ranges (IQR) and categorical variables as numbers and percentages. Comparisons between groups were done using the Student’s t-test or the Chi-square test. For non-normally distributed variables (serum triglycerides) comparison between groups was done by quantile regression. Factors associated with changes in SBP and DBP from baseline to the follow-up survey were identified in uni- and multivariable linear regression analyses. Results are reported as standardized β-coefficients and p-values. Factors associated with incident hypertension were identified using uni- and multivariable logistic regression analyses. Results are presented as odds ratios (OR), 95% confidence intervals (CI) and p-values. Cubic spline plots with multivariable adjustments were performed to visualize the association between continuous independent variables and changes in SBP or DBP. Non-linear associations detected in cubic spline plots were further tested in a linear spline plot. Linear spline plots with one knot (the point at which the linear slope changed) and multivariable adjustments were performed for the association between baseline BMI and change in SBP and DBP. The knot was placed based on a visual assessment of the cubic spline plot. All multivariable models were adjusted for baseline BP (SBP, DBP or presence of high-normal BP, respectively), BMI and education. Adjustment for time since last meal at baseline was done in models on serum triglycerides, while adjustment for time since last meal at baseline and follow-up was done in models on change in triglycerides. Adjustment for change in BMI was done in models on change in serum cholesterol and serum triglycerides. Additional adjustment for baseline serum cholesterol and triglycerides was done in models on change in serum cholesterol and triglycerides, respectively. Separate analyses were performed for women and men. Covariates of incident hypertension were explored also in the total study population. To test for interactions between explanatory variables and sex in the total study population, we compared a model with an interaction term with a model without an interaction term using the likelihood-ratio test. A two-tailed p-value of <0.05 was considered statistically significant.
Results
Baseline characteristics
At baseline, SBP and DBP were lower in women than in men, and high-normal BP and hypertension were both less prevalent in women (all p < 0.001) (). Compared to men, women also had a lower baseline BMI, serum total cholesterol and triglycerides, and lower prevalence of overweight (all p < 0.001) (). Obesity was rare, found in 5.0% in women and 5.2% in men (p = 0.81) (). Alcohol intake was lower in women than in men 1.8 vs. 4.1 units per week (p < 0.01). The use of contraceptive pills and hormone replacement therapy was reported by 48 (2.5%) and 57 (2.8%) women, respectively. Only 1.1% of women were postmenopausal at baseline.
Table 1. Characteristics of the study population at baseline and follow-up.
When tested by the likelihood-ratio test we found significant interactions between baseline SBP and DPB with sex and changes in SBP and DBP, respectively. Similarly, there were significant interactions between quartiles of serum triglycerides and change in serum cholesterol with sex in the model on incident hypertension.
Factors associated with BP development in women during follow-up
On average women had a significant increase in SBP and a decrease in average DBP during follow-up (all p < 0.001) (). An increase in SBP and DBP was seen in 54% and 30% of women, respectively.
Higher BMI was associated with a larger increase in SBP both in uni- and multivariable linear regression analysis (p < 0.001) (). A J-shaped relationship between baseline BMI and change in SBP was demonstrated in a cubic spline plot (). Using linear spline plot, a positive association between baseline BMI and increase in SBP was demonstrated in women with BMI >21 kg/m2 (β = 0.13, p < 0.001), while no significant association between baseline BMI and change in SBP was found in women with lower BMI (β = −0.04, p = 0.07). The baseline heart rate was positively associated with a change in SBP in multivariable linear regression analysis (p = 0.014) (). During follow-up, larger increases in BMI, serum cholesterol, and triglycerides were all associated with a larger increase in SBP (all p < 0.001) (). Adding the use of contraceptive pills and hormone replacement therapy to the multivariable model did not alter the positive association between increase in serum triglycerides and increase in SBP in women (β = 0.086, p < 0.001).
Figure 1. (a–d) Change in SBP and DBP over 6 years associated with baseline BMI in women and men in their forties. Median BMI at baseline is the reference point. The model is adjusted for baseline blood pressure and education. BMI: body mass index; SBP: systolic blood pressure; DBP: diastolic blood pressure
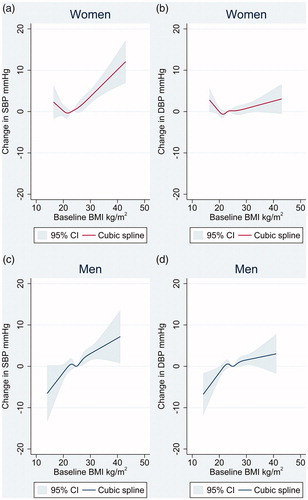
Table 2. Factors associated with change in systolic blood pressure over 6 years in midlife.
A J-shaped relationship was also found between baseline BMI and change in DBP (). In linear spline plot, baseline BMI was associated with an increase in DBP in women with BMI above 21 kg/m 2 (β = 0.060, p = 0.01), while no significant association was found in those with lower baseline BMI. Increases in BMI, serum cholesterol and triglycerides during follow-up were all associated with an increase in DBP (all p < 0.01) () (). Adding the use of contraceptive pills and hormone replacement therapy to the multivariable model did not alter the positive association between increase in serum triglycerides and increase in DBP in women (β = 0.071, 0.003).
Figure 2. (a–d) Change in SBP and DBP over 6 years in midlife associated with change in BMI in women and men in their forties. Median change in BMI is the reference point. The model is adjusted for baseline blood pressure, BMI and education. BMI: body mass index; SBP: systolic blood pressure; DBP: diastolic blood pressure
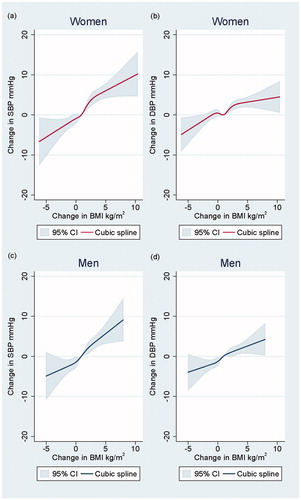
Table 3. Factors associated with change in diastolic blood pressure over 6 years in midlife.
Factors associated with BP development in men during follow-up
On average both SBP and DBP decreased from baseline to follow-up in men (both p < 0.001) (). However, an increase in SBP and DBP was seen in 44 and 41% of men, respectively. Thus, an increase in SBP was more common in women, while an increase in DBP was more common in men (both p < 0.001 between sexes).
Higher BMI, heart rate and serum cholesterol at baseline were identified as predictors of SBP increase in men in multivariable linear regression analyses (all p < 0.05) (). There was a close to the linear relationship between baseline BMI and change in SBP in men in the cubic spline plot (). Furthermore, increases in BMI, serum cholesterol, and triglycerides in men during follow-up were all associated with an increase in SBP (all p < 0.01) ().
There was a close to the linear relationship between baseline BMI and change in DBP in men (). Higher baseline BMI and larger increases in BMI, serum cholesterol and triglycerides during follow-up were all positively associated with an increase in DBP in men (all p < 0.01) () ().
Incident hypertension during follow-up
Among the 1754 women and 1169 men who were normotensive at baseline, a lower proportion of women than men developed incident hypertension during 6 years follow-up (185 [11%] vs. 161 [14%], respectively, p < 0.01). Among these, 51 (15%) subjects were classified as having incident hypertension based upon antihypertensive drug use alone. In a univariate analysis in the total study population, women were less prone to develop incident hypertension compared to men (OR 0.74, 95% CI: 0.59–0.93, p = 0.008). After multivariable adjustments for baseline high-normal BP, BMI and education, women had a comparable risk of incident hypertension to that observed in men (OR 1.20, 95% CI: 0.93–1.52, p = 0.17). If baseline high-normal BP was replaced by baseline SBP in this model, women had a higher risk of incident hypertension than men (OR 1.42, 95% CI: 1.11–1.82, p = 0.005).
Factors associated with incident hypertension in women
In women, higher BMI and high-normal BP at baseline predicted a higher incidence of hypertension (). In addition, increases in BMI, serum cholesterol and triglycerides during follow-up, were all associated with a higher risk for incident hypertension in multivariable logistic regression analysis (all p < 0.05) (). Women in the highest quartile of serum triglycerides had a higher risk of incident hypertension compared to women in the lowest quartile (p = 0.016) (). Additional adjustment for use of contraceptive pills and hormone replacement therapy in the multivariable analyses did not alter the association between having serum triglycerides in the highest compared to the lowest quartile with incident hypertension in women (OR 1.87, 95% CI: 1.14–3.10, p = 0.014), nor the association between increase in serum triglycerides and incident hypertension in women (OR 1.30, 95% CI: 1.07–1.58, p = 0.009).
Table 4. Factors associated with incident hypertension in women and men over 6 years in midlife.
Factors associated with incident hypertension in men
Also in men, higher BMI and high-normal BP at baseline predicted incident hypertension at follow-up (). In multivariable logistic regression analysis, the presence of high-normal BP and higher BMI at baseline, and larger increases in BMI and serum triglycerides during follow-up, were all associated with a higher risk of incident hypertension (all p < 0.05) (). Having serum triglycerides in the highest compared to the lowest quartile was not associated with incident hypertension in men.
Discussion
It has been demonstrated that BP trajectories differ between women and men [Citation6]. While rates of increase in SBP and DBP decline in men from 40 years and onward, rates of SBP and DBP increase remain constant with increasing age in women [Citation6]. The present analysis from the Hordaland Health study aimed at identifying factors associated with an increase in BP and incident hypertension over 6 years in women and men in their forties. We found that although BP development significantly differed between women and men in early midlife, higher BMI, weight gain and increases in serum lipids were the main factors associated with an increase in BP in both sexes. As expected, a lower proportion of women than men developed incident hypertension during 6 years follow-up. However, after adjustments for baseline BP category, BMI and education, the risk of incident hypertension was similar in women and men. The presence of high-normal BP at baseline was an important predictor of incident hypertension in both sexes.
Our sex-specific analysis expands previous results from the population-based Framingham Heart Study and Strong Heart Study that both were based upon on average overweight subjects with a mean age of around 50 years, and that did not present sex-specific results [Citation2,Citation3]. In the Framingham Heart Study, the presence of high-normal BP was associated with a 12-fold higher risk of incident hypertension over 4 years compared to those with optimal initial BP. Furthermore, a 5% weight gain was associated with an additional 20–30% increased risk of incident hypertension during follow-up [Citation2]. In a sub-study of 967 mostly obese North-American Indians with initial optimal BP in the Strong Heart Study, higher SBP and waist circumference at baseline and increases in these factors were associated with incident hypertension after 8 years follow-up [Citation3].
It is of particular interest that an association between baseline BMI and increases in SBP and DBP was evident in both sexes in our population that mostly included non-obese subjects. Our results indicate that level of BMI, even within the normal range is associated with a change in BP in early midlife. While a positive association between baseline BMI and change in SBP and DBP was evident over the whole BMI spectrum in men, the association between baseline BMI and increase in BP was J-shaped in women. The lowest increase in BP was seen in women with a BMI of around 21 kg/m2. Previous studies on the association of BMI with BP change have reported diverging results [Citation4,Citation13,Citation14]. In a study by Liu K et al., including both black and white young adults, similar associations between higher baseline BMI and BMI increase with increases in SBP and DBP were found in both sexes [Citation15]. In contrast, in the community-based Tromsø study, higher baseline BMI was associated with larger increases in SBP and DBP over 8 years in women than men in a population with an initial mean age of 39 years [Citation4]. However, in the Tromsø study, adjustment for baseline BP was not performed, although the initial SBP was 10 mmHg lower in women than in men. Also in a Japanese cohort study including 6803 men and 22,800 women aged 40–79 years, incident hypertension was more strongly associated with obesity in women than in men [Citation14].
Resting heart rate has been suggested as a marker of sympathetic activity [Citation16]. In a Chinese study, higher resting heart rate was associated with a higher risk of incident hypertension, however, separate analyses in women and men were not presented [Citation17]. In the present sex-specific analysis, we found a positive association between higher resting heart rate and increase in SBP in women and men, but not with incident hypertension.
Our results suggest a stronger association of elevated serum triglycerides with incident hypertension in women than in men. In contrast, elevated serum triglycerides predicted development of hypertension during 7 years follow-up in 311 Finnish men [Citation18]. In the Framingham offspring study, baseline BMI, serum triglycerides, and increase in these factors were associated with an increase in mean BP over 6 years follow-up, but sex-specific results were not reported [Citation19]. The Copenhagen city study recently demonstrated a positive association between higher levels of non-fasting serum triglycerides and plasma C-reactive protein (CRP) levels, suggesting that elevated serum triglycerides is a marker of inflammation [Citation20]. It has been proposed that the presence of elevated serum triglycerides may identify those at risk for diabetes development [Citation21,Citation22]. Diabetes mellitus is a stronger risk factor for coronary heart disease in women than men [Citation21,Citation23]. Likewise, higher serum triglyceride levels appear to be a more important risk factor for ischaemic heart disease in women than in men [Citation21,Citation23]. Because of the low prevalence of diabetes, we were not able to test the association between diabetes and incident hypertension in the present cohort.
We demonstrated an independent association of an increase in serum cholesterol during follow-up with increases in SBP and DPB in both sexes, and with incident hypertension particularly in women. These findings are in line with results in the Women’s Health Study [Citation24]. Furthermore, similar findings were reported for men in the Physicians’ Health Study and a Japanese cohort study of 14,215 male workers [Citation25,Citation26]. Despite these findings, a meta-analysis of 18 randomized clinical trials assessing the effect of cholesterol-lowering treatment on BP reduction found no evidence of substantial BP-lowering effect of statin treatment [Citation27].
Some study limitations should be outlined. The Hordaland Health Study was performed in a small region in Western Norway in an ethnically homogenous study sample with a very low prevalence of obesity. Thus, our results add to previous observations in overweight and obese cohorts. However, the generalisation of results should be done with caution. The relatively large study sample and prospective design are major strengths of this study. Furthermore, participation rates were high, above 70% both at the baseline and the follow-up survey [Citation9]. Out of office BP measurements were not included in the Hordaland Health Study. Although only 51 (15%) study participants were classified as having incident hypertension at follow-up based solely on antihypertensive drug use, we cannot exclude that some of these participants may have had another indication for use of these drugs, and therefore were misclassified. Information on the use of steroid hormones and statin treatment was not included in the baseline survey in 1992–1993. Serum triglycerides were measured in non-fasting blood samples. Non-fasting serum triglycerides probably have an even stronger association with CVD than fasting triglycerides level [Citation28,Citation29]. Finally, serum glucose, creatinine, and thyroid hormones were not measured at baseline in the present cohort. Medical history was collected in self-reported questionnaires. Prevalent diabetes, CVD, thyroid, and kidney disease may therefore be underreported.
Conclusion
In the Hordaland Health Study, BP development differed between women and men in early midlife. Higher BMI, weight gain, and increases in serum lipids were the main factors associated with increases in SBP and DBP and incident hypertension during 6 years follow-up both in women and men in their forties. As initial blood pressure was lower in women than in men, women were less prone to develop hypertension during follow-up. The presence of high-normal BP at baseline was an important predictor of incident hypertension in both sexes.
Disclosure statement
No potential conflict of interest was reported by the author(s).
Additional information
Funding
References
- WHO [Internet]. Geneva (Switzerland): World Health Organization. Hypertension; 2019 [cited 2020 January 03]. Available from: https://www.who.int/news-room/fact-sheets/detail/hypertension.
- Vasan RS, Larson MG, Leip EP, et al. Assessment of frequency of progression to hypertension in non-hypertensive participants in the Framingham Heart Study: a cohort study. Lancet. 2001;358(9294):1682–1686.
- de Simone G, Devereux RB, Chinali M, et al. Risk factors for arterial hypertension in adults with initial optimal blood pressure: the Strong Heart Study. Hypertension. 2006;47(2):162–167.
- Wilsgaard T, Schirmer H, Arnesen E. Impact of body weight on blood pressure with a focus on sex differences: the Tromso Study, 1986–1995. Arch Intern Med. 2000;160(18):2847–2853.
- Fryar CD, Ostchega Y, Hales CM, et al. Hypertension prevalence and control among adults: United States, 2015. NCHS Data Brief. 2016;2017(289):1–8.
- Scuteri A, Morrell CH, Orru M, et al. Longitudinal perspective on the conundrum of central arterial stiffness, blood pressure, and aging. Hypertension. 2014;64(6):1219–1227.
- Hasselstrom J, Zarrinkoub R, Holmquist C, et al. The Swedish primary care cardiovascular database (SPCCD): 74 751 hypertensive primary care patients. Blood Press. 2014;23(2):116–125.
- Wallentin F, Wettermark B, Kahan T. Current antihypertensive drug therapy in 12,436 Swedish patients, 90 years and above, in relation to sex and comorbidity. Blood Press. 2019;26:1–7.
- Refsum H, Nurk E, Smith AD, et al. The Hordaland Homocysteine Study: a community-based study of homocysteine, its determinants, and associations with disease. J Nutr. 2006;136(6):1731S–1740S.
- Nygård O, Vollset S, Refsum H, et al. Total plasma homocysteine and cardiovascular risk profile: the Hordaland Homocysteine Study. JAMA. 1995;274(19):1526–1533.
- Williams B, Mancia G, Spiering W, et al. 2018 Practice Guidelines for the management of arterial hypertension of the European Society of Cardiology and the European Society of Hypertension. Blood Pressure. 2018;27(6):314–340.
- WHO [Internet]. Geneva (Switzerland): World Health Organization. Obesity and overweight; 2018 [updated 16 February 2018; cited 2019 May 13th]. Available from: https://www.who.int/news-room/fact-sheets/detail/obesity-and-overweight.
- Sharabi Y, Grotto I, Huerta M, et al. Susceptibility of the influence of weight on blood pressure in men versus women: lessons from a large-scale study of young adults. Am J Hypertens. 2004;17(5):404–408.
- Fujita M, Hata A. Sex and age differences in the effect of obesity on incidence of hypertension in the Japanese population: a large historical cohort study. J Am Soc Hypertens. 2014;8(1):64–70.
- Liu K, Ruth KJ, Flack JM, et al. Blood pressure in young blacks and whites: relevance of obesity and lifestyle factors in determining differences. The CARDIA Study. Coronary Artery Risk Development in Young Adults. Circulation. 1996;93(1):60–66.
- Grassi G, Vailati S, Bertinieri G, et al. Heart rate as marker of sympathetic activity. J Hypertens. 1998;16(11):1635–1639.
- Wang A, Liu X, Guo X, et al. Resting heart rate and risk of hypertension: results of the Kailuan cohort study. J Hypertens. 2014;32(8):1600–1605.
- Laaksonen DE, Niskanen L, Nyyssonen K, et al. Dyslipidaemia as a predictor of hypertension in middle-aged men. Eur Heart J. 2008;29(20):2561–2568.
- Zachariah JP, Rong J, Larson MG, et al. Metabolic predictors of change in vascular function: prospective associations from a community-based cohort. Hypertension. 2018;71(2):237–242.
- Hansen SEJ, Madsen CM, Varbo A, et al. Low-grade inflammation in the association between mild-to-moderate hypertriglyceridemia and risk of acute pancreatitis: a study of more than 115000 individuals from the general population. Clin Chem. 2019;65(2):321–332.
- Egeland GM, Igland J, Sulo G, et al. Non-fasting triglycerides predict incident acute myocardial infarction among those with favourable HDL-cholesterol: Cohort Norway. Eur J Prev Cardiolog. 2015;22(7):872–881.
- Preis SR, Pencina MJ, Mann DM, et al. Early-adulthood cardiovascular disease risk factor profiles among individuals with and without diabetes in the Framingham Heart Study. Diabetes Care. 2013;36(6):1590–1596.
- Peters SA, Huxley RR, Woodward M. Diabetes as risk factor for incident coronary heart disease in women compared with men: a systematic review and meta-analysis of 64 cohorts including 858,507 individuals and 28,203 coronary events. Diabetologia. 2014;57(8):1542–1551.
- Sesso HD, Buring JE, Chown MJ, et al. A prospective study of plasma lipid levels and hypertension in women. Arch Intern Med. 2005;165(20):2420–2427.
- Halperin RO, Sesso HD, Ma J, et al. Dyslipidemia and the risk of incident hypertension in men. Hypertension. 2006;47(1):45–50.
- Otsuka T, Takada H, Nishiyama Y, et al. Dyslipidemia and the risk of developing hypertension in a working-age male population. J Am Heart Assoc. 2016;5(3):e003053.
- Banach M, Nikfar S, Rahimi R, et al. The effects of statins on blood pressure in normotensive or hypertensive subjects–a meta-analysis of randomized controlled trials. Int J Cardiol. 2013;168(3):2816–2824.
- Bansal S, Buring JE, Rifai N, et al. Fasting compared with nonfasting triglycerides and risk of cardiovascular events in women. JAMA. 2007;298(3):309–316.
- Nordestgaard BG, Benn M, Schnohr P, et al. Nonfasting triglycerides and risk of myocardial infarction, ischemic heart disease, and death in men and women. JAMA. 2007;298(3):299–308.