
Abstract
The purpose: To evaluate longitudinal trends in the prevalence of hyperuricaemia and chronic kidney disease (CKD) in Czech adults with and without arterial hypertension (HT).
Materials and methods: Two independent cross-sectional surveys were performed in 2006–2009 and 2015–2018, each screening involving 1% population random sample of the general population of nine districts of the Czech Republic aged 25–64 years, stratified by age and gender. Hyperuricaemia was defined as serum uric acid ≥ 420 μmol/l in men, and ≥ 360 μmol/l in women. CKD was defined as estimated glomerular filtration rate < 60 ml/min/1.73 m2 and/or albumin/creatinine ratio ≥ 3 mg/mmol.
Results: Final analyses included 3504 individuals examined in 2006–2009, and 2309 in 2015–2018. The overall prevalence of hyperuricaemia increased from 16.4% to 25.2% in men (p < 0.001), and from 7.6% to 10.9% in women (p < 0.001), whereas the overall prevalence of CKD declined from 6.8% to 3.6% in men (p = 0.001), and from 7.6% to 4.8% in women (p < 0.001). There was no interaction between HT and hyperuricaemia in either gender; the increase in hyperuricaemia prevalence was observed both in hypertensive and normotensive adults and was accompanied by the increased prevalence of abdominal obesity. Contrarily, there was an interaction between HT and CKD in both men (p < 0.001) and women (p = 0.011); the CKD prevalence declined only in hypertensive individuals, specifically in those using antihypertensive medication and was accompanied by the increased use of renin-angiotensin-aldosterone system (RAS) inhibitors and calcium channel blockers (CCBs).
Conclusions: Over the period of 10 years, the overall prevalence of hyperuricaemia increased, while the prevalence of CKD decreased. An increase in the prevalence of hyperuricaemia was observed both in hypertensive and normotensive individuals and was accompanied by an increase in the prevalence of abdominal obesity. A decline in the prevalence of CKD was only observed in hypertensive individuals and was accompanied by the increased use of RAS inhibitors and CCBs.
Introduction
Hyperuricaemia is a medical condition resulting from uric acid over-production or reduced renal excretion [Citation1], whereas chronic kidney disease (CKD) is defined by abnormalities of kidney structure or function [Citation2]. Hyperuricaemia is closely related to CKD with a deleterious feedback effect [Citation3]. In longitudinal studies, baseline serum uric acid (SUA) levels independently predicted new-onset CKD in the general population and also in individuals with diabetes mellitus (DM) [Citation4,Citation5]. On the other hand, decline in estimated glomerular filtration rate (eGFR) results in decreased renal urate excretion, further followed by an increase in SUA levels.
The pathophysiological mechanism by which increased SUA levels may lead to CKD is rather complex and, based on current evidence, involves the development of arterial hypertension (HT) and subtle renal injury [Citation3]. In longitudinal studies, increased SUA levels were dose-dependent and one of the most reproducible predictors of HT [Citation6]. In rats, experimentally induced hyperuricaemia is associated with the development of HT and hypertensive nephropathy with all hemodynamic and histological changes observed in essential hypertension in humans [Citation7–9]. Hypertension is also one of the most important risk factors for the development and progression of CKD.
Despite the inter-tangled pathophysiology, changes in the prevalence of hyperuricaemia and CKD over time are conflicting. Over the past few decades, the prevalence of hyperuricaemia seems to increase globally, mainly due to the increasing prevalence of obesity and unfavourable dietary changes [Citation10]. To the contrary, trends in the CKD prevalence are mixed. The global burden of CKD has increased over the last three decades, which is largely attributable to the population growth in low and lower-middle income countries [Citation11]. However, an increase in the overall prevalence of CKD in the United States of America (USA) observed from 1988 to 2003–2004, has been followed by its stabilisation in the recent decade [Citation12,Citation13]. Furthermore, the prevalence of eGFR < 60 ml/min/1.73 m2 even declined from 2003 to 2010 in England [Citation14]. Still, the reason explaining the opposing trends in the prevalence of hyperuricaemia and CKD in high-income countries is unclear.
As HT is a very common medical condition strongly associated both with hyperuricaemia and CKD, we have hypothesised that it may have an impact on both hyperuricaemia and CKD prevalence. The aim of the present analysis was to evaluate longitudinal trends in the prevalence of hyperuricaemia and CKD (1) in the general adult population of the Czech Republic; (2) in subgroups of individuals with and without HT. Furthermore, we aimed to evaluate longitudinal trends in other factors, which could potentially suggest a preliminary explanation for the changes in hyperuricaemia and CKD prevalence over time.
Methods
Study population
The Czech MONICA (MONItoring trends and determinants in CArdiovascular disease) study was established in 1985 and was succeeded by the Czech post-MONICA study. So far, there have been seven independent cross-sectional surveys performed in the Czech Republic [Citation15]. Since the SUA levels, eGFR and albumin–creatinine ratio (ACR) were determined only in the last two independent cross-sectional surveys (The Czech post-MONICA study 2006–2009, and 2015–2018), this analysis is aimed at the evaluation of 10-year trends.
As previously described elsewhere, each independent cross-sectional survey involved a 1% random sample of the general population of nine districts of the Czech Republic within an age range 25–64 years [Citation15,Citation16]. In 2006–2009, participants were randomly selected from the General Health Insurance Company registry, keeping by law a list of all the insured (health insurance is mandatory for all Czech citizens and is paid either by the employer/employee or by the government). Recently in 2015−2018, the selection was made from registers of five major health insurance companies, covering 85% of the entire Czech population.
The study protocols were approved by the Joint Ethics Committee of the Institute for Clinical and Experimental Medicine and Thomayer Hospital (Prague, Czech Republic). All study participants provided their written informed consent. A total of 3612 individuals were examined in 2006–2009, whereas a total of 2621 individuals were examined in 2015−2018. The response rates were 63.1 and 44.8%, respectively. All study participants were Caucasians.
Examination and laboratory analysis
In each independent cross-sectional survey, a physician-completed questionnaire focussing on demographic and socio-economic data, lifestyle, disease history and current use of medication was obtained. Alcohol intake in grams per week was calculated based on the self-reported consumption of beer, wine, and other liqueur. Anthropometric and blood pressure measurements, as well as fasting blood samples were taken as described previously [Citation15]. Glycosylated haemoglobin (HbA1c) was determined using a chromatography. On the screening day, participants were asked to provide a test tube with an early morning spot urine sample for direct albumin and creatinine measurement. Urine albumin was determined using immunoturbidimetry, whereas serum and urine creatinine were determined using an enzymatic assay. All laboratory measurements were performed in a central laboratory (Department for Laboratory Methods and Laboratory for Atherosclerosis, Institute for Clinical and Experimental Medicine, Prague, Czech Republic; Department of Clinical Chemistry, Thomayer Hospital, Prague, Czech Republic) [Citation15–17]. Consistency of the laboratory methods across the two surveys was ensured by using a standardised laboratory protocol. Accuracy of analysis was continuously monitored and tested by the Centres for Disease Control and Prevention (Atlanta, GA, USA).
Men with the level of SUA ≥ 420 μmol/l, and women with the level of SUA ≥ 360 μmol/l were considered to have hyperuricaemia [Citation1]. The Chronic Kidney Disease Epidemiology Collaboration equation was used to calculate eGFR. Following the current definition of CKD, we included individuals with an eGFR < 60 ml/min/1.73 m2 or single-time urine ACR ≥ 3 mg/mmol [Citation2]. Early CKD stages G1 A2–3 and G2 A2–3 were classified by the presence of ACR ≥ 3 mg/mmol (A2) and ≥ 30 mg/mmol (A3) and either eGFR ≥ 90 ml/min/1.73 m2 (Stage G1 A2–3) or eGFR 60–89 ml/min/1.73 m2 (Stage G2 A2–3). Stages G3–G5 were only classified according to eGFR values: 30–59 mL/min/1.73 m2 (Stage G3), 15–29 ml/min/1.73 m2 (Stage G4) and < 15 mL/min/1.73 m2 (Stage G5), regardless of the presence of other markers of kidney damage. Waist-to-height ratio > 0.5 was used as a measure of abdominal obesity. Arterial hypertension was defined as systolic blood pressure ≥ 140 mmHg or diastolic blood pressure ≥ 90 mmHg or current drug treatment for hypertension. Individuals with fasting plasma glucose ≥ 7 mmol/l or HbA1c ≥ 48 mmol/mol or current treatment with insulin or oral antidiabetic medication were considered to have DM.
Statistical analysis
Continuous variables were tested for normality and variables with the skewed distribution were logarithmically transformed. Variables given as population proportions were reported with 95% confidence interval (CI). The two-tailed t-test for independent samples was employed to evaluate the differences between the two surveys in continuous variables with normal distribution, whereas Mann-Whitney U-test was used for skewed distribution. The distribution of categorical variables between the surveys was compared by Pearson’s chi-square test or Fisher’s exact test, where applicable. As women participating in the 2015–2018 survey were slightly older compared to those participating in the 2006–2009 survey, we used two-way analysis of variance (ANOVA) to evaluate how much of the increase in SUA levels from 2006–2009 to 2015–2018 can be attributed to an age effect. Pre-specified interaction term of age groups * the year of survey (2006–2009 vs. 2015–2018), as well as age groups and the year of survey per se were included as independent variables.
Logistic regression models were used to examine the modification effect of HT on changes in hyperuricaemia and CKD prevalence over the period of 10 years. The year of survey (2015–2018 vs. 2006–2009) was used as a dependent variable, and pre-specified interaction terms of HT * hyperuricaemia and HT * CKD were included as independent variables, each in an individual model. Each individual model was adjusted for HT, hyperuricaemia, and CKD per se, as well as for the other potential confounders, that were age, education, current smoking, triglycerides, waist-to-height ratio > 0.5, DM, quartiles of alcohol intake, and the use of xanthine-oxidase inhibitors, diuretics, and losartan. In order to adjust for multiple comparisons, a Holm-Bonferroni-corrected significant difference was defined as two-sided p values of < 0.025; and < 0.05.
In order to evaluate whether a change in the prevalence of hyperuricaemia and CKD over the period of 10 years was significant and accompanied by a change in other factors, multivariate logistic regression analysis with the year of survey (2015–2018 vs. 2006–2009) as a dependent variable was employed. All factors showing a significant difference between the two surveys in a univariate analysis, including hyperuricaemia and CKD, were used as independent variables. The odds ratio (OR) of hyperuricaemia, CKD, and other factors in 2015–2018 vs. in 2006–2009 was reported in the overall population of men and women, and in men and women with and without HT.
Calculations were performed using SPSS 19 software (SPSS Inc., Chicago, Illinois, USA). A significant difference was defined as a two-sided p value < 0.05.
Results
Demographic and clinical characteristics of the general Czech adult population random samples in 2006–2009 and in 2015–2018
A total of 3504 (48.7% men) and 2309 (47.4% men) individuals examined in 2006–2009 and 2015–2018, respectively, with available SUA levels, eGFR, and ACR were included in the final analyses. The demographic and clinical characteristics are summarised in . Of note, women participating in the 2015–2018 survey were slightly older compared to those participating in the 2006–2009 survey. Over the period of 10 years, there has been a significant increase in the proportion of individuals with higher education, increase in antropometric parameters of central obesity, and in the use of renin–angiotensin–aldosterone system (RAS) inhibitors, whereas a median of triglycerides, the proportion of smokers and the use of beta blockers and losartan decreased in both genders. In men, there has been a significant increase in the use of calcium channel blockers (CCBs), whereas in women, there has been a significant decline in the use of diuretics. Of note, there has been no change in the mean population systolic and diastolic blood pressure, as well as no change in the prevalence of HT. Median alcohol intake remained unchanged in men, whereas there has been a slight increase in alcohol intake in women.
Table 1. Demographic and clinical characteristics by gender, Czech post-MONICA studies 2006–2009 and 2015–2018.
Longitudinal trends in the crude prevalence of hyperuricaemia and CKD
Over the period of 10 years, there has been an increase in mean SUA levels from 296.2 ± 90.7 µmol/l to 324.4 ± 84.5 µmol/l (p < 0.001) and in the prevalence of hyperuricaemia from 11.9% (95% CI 10.8−13) to 17.7% (95% CI 16.1−19.2) (p < 0.001) in the overall population. There has been no effect of the interaction between age groups and the year of survey (2006–2009 vs. 2015–2018) on mean SUA levels in either gender. Over the period of 10 years, mean SUA levels have increased proportionally in each age group both in men and women (Supplementary Figure 1(A,B)).
Contrarily, there has been a decline in the prevalence of CKD from 7.2% (95% CI 6.3−8) to 4.2% (95% CI 3.4−5) (p < 0.001) in the overall population, mostly attributable to the decline in the prevalence of early CKD stages. Specifically, the overall prevalence of the CKD stages G1–2 A2–3 was 4.9% (95% CI 4.2−5.6) in 2006–2009 and 2.5% (95% CI 1.9−3.2) in 2015–2018. Similarly, the prevalence of ACR ≥ 3 mg/mmol declined from 5.5% (95% CI 4.8−6.3) to 2.8% (95% CI 2.1−3.4) (p < 0.001), whereas a decline in the prevalence of eGFR < 60 ml/min/1.73 m2 from 2.3% (95% CI 1.8−2.8) to 1.7% (95% CI 1.2−2.3) was not significant (p = 0.134).
Ten-year trends in the crude prevalence of hyperuricaemia and CKD by gender are displayed in .
Table 2. Ten-year trends in crude prevalence estimates of hyperuricaemia and CKD by gender.
Longitudinal trends in the crude prevalence of hyperuricaemia and CKD by blood pressure status
Over the period of 10 years, there has been a parallel increase in the prevalence of hyperuricaemia in men and women with and without HT ().
Figure 1. Ten-year trends in the prevalence of hyperuricaemia (A) and CKD (B) by blood pressure status. CKD: chronic kidney disease; HT: hypertensives; NT: normotensives. *p < 0.05, **p < 0.005, ***p < 0.001. (A) Multivariate adjusted p values for the effect of the interaction between HT and hyperuricaemia on 10-year trends was 0.192 in men and 0.851 in women. (B) Multivariate adjusted p values for the effect of the interaction between HT and CKD on 10-year trends was = 0.001 in men and 0.011 in women. Each interaction analysis was adjusted for: age, education, current smoking, triglycerides, waist-to-height ratio > 0.5, diabetes, quartiles of alcohol intake, the use of xanthine-oxidase inhibitors, diuretics, and losartan, as well as for hyperuricaemia, CKD and HT per se.
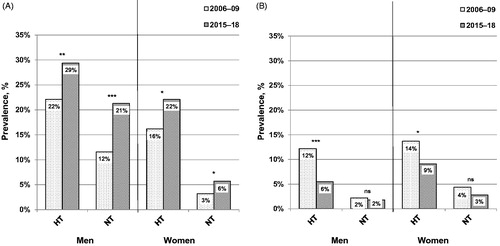
In men, there has been a significant effect of the interaction between HT and CKD (p < 0.001), with the prevalence of CKD declining only in hypertensive individuals (p < 0.001), but not in normotensive ones (). In a further subanalysis of hypertensive men, a decline in the prevalence of CKD was significant only in those using antihypertensive medication (from 15.3% to 6.7%; p < 0.001) (adjusted p value for the effect of the interaction between CKD and the use of antihypertensive medication on 10-year trends of 0.001; not shown).
Similarly, there has been a significant effect of the interaction between HT and CKD in women (p = 0.011), with the prevalence of CKD declining only in hypertensive women (p = 0.035), but not in normotensive ones (). In a further subanalysis of hypertensive women, there was only a tendency towards a significant effect of the interaction between CKD and the use of antihypertensive medication on 10-year trends (p = 0.063).
The odds ratio of hyperuricaemia, chronic kidney disease, abdominal obesity, hypertension, diabetes, and the use of antihypertensive medication in 2015−2018 vs. in 2006−2009
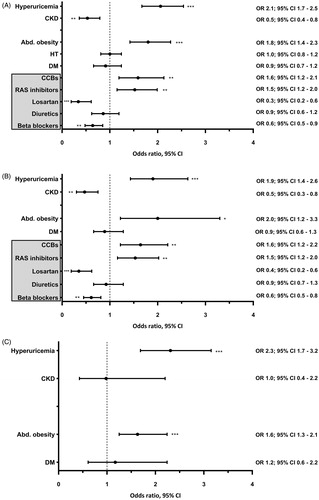
In the overall population of men, multivariate adjusted odds of hyperuricaemia, abdominal obesity and the use of CCBs and RAS inhibitors increased in 2015–2018 vs. in 2006–2009. Simultaneously, the odds of CKD and the use of beta blockers and losartan decreased (). Similar results were obtained in hypertensive men (). In normotensive men, a multivariate adjusted increase in odds of hyperuricaemia was accompanied by an increase in odds of abdominal obesity in 2015–2018 vs. in 2006–2009 ().
Figure 2. Multivariate logistic regression analysis showing the odds ratio of hyperuricaemia, chronic kidney disease, abdominal obesity, hypertension, diabetes, and the use of antihypertensive medication in 2015–18 vs. in 2006–09 in men. Abd. obesity: abdominal obesity; BB: beta blockers; CCBs: calcium channel blockers; CKD: chronic kidney disease; DM: diabetes mellitus; HT: arterial hypertension; RAS: renin-angiotensin-aldosterone system. *p < 0.05, **p < 0.005, ***p < 0 .001. (A) Total study population; n = 2803. (B) Hypertensive individuals; n = 1308. (C) Normotensive individuals; n = 1495. The year of survey (2015–2018 vs. 2006–2009) was used as a dependent variable. In addition to all factors graphically displayed, each multivariate logistic regression analysis was adjusted for: age, education, current smoking, triglycerides, and the use of xanthine-oxidase inhibitors. Further adjustment for quartiles of alcohol intake did not alter the results.
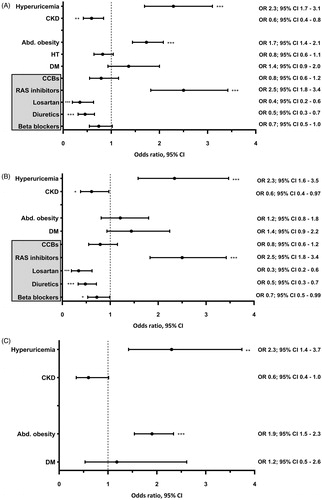
In the overall population of women, multivariate adjusted odds of hyperuricaemia, abdominal obesity and the use of RAS inhibitors increased in 2015–2018 vs. in 2006–2009. Simultaneously, the odds of CKD and the use of diuretics and losartan decreased (). Similar results were also obtained in hypertensive women; however, an increase in odds of abdominal obesity in 2015–2018 vs. in 2006–2009 was not significant (). Contrarily, in normotensive women, a multivariate adjusted increase in odds of hyperuricaemia was accompanied by an increase in odds of abdominal obesity in 2015–2018 vs. in 2006–2009 ().
Figure 3. Multivariate logistic regression analysis showing the odds ratio of hyperuricaemia, chronic kidney disease, abdominal obesity, hypertension, diabetes, and the use of antihypertensive medication in 2015–18 vs. in 2006–09 in women. Abd. obesity: abdominal obesity; BB: beta blockers; CCBs: calcium channel blockers; CKD: chronic kidney disease; DM: diabetes mellitus; HT: arterial hypertension; RAS: renin-angiotensin-aldosterone system. *p < 0.05, **p < 0.005, ***p < 0.001. (A) Total study population; n = 3010. (B) Hypertensive individuals; n = 997. (C) Normotensive individuals; n = 2013. The year of survey (2015–2018 vs. 2006–2009) was used as a dependent variable. In addition to all factors graphically displayed, each multivariate logistic regression analysis was adjusted for: age, education, current smoking, triglycerides, and the use of xanthine-oxidase inhibitors. Further adjustment for quartiles of alcohol intake did not alter the results.
Discussion
This is the first study, to our knowledge, to evaluate longitudinal trends in the prevalence of hyperuricaemia and CKD in a Central European country; and the first one of its kind in Europe to evaluate longitudinal trends in the prevalence of hyperuricaemia and CKD simultaneously. Of note, over the last decade, a considerable increase in the overall prevalence of hyperuricaemia was observed in the Czech adults, while, at the same time, there was a decline in the overall prevalence of CKD, mostly attributable to the decline in urinary albumin excretion. In a subgroup analysis, an increase in the prevalence of hyperuricaemia was observed both in hypertensive and in normotensive individuals, and was accompanied by an increase in the prevalence of abdominal obesity. Contrarily, a decline in the prevalence of CKD was observed only in hypertensive individuals, specifically in those using antihypertensive medication. At the same time, there was an increase in the use of RAS inhibitors and CCBs in hypertensive men, and an increase in the use of RAS inhibitors in hypertensive women. However, the cross-sectional design of the Czech post-MONICA study limits any causal inference.
The increasing prevalence of hyperuricaemia in Czech adults is in agreement with a worldwide trend, largely attributable to the increasing prevalence of obesity. In the Italian general population, using a cut-off of 360 µmol/l, the prevalence of hyperuricaemia increased from 8.5% in 2005 to 11.9% in 2009 [Citation18]. In Eastern China, an increase in the prevalence of hyperuricaemia highly correlated with the development of the economy [Citation19]. To the contrary, in the National Health and Nutritional Examination Survey (NHANES) in the USA, the prevalence of hyperuricaemia increased from 1988–1994 to 2007–2008 [Citation20], however, no significant change has been reported from 2007–2008 to 2015–2016 [Citation21]. Interestingly, the prevalence of hyperuricaemia among Czech adults in 2015–2018 was comparable to that of US adults in 2015–2016. Dietary changes, especially increased consumption of soft drinks, have been likely to substantially contribute to the increasing prevalence of hyperuricaemia among Czech adults. As reported by the Czech Statistical Office, there has been a significant increase in soft drinks’ consumption and a slight increase in the consumption of pulses, however, the overall consumption of meat and bowels decreased from 1989 to 2018 [Citation22].
In our study, an increase in the prevalence of hyperuricaemia was also accompanied by a decrease in the use of losartan, the only angiotensin II receptor blocker with an uricosuric effect due to the inhibition of the urate transporter 1 [Citation23–25]. However, as the proportion of individuals using losartan was rather low, it is not likely to have a major impact on our results. Other drugs with uricosuric effects (e.g. fenofibrate), or SUA levels increasing drugs (e.g. diuretics) have not been likely to contribute to the increase in the prevalence of hyperuricaemia, as the use of fenofibrate has remained unchanged, while the use of diuretics decreased in women.
To date, the global estimated prevalence of CKD ranges between 10.4% and 13.4%, with a slightly higher prevalence rates being reported in women [Citation26,Citation27]. Though, a considerable variation in CKD prevalence has been reported across European countries, which cannot be completely explained by differences in the prevalence of hypertension, diabetes, and obesity [Citation28]. Other factors, like differences in socioeconomic status, dietary habits, genetic susceptibility, as well as the study methodology could potentially contribute to the reported variation in CKD prevalence in Europe. In Czech adults, the prevalence of CKD in 2007–2008 was comparable with that obtained in 2008–12 in a random sample of the general population of Italy aged 35–79 years (7.05%) [Citation29]. Furthermore, in line with several other previously published data, early CKD stages accounted for the major part of the estimated CKD population in our study [Citation13,Citation29,Citation30]. On the other hand, we fully acknowledge that the prevalence of CKD stages G4–G5 is likely to be slightly underestimated due to the possible selection bias.
Longitudinal trends in the prevalence of CKD have not been comprehensively evaluated in European countries yet. It has been shown that despite the rising prevalence of obesity and DM, the prevalence of eGFR < 60 ml/min/1.73m2 declined from 2003 to 2010 in nationally representative random samples in England; however, the absence of urinary albumin excretion measurement was a major limitation of this study [Citation14]. Contrarily, the overall proportion of CKD did not change from 2003–04 (14.0%) to 2011–2012 (14.2%) in the USA; however, the prevalence rates were much higher compared to our data [13].
Having a serial cross-sectional design comparable to that of the Czech post-MONICA study, the NHANES has been the only study to date evaluating longitudinal trends in the prevalence of hyperuricaemia and CKD simultaneously. While the prevalence of hyperuricaemia and CKD were increasing in previous decades, both seem to have reached a plateau at the beginning of the new millennium [Citation13,Citation21]. As possible reasons for the recent stabilisation of CKD prevalence in the USA, advances in medical management of HT and DM, and the increased use of RAS inhibitors have been suggested [Citation13]. Our findings provide further support for this hypothesis by showing a decline in CKD prevalence in hypertensive adults using antihypertensive medication. Furthermore, the decline in the prevalence of CKD was mostly due to the reduction of early CKD stages, particularly stage G2 A2–3, while the decline in the prevalence of CKD stages G3 and G4 was less pronounced. These changes were accompanied by the increased use of RAS inhibitors and CCBs in hypertensive men, and by the increased use of RAS inhibitors in hypertensive women. Of note, approximately 48% of all hypertensive individuals were using either RAS inhibitors, CCBs, or both in 2006–2009, whereas 56% of all hypertensive individuals in 2015–2018 (p = 0.001). Though, it should be noted that the prevalence of HT, mean systolic and diastolic blood pressure, and the proportion of hypertensive individuals achieving blood pressure control did not change over the period of ten years. On the other hand, a large number of studies showed a reno-protective effect of RAS inhibitors and CCBs alone or in combination beyond lowering of blood pressure [Citation31–34]. As the cross-sectional design of our study limits any causal inferences, we may speculate that the decline in CKD prevalence was attributable to the increased use of RAS blockade and CCBs. Furthermore, experimental studies have documented that uric acid-induced kidney damage is due to the enhanced activation of the RAS and reduced endothelial nitric oxide availability [Citation3]. Thus, it could also be hypothesised that the increasing use of RAS inhibitors and CCBs over the last decade could have potentially prevented detrimental effects of hyperuricaemia on kidney. Moreover, evidence from animal research provides further support for this hypothesis by showing that the renal arteriolopathy and vascular smooth muscle cell proliferation were prevented by both enalapril and losartan in rats with experimentally induced hyperuricaemia [Citation35].
Major strengths of this study include large nationally representative population-based random samples covering both urban and rural areas of the Czech Republic, standardised methods employed throughout the screenings, all laboratory measurements performed centrally, and a wide range of demographic and clinical data rigorously collected in a uniform manner. Our study had also several limitations. (1), hyperuricaemia, CKD, and DM were classified using a single measurement of corresponding variables. It can be argued that a single ACR measurement may lead to mis-estimation of urinary albumin excretion due to its intra-individual variability and by CKD definition, ACR ≥ 3 mg/mmol in two or three spot urine samples is required. However, the meta-analysis of several epidemiological studies has shown that single ACR measurement in a spot urine sample was in satisfying correlation with the 24-hour urinary albumin excretion rate [Citation36,Citation37]. So far, a single ACR measurement has been generally accepted and widely used in a number of epidemiological studies to identify subjects with increased albuminuria and CKD in the general population [Citation13,Citation29,Citation38]. Furthermore, since only single measurements were available in each survey, this should not bias the assessment of longitudinal trends in our study. (2), the prevalence rates could have been underestimated due to the population selection bias, as the response rate decreased over time. Although this problem is currently very common in population based studies, our response rates still belong to the highest ones. Finally, due to the serial cross-sectional design of the Czech post-MONICA study, the causal relationships cannot be inferred.
In conclusion, in the Czech adults, the overall prevalence of hyperuricaemia increased over the last decade, while there was a decline in the prevalence of CKD, mainly attributable to the decline in the prevalence of early CKD stages. An increase in the prevalence of hyperuricaemia was observed both in hypertensive and normotensive individuals and was accompanied by an increase in the prevalence of abdominal obesity. A decline in the prevalence of CKD was only observed in hypertensive individuals and was accompanied by an increase in the use of RAS inhibitors and CCBs. Although the decline in CKD prevalence is likely to be explained by the increased use of RAS inhibitors, the cross-sectional design of our study considerably limits any causal inferences. Nevertheless, our data imply important questions for future research as well as perception of preventive and health care strategies.
Supplementary_figure_1_B.tif
Download TIFF Image (146.4 KB)Supplementary_figure_1_A.tif
Download TIFF Image (144.2 KB)Supplementary_figure_1_27_4_2020.doc
Download MS Word (136.5 KB)Disclosure statement
The authors declare they have no conflict of interest.
Additional information
Funding
References
- Johnson RJ, Bakris GL, Borghi C, et al. Hyperuricemia, acute and chronic kidney disease, hypertension, and cardiovascular disease: Report of a Scientific Workshop organized by the National Kidney Foundation. Am J Kidney Dis. 2018;71(6):851–865.
- Kidney Disease Improving Global Outcomes (KDIGO) CKD Work Group. KDIGO 2012 clinical practice guideline for the evaluation and management of chronic kidney disease. Kidney Int Suppl. 2013;3:1–150.
- Johnson RJ, Nakagawa T, Jalal D, et al. Uric acid and chronic kidney disease: which is chasing which?. Nephrol Dial Transplant. 2013;28(9):2221–2228.
- Zhu P, Liu Y, Han L, et al. Serum uric acid is associated with incident chronic kidney disease in middle-aged populations: a meta-analysis of 15 cohort studies. PLoS One. 2014;9(6):e100801.
- De Cosmo S, the AMD-Annals Study Group, Viazzi F, Pacilli A, et al. Serum Uric Acid and Risk of CKD in Type 2 Diabetes. CJASN. 2015;10(11):1921–1929.
- Wang J, Qin T, Chen J, et al. Hyperuricemia and risk of incident hypertension: a systematic review and meta-analysis of observational studies. PLoS One. 2014;9(12):e114259.
- Mazzali M, Hughes J, Kim YG, et al. Elevated uric acid increases blood pressure in the rat by a novel crystal-independent mechanism. Hypertension. 2001;38(5):1101–1106.
- Kang DH, Nakagawa T, Feng L, et al. A role for uric acid in the progression of renal disease. J Am Soc Nephrol. 2002;13(12):2888–2897.
- Johnson RJ, Herrera-Acosta J, Schreiner GF, et al. Subtle acquired renal injury as a mechanism of salt-sensitive hypertension. N Engl J Med. 2002;346(12):913–923.
- Borghi C, Rosei EA, Bardin T, et al. Serum uric acid and the risk of cardiovascular and renal disease. J Hypertens. 2015;33(9):1729–1741.
- Xie Y, Bowe B, Mokdad AH, et al. Analysis of the Global Burden of Disease study highlights the global, regional, and national trends of chronic kidney disease epidemiology from 1990 to 2016. Kidney Int. 2018;94(3):567–581.
- Coresh J, Selvin E, Stevens LA, et al. Prevalence of chronic kidney disease in the United States. JAMA. 2007;298(17):2038–2047.
- Murphy D, McCulloch CE, Lin F, et al.; for the Centers for Disease Control and Prevention Chronic Kidney Disease Surveillance Team. Trends in prevalence of chronic kidney disease in the United States. Ann Intern Med. 2016;165(7):473–481.
- Aitken GR, Roderick PJ, Fraser S, et al. Change in prevalence of chronic kidney disease in England over time: comparison of nationally representative cross-sectional surveys from 2003 to 2010. BMJ Open. 2014;4(9):e005480–e005480.
- Cifkova R, Skodova Z, Bruthans J, et al. Longitudinal trends in cardiovascular mortality and blood pressure levels, prevalence, awareness, treatment, and control of hypertension in the Czech population from 1985 to 2007/2008. J Hypertens. 2010;28(11):2196–2203.
- Cifkova R, Skodova Z, Bruthans J, et al. Longitudinal trends in major cardiovascular risk factors in the Czech population between 1985 and 2007/8. Czech MONICA and Czech post-MONICA. Atherosclerosis. 2010;211(2):676–681.
- Krajcoviechova A, Tremblay J, Wohlfahrt P, et al. The Impact of Blood Pressure and Visceral Adiposity on the Association of Serum Uric Acid With Albuminuria in Adults Without Full Metabolic Syndrome. Am J Hypertens. 2016;29(12):1335–1342.
- Trifiro G, Morabito P, Cavagna L, et al. Epidemiology of gout and hyperuricaemia in Italy during the years 2005-2009: a nationwide population-based study. Ann Rheum Dis. 2013;72(5):694–700.
- Miao Z, Li C, Chen Y, et al. Dietary and lifestyle changes associated with high prevalence of hyperuricemia and gout in the Shandong coastal cities of Eastern China. J. Rheumatol. 2008;35(9):1859–1864.
- Zhu Y, Pandya BJ, Choi HK. Prevalence of gout and hyperuricemia in the US general population: the National Health and Nutrition Examination Survey 2007-2008. Arthritis Rheum. 2011;63(10):3136–3141.
- Singh G, Lingala B, Mithal A. Gout and hyperuricaemia in the USA: prevalence and trends. Rheumatology (Oxford.) 2019;58(12):2177–2180.
- Czech Statistical Office. Table 03.02: Food consumption and non-alcoholic beverages in 1989-2017 [accessed 27 March 2020]. http:/www.czso.cz
- Elliott WJ, Calhoun DA, DeLucca PT, et al. Losartan versus valsartan in the treatment of patients with mild to moderate essential hypertension: data from a multicenter, randomized, double-blind, 12-week trial. Clin Ther. 2001;23(8):1166–1179.
- Manolis AJ, Grossman E, Jelakovic B, et al. Effects of losartan and candesartan monotherapy and losartan/hydrochlorothiazide combination therapy in patients with mild to moderate hypertension. Losartan Trial Investigators. Clin Ther. 2000;22(10):1186–1203.
- Hamada T, Ichida K, Hosoyamada M, et al. Uricosuric action of losartan via the inhibition of urate transporter 1 (URAT 1) in hypertensive patients. Am J Hypertens. 2008;21(10):1157–1162.
- Mills KT, Xu Y, Zhang W, et al. A systematic analysis of worldwide population-based data on the global burden of chronic kidney disease in 2010. Kidney Int. 2015;88(5):950–957.
- Hill NR, Fatoba ST, Oke JL, et al. Global Prevalence of Chronic Kidney Disease – A Systematic Review and Meta-Analysis. PLoS One. 2016;11(7):e0158765.
- Bruck K, Stel VS, Gambaro G, et al. CKD Prevalence Varies across the European General Population. JASN. 2016;27(7):2135–2147.
- De Nicola L, Donfrancesco C, Minutolo R, et al. Prevalence and cardiovascular risk profile of chronic kidney disease in Italy: results of the 2008-12 National Health Examination Survey. Nephrol Dial Transplant. 2015;30(5):806–814.
- Hallan SI, Coresh J, Astor BC, et al. International comparison of the relationship of chronic kidney disease prevalence and ESRD risk. JASN. 2006;17(8):2275–2284.
- Xie X, Liu Y, Perkovic V, et al. Renin-angiotensin system inhibitors and kidney and cardiovascular outcomes in patients with CKD: a Bayesian network meta-analysis of randomized clinical trials. Am J Kidney Dis. 2016;67(5):728–741.
- Robles NR, Fici F, Grassi G. Dihydropyridine calcium channel blockers and renal disease. Hypertens Res. 2017;40(1):21–28.
- Brenner BM, Cooper ME, de Zeeuw D, et al. Effects of losartan on renal and cardiovascular outcomes in patients with type 2 diabetes and nephropathy. N Engl J Med. 2001;345(12):861–869.
- Fogari R, Preti P, Zoppi A, et al. Effects of amlodipine fosinopril combination on microalbuminuria in hypertensive type 2 diabetic patients. Am J Hypertens. 2002;15(12):1042–1049.
- Mazzali M, Kanellis J, Han L, et al. Hyperuricemia induces a primary renal arteriolopathy in rats by a blood pressure-independent mechanism. Am J Physiol Renal Physiol. 2002;282(6):F991–7.
- Wu HY, Peng YS, Chiang CK, et al. Diagnostic performance of random urine samples using albumin concentration vs ratio of albumin to creatinine for microalbuminuria screening in patients with diabetes mellitus: a systematic review and meta-analysis. JAMA Intern Med. 2014;174(7):1108–1115.
- Gansevoort RT, Verhave JC, Hillege HL, et al. The validity of screening based on spot morning urine samples to detect subjects with microalbuminuria in the general population. Kidney Int Suppl. 2005;67(94):S28–S35.
- Agyemang C, Snijder MB, Adjei DN, et al. Ethnic Disparities in CKD in the Netherlands: The Healthy Life in an Urban Setting (HELIUS) Study. Am J Kidney Dis. 2016;67(3):391–399.