
Abstract
Purpose
Renal sympathetic denervation (RDN) is again gaining interest as recent well-designed trials have demonstrated reduced ambulatory blood pressure (BP) after RDN. However, the hemodynamic mechanisms have not been elucidated. We aimed for the first time to investigate the effect of RDN on the “Hallmark of Hypertension” namely increased systemic vascular resistance index (SVRI).
Materials and methods
We investigated SVRI change in patients with true treatment-resistant hypertension randomised to RDN (n = 9) or drug adjusted control (n = 9). Treatment-resistant hypertension was defined as office systolic BP ≥ 140 mmHg despite ≥ 3 antihypertensive drugs including a diuretic. True treatment-resistant hypertension was confirmed prior to inclusion with ambulatory daytime systolic BP ≥ 135 mmHg immediately after witnessed intake of antihypertensive drugs. Hemodynamic variables were recorded with thoracic impedance cardiography at baseline and at three and six months follow-up after RDN. This non-invasive method also guided further tailoring of drug treatment in the control group aiming to normalise hemodynamic variables and BP.
Results
From three to six months follow-up after RDN, SVRI decreased with a median of −611 dyn*s*m2/cm5 [IQR −949 to −267] (p < 0.01), while supine mean BP decreased with a median of −11 mmHg [IQR −21 to −3] (p = 0.02). In the same period, SVRI in the control group was reduced with −674 dyn*s*m2/cm5 [IQR −1,309 to −340] (p < 0.01), while supine mean BP decreased with −15 mmHg [IQR −29 to −6] (p = 0.01). Thus, hemodynamic variables and BP in the two groups normalised in parallel.
Conclusion
Our data suggest that in patients with true treatment-resistant hypertension, renal sympathetic denervation lowers BP by reducing systemic vascular resistance of similar size as in the control group with careful individual selection of antihypertensive drugs and dose titration.
Introduction
Three recent well-designed trials on renal sympathetic denervation (RDN) have demonstrated reduced office and ambulatory blood pressure (BP) levels after RDN compared to sham [Citation1–3], and RDN is again gaining interest as a potential treatment of hypertension [Citation4,Citation5]. These studies controlled for previous procedural and patients related confounding factors; they used more advanced or novel ablation techniques, excluded patients with poor drug adherence, and elevated ambulatory BP was both required prior to inclusion as well as being the primary efficacy endpoint [Citation1–3]. The BP lowering effects of RDN in the recent trials are of the size of 5–7 mmHg when the sham effect is controlled for and previous studies hampered by less rigid study designs are not included [Citation1–3,Citation6]. The effect is thus not very large and may correspond to the effect of one antihypertensive drug. Thus, in order to strengthen the concept of a modest but relevant BP lowering effect of this treatment, supportive data to describe the potential BP reducing mechanisms of RDN are needed [Citation1–3].
Elevated systemic vascular resistance is known as the “Hallmark of Hypertension”, and most antihypertensive drugs lower BP by reducing systemic vascular resistance index (SVRI) [Citation7–9]. In a careful selection of patients with true treatment-resistant hypertension (TRH), we aimed in the present study to specifically investigate the effect of RDN on SVRI, measured with thoracic impedance cardiography at baseline and at three and six months follow-up after RDN in the prospective and randomised Oslo RDN Study [Citation10]. The patients were truly treatment-resistant as described in the guidelines [Citation11], including verified drug adherence by elevated ambulatory BP levels immediately after witnessed intake of antihypertensive drugs [Citation10]. For patients randomised to the control group, impedance cardiography also guided further changes of drug treatment with the aim to normalise hemodynamic variables and achieve BP control. We postulated and investigated whether the patients randomised to RDN would follow the same pattern as the control group, with a reduction of the vascular resistance, thus providing further support for an important BP lowering effect caused by RDN.
Materials and methods
Because of the sensitive nature of the data collected for this study, the dataset will not be made available. In dire needs, this may be discussed with the corresponding author.
Study design and participants
A detailed description of the design and the main results of the Oslo RDN Study have been described previously [Citation10]. We enrolled patients with an office systolic BP level ≥140 mmHg despite the use of ≥3 antihypertensive drugs including a diuretic in maximum tolerated doses [Citation11]. The patients were also required to have true TRH, i.e. they were only included if mean ambulatory daytime systolic BP was above 135 mmHg immediately after carefully performed witnessed intake of antihypertensive drugs, which can reveal poor drug adherence [Citation11,Citation12]. They were prospectively randomised in parallel groups to treatment with RDN (n = 9), or control (n = 10) with individualised medical therapy optimised according to the underlying hemodynamic deviation in each patient as measured with impedance cardiography [Citation13–15]. One strongly deviant participant in the control group was excluded from the statistical analyses (see Statistical Analysis below). The primary endpoint was change in office systolic BP from randomisation to six months follow-up. Witnessed intake of antihypertensive drugs immediately prior to ambulatory BP measurements was also required at follow-up.
The Oslo RDN Study protocol was approved by the Regional Committee for Medical and Health Research Ethics and all patients gave written informed consent for participation and publication of study results (ClinicalTrials.gov number NCT 01673516).
One patient in the RDN group lacked impedance cardiography measurements at baseline (prior to the RDN procedure) and was only included in the analysis of the RDN group from three to six months follow-up.
Procedures
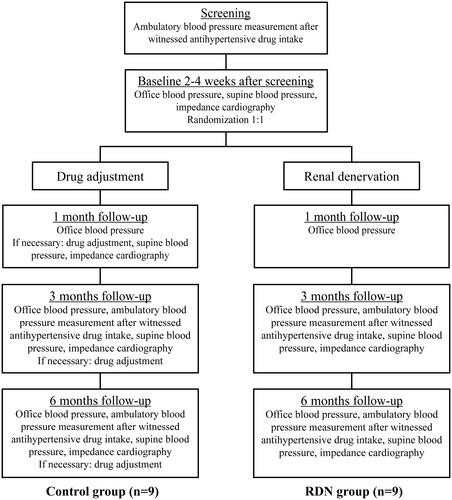
Procedures performed in each group are illustrated in [Citation10]. The hemodynamic status of patients was measured in the supine position, with impedance cardiography and simultaneous BP measurement at baseline, and at three and six months follow-up. Microlife WatchBP O3 (Microlife Health Management Ltd, Cambridge, United Kingdom) was used for all BP measurements. Thoracic impedance cardiography measurements were performed with the validated non-invasive HOTMAN System (Hemo Sapiens Inc., Sedona, AZ, USA) [Citation16–18], the supplemental online material provide details on the procedure. The HOTMAN System also provided us with an algorithm that calculated deviations in systemic vascular resistance, volume load and cardiac inotropy, i.e. the patients’ hemodynamic status [Citation13]. In the control group, medications were adjusted at study visits after a pre-specified algorithm based on the hemodynamic status and according to the ESH-ESC hypertension guidelines [Citation13,Citation19], e.g. increase the diuretic dose in patients with volume overload and increase vasodilatory agents if the patient had a high level of vasoconstriction. The Symplicity Catheter System was used for the RDN procedure [Citation10,Citation20,Citation21], and medical therapy in the RDN group was kept unchanged from baseline until the six months follow-up visit. This allows an assessment of hemodynamic alterations in the RDN group without the interaction of simultaneous drug changes.
Figure 1. Trial design. RDN: renal sympathetic denervation.
Statistical analyses
Baseline characteristics between the groups were compared with Mann-Whitney U test for continuous parameters, and Fisher’s Exact Probability test was applied on categorical variables. Overall changes in continuous hemodynamic variables within each group between baseline, three and six months follow-up were tested with Friedman test. Significant results with Friedman test were further investigated with Wilcoxon signed rank test between specific time points. An additional analysis with Wilcoxon signed rank test between three and six months follow-up including the ninth patient without baseline measurement (RDN group) was also performed. A 2-sided α level of 0.05 was considered significant. By visual evaluation of the individual changing patterns of SVRI, one patient in the control group was considered strongly deviant compared to the rest of the group (ticked line in ), this patient was therefore excluded from the analyses to better describe the general trend in the control group. All statistical analyses were performed with IBM SPSS Statistics 25.0. Continuous parameters are presented as median or median change with interquartile range [IQR], and categorical variables as proportions.
Results
Baseline characteristics
Eighteen patients (94.7%) from the original Oslo RDN study were included in this pre-specified sub-study, nine patients in the RDN group and nine patients in the control group. The baseline office heart rate in the RDN group was higher compared to the control group, otherwise there were no significant differences in baseline characteristics between the two groups (). Body mass index and body surface area in both groups did not change significantly between the different time points (data not shown).
Table 1. Baseline characteristics.
Hemodynamic changes in the RDN group
There was an overall change in SVRI in the RDN group, with 3,100 dyn*s*m2/cm5 [IQR 2,112–4,122] at baseline, 3,122 dyn*s*m2/cm5 [IQR 2,888–3,753] at three months and 2,412 dyn*s*m2/cm5 [IQR 2,138–2,841] at six months follow-up, p = 0.01 (). panels B-D shows the change in SVRI for each individual between the different time points. All patients in the RDN group experienced a reduction in SVRI from three to six months follow-up (−576 dyn*s*m2/cm5 [IQR −992 to −165], p = 0.01; ). Although the group change from baseline to three months follow-up was not significant (303 dyn*s*m2/cm5 [IQR 63 to 798], p = 0.16), shows that except for the one patient experiencing a large reduction, there is a trend towards a modest increase in SVRI in this time period. In addition, the change from baseline to six months follow-up was not significant (−186 dyn*s*m2/cm5 [IQR −920 to 244], p = 0.26), but suggests that half of the patients responded to RDN with an overall reduction in SVRI. Other changes in systemic hemodynamic variables in the RDN group are listed in . Of notice, heart rate increased with a median of 8 bpm [IQR 2 to 9] from three to six months follow-up (p = 0.02). The change in heart rate is illustrated in .
Figure 2. Individual changes in systemic vascular resistance index in the RDN group. Panel A shows the SVRI levels for each individual at each time point in the RDN group (n = 9). The other panels show the change in SVRI for each individual from baseline to three months follow-up (panel B, n = 8), from three to six months follow-up (panel C, n = 9) and from baseline to six months follow-up (panel D, n = 8), the median is marked with a horizontal line. *p < 0.01 on Wilcoxon signed rank test (n = 9). RDN: renal sympathetic denervation; SVRI: systemic vascular resistance index.
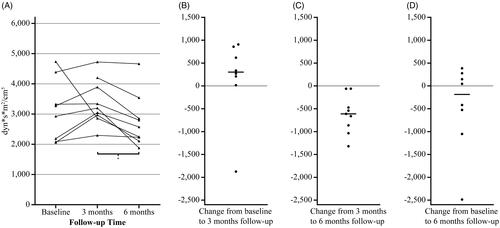
Table 2. Changes in hemodynamic variables in the RDN group.
The additional analysis from three to six months follow-up, including the ninth patient without baseline measurements, confirmed a substantial reduction in SVRI from 3,199 [IQR 2,915–4,046] to 2,574 dyn*s*m2/cm5 [IQR 2,170–3,198] (median change −611 dyn*s*m2/cm5 [IQR −949 to −267], p < 0.01). Supine mean arterial pressure (MAP) decreased from 110 [IQR 105–114] to 97 mmHg [IQR 90–109] with a median change of −11 mmHg [IQR −21 to −3], p = 0.02; supine systolic BP was reduced from 151 [IQR 147–163] to 137 mmHg [IQR 120–151] with a median change of −14 mmHg [IQR −22 to −3], p = 0.02 and supine diastolic BP changed from 88 [IQR 84–94] to 77 mmHg [IQR 73–85] with a median change of −10 mmHg [IQR −16 to −4], p = 0.01. All supine BP levels were reduced despite small increases in heart rate (58 bpm [IQR 50–64] at three months and 63 bpm [IQR 57–67] at six months with a median change of 7 bpm [IQR −1 to 9], p = 0.04) and in cardiac index (2.8 L/min/m2 [IQR 2.2–2.9] at three months and 3.0 L/min/m2 [IQR 2.3–3.4] at six months with a median change of 0.2 L/min/m2 [IQR 0.0 to 0.7], p = 0.04). Stroke index did not change (p = 1.00).
One patient in the RDN group stopped taking telmisartan and hydrochlorothiazide in the study period due to episodes of postural hypotension, and there were otherwise no medication changes in this group during the six months follow-up period [Citation10].
Hemodynamic changes in the control group
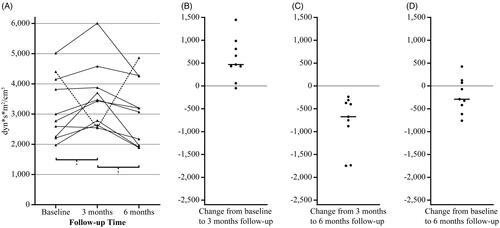
Individual changes in SVRI in the control group are illustrated in , which shows the changing pattern with an increase in SVRI from baseline to three months follow-up, and then a decrease from three to six months follow-up with one strongly divergent patient (ticked line in panel A, not included in further statistical analysis). The SVRI level in the control group excluding the divergent patient (n = 9) was 2,773 dyn*s*m2/cm5 [IQR 2,234–3,984] at baseline, 3,470 dyn*s*m2/cm5 [IQR 2,713–4,230] at three months and 3,071 dyn*s*m2/cm5 [IQR 1,935–3,731] at six months follow-up, p < 0.01 for overall change. The increase from baseline to three months follow-up was significant (470 dyn*s*m2/cm5 [IQR 244 to 898], p = 0.01), as well as the decrease from three months to six months follow-up (−674 dyn*s*m2/cm5 [IQR −1,309 to −340], p < 0.01), while the change from baseline to six months follow-up was not significant (−291 dyn*s*m2/cm5 [IQR −517 to 96], p = 0.17).
Figure 3. Individual changes in systemic vascular resistance index in the control group. Panel A shows the SVRI levels for each individual at each time point in the control group (n = 10). Ticked line represents the participant with a deviant SVRI pattern, i.e. large changes that diverge strongly in opposite directions from the general pattern. The other panels (n = 9) show the change in SVRI for each individual from baseline to three months follow-up (panel B), from three to six months follow-up (panel C) and from baseline to six months follow-up (panel D), the median is marked with a horizontal line. *p = 0.01, †p < 0.01 on Wilcoxon signed rank test (n = 9). SVRI: systemic vascular resistance index.
contains other hemodynamic changes in the control group, the change in heart rate is illustrated in , and shows all hemodynamic changes in the control group including the divergent patient.
Table 3. Changes in hemodynamic parameters in the control group.
Discussion
Interpretation of the results – the RDN group
Increased SVRI has for long been termed the “Hallmark of Hypertension” as it explains elevated BP in a majority of hypertensive patients [Citation7]. We have demonstrated for the first time in a randomised controlled trial that RDN reduces SVRI in patients with true TRH, i.e. adherence of medication was carefully assessed with witnessed intake of antihypertensive drugs prior to ambulatory BP measurements at inclusion, three and six months follow-up. Our hemodynamic measurements with the thoracic impedance HOTMAN System were non-invasive. We have extensive experience with this HOTMAN System used as a guide to individualise antihypertensive therapy in a previous multicentre randomised clinical trial proving similar BP control as achieved by clinical hypertension experts [Citation13].
Efferent renal sympathetic nerve trajectories can be responsible for the observed reduction in SVRI after RDN, through decreased secretion of renin, norepinephrine and other vasoactive substances [Citation22]. Also the afferent renal sympathetic nerve fibres might contribute to the observed effects through central modulation of peripheral sympathetic nerve system activity, including vasoconstriction [Citation22].
All supine BP levels were reduced in the additional analysis, and in our original study we demonstrated a significant decrease in ambulatory systolic and diastolic BP levels after both three and six months compared to screening visit in the RDN group [Citation10]. Furthermore, many Hypertension Excellence Centres including ours have reported that some patients undergoing RDN seem to respond significantly to the procedure [Citation20,Citation23,Citation24]. This could indicate that patients with TRH who have mainly high SVRI might benefit from RDN.
Interestingly, the demonstrated reduction in SVRI seems to be associated with simultaneous modest increases in heart rate and cardiac index that may have limited the BP reducing effects. Perhaps additional treatment with β-blockers in addition to RDN may prevent a possible reflex increase of heart rate, and potentiate the BP reducing effect of RDN. A sub-analysis of the SYMPLICITY HTN-3 trial on predictors of BP response after RDN found a borderline significant association between the use of β-blocker and reduction in office systolic BP levels although there was no association with the ambulatory BP changes [Citation25].
Another interesting aspect is the late treatment response, as almost all changes of hemodynamic variables in the resting supine position occurred from three to six months follow-up. The reduction in ambulatory BP levels, reported in our previous publication [Citation10], mainly occurred from screening visit to three months follow-up. One possible explanation could be a stronger effect of RDN on orthostatic BP compared to resting BP. Vuignier et al. demonstrated recently that RDN blunted the orthostatic stress-induced increase in norepinephrine and BP levels as well as changes in renal parameters, while there were few changes under unstressed conditions [Citation26].
Interpretation of the results – the control group
Medication in the control group was individually adjusted at each study visit in order to normalise the hemodynamic deviations. Several intermediate hemodynamic changes in the control group probably reflect the variety of effects from changes in different medication classes at several time points, although the reduction in SVRI visualised at 6 months seems to be the main mechanism for BP reduction.
Some trials have demonstrated the usefulness of hemodynamic profiling combined with a treatment algorithm for hypertensive patients with other impedance cardiography devices [Citation14]. However, our previous study on hemodynamic profiling with the HOTMAN system to guide the antihypertensive therapy in each individual patient provided similar office and ambulatory BP changes as achieved by clinical hypertension experts [Citation13], although home BP was reduced more in the group with therapeutic decisions based on the HOTMAN measurements [Citation27]. Based on the small additional value of HOTMAN measurements to guide therapy in difficult-to-control hypertension, we cannot recommend its application in general clinical practice yet, but we do believe the HOTMAN measurements are of pathophysiological interest in research, as used in the present study. However, we recommend more trials to evaluate its application and benefit in the setting of general practice.
Similar changing patterns in both groups
The original study was designed to evaluate the BP reducing effects of RDN compared with the best possible alternative treatment available, and it was considered unethical to let one group of these high-risk patients remain further untreated for a half-year. Due to multiple and individual drug changes in the control group we have not performed a statistical head-to-head comparison of the hemodynamic changes between the two groups.
However, and , and show that SVRI and heart rate have similar changing patterns in both groups. From baseline to three months follow-up, the heart rate was reduced and there was a trend towards a modest increase in SVRI in the RDN group. The heart rate tended to decrease while SVRI increased in the same period in the control group.
From three to six months follow-up, both groups experienced a substantial reduction in SVRI and simultaneous increases in heart rate. Thus, the effect of RDN on SVRI and heart rate is almost equal to the careful selection of antihypertensive drugs and multiple dose titrations based on the hemodynamic status measured with impedance cardiography.
The change in SVRI between baseline and 6 months was not significant in either group. At baseline, impedance cardiography is an unfamiliar procedure for most patients, and the information that the procedure involves trans-thoracic transfer of a low magnitude electrical current (although unnoticeable) could trigger nervousness and a fight-flight response. A fight-flight response with elevated sympathetic activation leads to increased heart rate and skeletal muscle vasodilation as seen in both groups at baseline [Citation28]. At the three months follow-up the patients are more familiar with the procedure, and SVRI and heart rate are returned to their general hypertensive pathophysiological state with higher SVRI level and lower heart rate compared to baseline. From three to six months follow-up, the treatments in both groups can explain the subsequent reduction in SVRI, and a reflex increase in heart rate.
We have confirmed adherence prior to inclusion and during the study course with a direct method that is not prone to manipulation by the patient; witnessed intake of antihypertensive drugs immediately prior to ambulatory BP measurements. Drug adherence is dynamic, and witnessed intake gives only a “snapshot” image of adherence on that day and not over time. Unfortunately, all methods that control for long-term adherence, e.g. questionnaires and electronic pillbox, are susceptible to patient manipulation and hence not fully reliable [Citation29,Citation30]. Although the patients could be less adherent between study visits, the impedance cardiography measurements were definitively influenced by the acute effects of the antihypertensive drugs, as they were performed several hours (on the same day) after the witnessed intake of antihypertensive drugs at three and six months follow-up.
Previous knowledge of changes in systemic vascular resistance after RDN
We have identified three previous studies examining hemodynamic changes after RDN in patients with apparent TRH, all were uncontrolled, neither excluded patients with poor adherence before inclusion [Citation31–33], and one study did not require elevated ambulatory BP levels prior to inclusion [Citation32].
One study with a short follow-up of only six weeks did not find any changes in systemic vascular resistance or other hemodynamic parameters except office BP [Citation31]. Another study demonstrated reduced systemic vascular resistance and 24 h ambulatory BP after six months, while heart rate and cardiac output remained unchanged [Citation32]. In the last study, systemic vascular resistance and 24 h ambulatory BP decreased after three, six and twelve months, while there was no change in cardiac output (neither heart rate nor stroke volume was reported) [Citation33]. The changing pattern of hemodynamic variables is thus different from our findings with an initial increase followed by a decrease in SVRI. This could partly be explained by the method of measurement, as the previous studies estimated systemic vascular resistance from either a finger or brachial pressure signal. We have discussed above that being informed that an electrical current will be sent through the thorax during impedance cardiography could elicit a fight-flight response with skeletal muscle vasodilation at baseline. We can only speculate that the use of peripheral cuff-based pressure signals will not induce a fight-flight reaction to the same extent. Furthermore, different number of radiofrequency ablations per renal artery, and the body position during the hemodynamic assessment could also influence the different results. provide more details on the differences between the studies. In concordance with the previous trials with similar follow-up time as ours [Citation32,Citation33], ambulatory BP levels were reduced from baseline to six months follow-up, as reported in our previous publication [Citation10].
We have thus demonstrated a reduction in SVRI in a more careful selection of patients with true TRH; common confounding issues such as poor adherence and white coat hypertension have less hampered our study.
Limitations
As a sub-study of a randomised clinical trial, our results should be considered exploratory, although pre-specified analyses could be considered somewhat more substantial than just hypothesis generating.
A moderate number of participants was included because we stopped the original study early after an interim analysis showed superior BP reducing effects in the control group [Citation10]. All participants were Caucasians. Our data may thus need to be confirmed in larger studies, including other ethnicities.
Conclusion
We have for the first time investigated the change in SVRI after RDN in patients with true TRH, i.e. the use of a qualifying ambulatory BP measurement immediately after witnessed intake of antihypertensive drugs, which can exclude poorly compliant patients and patients with white coat hypertension before inclusion. In this group of true treatment-resistant hypertensive patients, we showed that RDN lowers BP by reducing SVRI. The SVRI decrease is of similar size as in the control group with careful individual selection of antihypertensive drugs and multiple dose titrations. Thus, our results provide a possible explanation for the modest but relevant BP reduction demonstrated in recent well-designed studies on RDN.
Supplemental Material
Download PDF (212.1 KB)Acknowledgements
The authors gratefully acknowledge research bioengineer Vibeke Kjaer at the Section of Cardiovascular and Renal Research, Oslo University Hospital, Ullevaal for her valuable contribution to the study.
Disclosure statement
The authors have no conflicts of interest to declare.
Additional information
Funding
References
- Azizi M, Schmieder RE, Mahfoud F, et al. Endovascular ultrasound renal denervation to treat hypertension (RADIANCE-HTN SOLO): a multicentre, international, single-blind, randomised, sham-controlled trial. Lancet. 2018;391(10137):2335–2345.
- Kandzari DE, Bohm M, Mahfoud F, et al. Effect of renal denervation on blood pressure in the presence of antihypertensive drugs: 6-month efficacy and safety results from the SPYRAL HTN-ON MED proof-of-concept randomised trial. Lancet. 2018;391(10137):2346–2355.
- Townsend RR, Mahfoud F, Kandzari DE, et al. Catheter-based renal denervation in patients with uncontrolled hypertension in the absence of antihypertensive medications (SPYRAL HTN-OFF MED): a randomised, sham-controlled, proof-of-concept trial. Lancet. 2017;390(10108):2160–2170.
- Kjeldsen SE, Esler MD. Take a blood pressure pill or undergo renal denervation? Lancet. 2018;391(10137):2298–2300.
- Kjeldsen SE, Fadl Elmula FEM, Persu A. Future of renal sympathetic denervation in the treatment of hypertension. J Am Coll Cardiol. 2019;73(13):1643–1645.
- Sardar P, Bhatt DL, Kirtane AJ, et al. Sham-controlled randomized trials of catheter-based renal denervation in patients with hypertension. J Am Coll Cardiol. 2019;73(13):1633–1642.
- Freis ED. Hemodynamics of hypertension. Physiol Rev. 1960;40:27–54.
- Lund-Johansen P. Hemodynamic effects of antihypertensive agents. Can Med Assoc J. 1983;128(1):21–23.
- Omvik P, Lund-Johansen P. Long-term hemodynamic effects at rest and during exercise of newer antihypertensive agents and salt restriction in essential hypertension: review of epanolol, doxazosin, amlodipine, felodipine, diltiazem, lisinopril, dilevalol, carvedilol, and ketanserin. Cardiovasc Drugs Ther. 1993;7(2):193–206.
- Fadl Elmula FE, Hoffmann P, Larstorp AC, et al. Adjusted drug treatment is superior to renal sympathetic denervation in patients with true treatment-resistant hypertension. Hypertension. 2014;63(5):991–999.
- Williams B, Mancia G, Spiering W, et al. 2018 Practice Guidelines for the management of arterial hypertension of the European Society of Cardiology and the European Society of Hypertension. Blood Press. 2018;27(6):314–340.
- Hjornholm U, Larstorp ACK, Andersen MH, et al. Directly observed therapy prior to ambulatory blood pressure measurement (DOT-HTN) in uncontrolled hypertensive patients - Effect on blood pressure, safety and patient perception. Blood Press. 2019;28(5):327–335.
- Fadl Elmula FE, Rebora P, Talvik A, et al. A randomized and controlled study of noninvasive hemodynamic monitoring as a guide to drug treatment of uncontrolled hypertensive patients. J Hypertens. 2015;33(12):2534–2545.
- Ferrario CM, Flack JM, Strobeck JE, et al. Individualizing hypertension treatment with impedance cardiography: a meta-analysis of published trials. Ther Adv Cardiovasc Dis. 2010;4(1):5–16.
- Taler SJ, Textor SC, Augustine JE. Resistant hypertension: comparing hemodynamic management to specialist care. Hypertension. 2002;39(5):982–988.
- Faini A, Omboni S, Tifrea M, et al. Cardiac index assessment: validation of a new non-invasive very low current thoracic bioimpedance device by thermodilution. Blood Press. 2014;23(2):102–108.
- Woltjer HH, Bogaard HJ, de Vries PM. The technique of impedance cardiography. Eur Heart J. 1997;18(9):1396–1403.
- Osypka MJ, Bernstein DP. Electrophysiologic principles and theory of stroke volume determination by thoracic electrical bioimpedance. AACN Clin Issues. 1999;10(3):385–399.
- Mancia G, De Backer G, Dominiczak A, et al. 2007 ESH-ESC Guidelines for the management of arterial hypertension: the task force for the management of arterial hypertension of the European Society of Hypertension (ESH) and of the European Society of Cardiology (ESC). Blood Press. 2007;16(3):135–232.
- Fadl Elmula FE, Hoffmann P, Fossum E, et al. Renal sympathetic denervation in patients with treatment-resistant hypertension after witnessed intake of medication before qualifying ambulatory blood pressure. Hypertension. 2013;62(3):526–532.
- Esler MD, Krum H, Sobotka PA, et al. Renal sympathetic denervation in patients with treatment-resistant hypertension (The Symplicity HTN-2 Trial): a randomised controlled trial. Lancet. 2010;376(9756):1903–1909.
- DiBona GF, Kopp UC. Neural control of renal function. Physiol Rev. 1997;77(1):75–197.
- Persu A, Azizi M, Jin Y, et al. Hyperresponders vs. nonresponder patients after renal denervation: do they differ? J Hypertens. 2014;32(12):2422–2427.
- Azizi M, Sapoval M, Gosse P, et al. Optimum and stepped care standardised antihypertensive treatment with or without renal denervation for resistant hypertension (DENERHTN): a multicentre, open-label, randomised controlled trial. Lancet. 2015;385(9981):1957–1965.
- Kandzari DE, Bhatt DL, Brar S, et al. Predictors of blood pressure response in the SYMPLICITY HTN-3 trial. Eur Heart J. 2015;36(4):219–227.
- Vuignier Y, Grouzmann E, Muller O, et al. Blood pressure and renal responses to orthostatic stress before and after radiofrequency renal denervation in patients with resistant hypertension. Front Cardiovasc Med. 2018;5:42.
- Talvik A, Rebora P, Heinpalu-Kuum M, et al. Non-invasive hemodynamic monitoring as a guide to drug treatment of uncontrolled hypertensive patients: effects on home blood pressure in the BEAUTY study. Blood Press. 2018;27(6):368–375.
- Pike TL, Elvebak RL, Jegede M, et al. Forearm vascular conductance during mental stress is related to the heart rate response. Clin Auton Res. 2009;19(3):183–187.
- Eskas PA, Heimark S, Eek Mariampillai J, et al. Adherence to medication and drug monitoring in apparent treatment-resistant hypertension. Blood Press. 2016;25(4):199–205.
- Berra E, Azizi M, Capron A, et al. Evaluation of adherence should become an integral part of assessment of patients with apparently treatment-resistant hypertension. Hypertension. 2016;68(2):297–306.
- van Brussel PM, Eeftinck Schattenkerk DW, Dobrowolski LC, et al. Effects of renal sympathetic denervation on cardiac sympathetic activity and function in patients with therapy resistant hypertension. Int J Cardiol. 2016;202:609–614.
- Ewen S, Cremers B, Meyer MR, et al. Blood pressure changes after catheter-based renal denervation are related to reductions in total peripheral resistance. J Hypertens. 2015;33(12):2519–2525.
- Ott C, Franzen KF, Graf T, et al. Renal denervation improves 24-hour central and peripheral blood pressures, arterial stiffness, and peripheral resistance. J Clin Hypertens. 2018;20(2):366–372.