
Abstract
Purpose
Assessment and monitoring of changes in microcirculatory perfusion, perfusion dynamic, vessel structure and oxygenation is crucial in management of arterial hypertension. Constant search for non-invasive methods has led the clinical focus towards the vasculature of the retina, which offers a large opportunity to detect the early phase of the functional and structural changes in the arterial hypertension and can reflect changes in brain vasculature. We review all the available methods of retinal microcirculation measurements including angiography, oximetry, retinal vasculature assessment software, Optical Coherence Tomography Angiography, Adaptive Optics and Scanning Laser Doppler Flowmetry and their application in clinical research.
Materials and methods
To further analyse the applicability of described methods in hypertension research we performed a systematic search of the PubMed electronic database (April 2020). In our analysis, we included 111 articles in which at least one of described methods was used for assessment of microcirculation of the retina in hypertensive individuals.
Results
Up to this point, the methods most commonly published in studies of retinal microcirculation in arterial hypertension were Scanning Laser Doppler Flowmetry followed shortly by Optical Coherence Tomography Angiography and retinal vasculature assessment software.
Conclusions
While none of described methods enables the simultaneous measurement of all microcirculatory parameters, certain techniques are widely used in arterial hypertension research, while others gain popularity in screening.
Introduction
Exploration of microperfusion is crucial for clinical research and early detection of microvascular changes in arterial hypertension, affecting 24.1% of males and 20.1% of females worldwide [Citation1]. Arterial hypertension is also one of the leading risk factors for heart failure, which already affects at least 26 million people worldwide and which prevalence steadily rises with the population aging [Citation2]. Microcirculatory disorders result from dysregulation of multiple cellular processes and vessel wall remodelling in arterioles is a major vascular hallmark of hypertension associated with premature end-organ damage [Citation3–7].
The most obvious and most accurate method of evaluation of microvascular structure and function is pressure or wire micromyography [Citation8,Citation9]. Nevertheless, the greatest limitation of this method is its invasiveness which according to the 2013 European Society of Hypertension/European Society of Cardiology Guidelines ‘makes this approach unsuitable for general use’ [Citation10]. Therefore, clinical focus has shifted towards the retina [Citation11–14], where those changes can be observed directly and non-invasively due to morphological transparency of eye structures, such as the cornea, aqueous humour, lens and vitreous body [Citation15].
The eye is supplied by two vascular systems, which differ in structure and function. Like in brain, retinal capillaries extending from the central retinal artery to the central retinal vein have endothelial tight junctions and form an inner blood–retina barrier, strongly resembling blood–brain barrier. The retinal capillaries are covered by astrocytes, in capillary bifurcations blood flow is regulated by pericytes [Citation16]. In addition, the retinal vessels are not innervated by any efferent nerve fibres and fulfil primarily nutritional function in neural tissue. The retinal microperfusion is regulated by local and myogenic autoregulation. On the other hand, choroid vessels contain gap junctions, are innervated by fibres from the ciliary ganglion, and are separated from the retina by pigment epithelium – the external blood–retina barrier. Additionally, to the metabolic support of the pigment epithelium, photoreceptors, horizontal and bipolar cells, choriocapillaries play mostly thermoregulatory function, since the melanin in pigment epithelium absorbs light, what raises local temperature in the tissue.
Blood flow in the choroid is several times higher than in retinal vessels. The difference between arterial and venous blood oxygenation in choroid is approximately 4% – similar to skin, whereas in retina it is approximately 37% – similar to brain [Citation15,Citation17,Citation18]. Retinal and choroidal microperfusion system differs also in morphology, function, regulation, perfusion, and metabolic rates. The intact pigment epithelium is a sufficient barrier for most retinal perfusion measurements and is not affected by choroidal circulation [Citation19]. Therefore, retinal perfusion may provide a model for non-invasive examinations of cerebral vascular perfusion [Citation20–24].
The microcirculatory system of the retina is not homogenic. The arterioles with the largest diameter are located temporal superior and inferior to the optic disc. The capillary rarefaction increases towards the macula but there are no capillaries in the fovea [Citation15]. Therefore, retinal microcirculation measurements are commonly located in the juxtapapillary position – approximately 2 mm to the optic disc [Citation24,Citation25]. Depending on the invasiveness of the methodology, measurements of retinal perfusion can be divided into: invasive and non-invasive methods.
Invasive methods
Fluorescein and ICG angiography
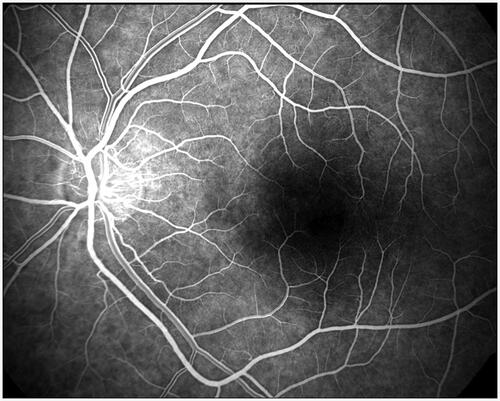
The first retinal vessels imaging was performed by fluorescent angiography technique in the 60 s [Citation26,Citation27]. It allowed for the parameters such as Arteriovenous Passage Time (AVP), Mean Dye Velocity (MDV) and Arm-Retina Time (ART) to be measured [Citation28,Citation29]. Today angiography is still used in ophthalmology as a diagnostic test of patency and leak of retinal or choroidal vessels, assessment of areas of neovascularization as well as inadequate perfusion and for measurement of the blood passage time through the retinal capillaries (). Although the method is reported to be safe, the fluorescent angiography requires intravenous infusion of fluorescein or indocyanine green (ICG), which disqualifies it as a non-invasive approach.
Figure 1. Capillary phase of retinal fluorescent angiography. Source: courtesy of B. Link.
Intravital microscopy
Intravital microscopy uses fluorescent-labelled microspheres, leukocytes or RBCs for direct visualisation of flow dynamics in retina [Citation30,Citation31]. Due to its straightforwardness this approach can give precise measurements. However, the method is not only invasive and cost-intensive, but also it has never been applied to humans [Citation30].
Non-invasive methods
Blue-field method
Blue-field method was the first non-invasive study of retinal blood flow [Citation32–34]. It was based on the entoptic phenomenon of a visual perception of leukocytes moving in retinal capillaries (FLC – flying corpuscles). However, this method was highly subjective and of poor accuracy [Citation32–34].
Laser Doppler velocimetry and flowmetry
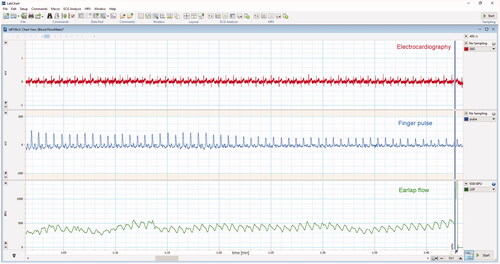
Laser Doppler velocimetry and flowmetry were the first methods based on Doppler effect, which describes the relationship between the shift of frequency and relative velocity between the sender and the receiver as proportional [Citation35]. Laser Doppler velocimetry (LDV) allowed only for the measure of absolute RBC velocity in retinal microcirculation [Citation36] and was only suitable for estimation of retinal blood flow at one point or for measurement of its fluctuation in time caused by stimulation or pulsatory haemodynamics [Citation37]. Laser Doppler Flowmetry (LDF), thanks to comparison between signal reflected by blood cells and by vessel walls [Citation30], enabled relative average velocity, number and flux of RBCs in a tissue to be measured () [Citation38,Citation39]. However, the high heterogeneity of retinal vasculature and inability to re-examine the same point of the retina resulted in a limitation of application of this technology to microperfusion studies only in the human choroid tissue below macula [Citation40].
Figure 2. Simultanous measuremnt of EKG, finger pulse and earlobe blood flow with Laser Doppler Flometry (ADintrument Pty Ltd, New South Wales/Autralia) after 10 min rest in lying position (by U.S.).
Laser Doppler Flowmetry is however still widely used to assess blood flow, especially in dentistry, dermatology and surgery [Citation41–45]. This method allows for easy measurement of blood flow directly from the tissue surface and detects fast changes of perfusion during surgery [Citation41–45]. Studies have also shown that this method can be successfully applied regardless of patient’s skin melanin concentration [Citation46]. The most important shortcoming of this approach however, is its insufficient evaluation especially regarding reproductivity in a test-retest approach, and uncertainty of the measurement depth [Citation47]. Therefore, it is most commonly used in continuous manner, intraoperative or during stimulation studies.
Scanning laser Doppler flowmetry
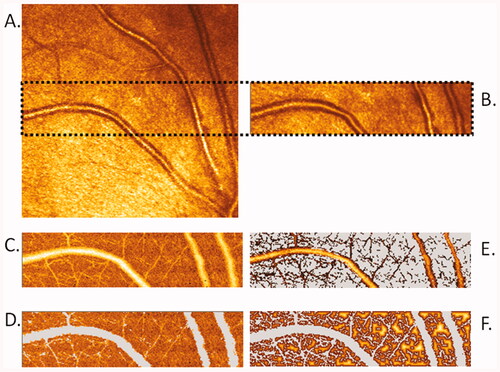
Measurements by Heidelberg Retina Flowmetry (HRF), with Scanning Laser Doppler Flowmetry (SLDF) technology, developed by Heidelberg Engineering GmbH/Germany, started in the 1994 [Citation48]. Scanning Laser Doppler Flowmetry allows non-mydriatic parapapillary retinal microperfusion study with the simultaneous arteriolar morphology assessment in the same location in arterioles with a diameter larger than 70 µm () [Citation15,Citation48–50]. The evaluation of the coefficient of variation, although consistently below 10% for all measured parameters, showed a strong influence of biological variability on the flow values in Scanning Laser Doppler Flowmetry [Citation48,Citation51,Citation52]. Therefore, to minimise the biological variability in the comparative studies, patients should be examined at the same time of the day and after adjusting the vascular haemodynamics by resting in sitting position.
Figure 3. Images scanned by Heidelberg Retina Flowmetry and calculated by Automatic Full Field Perfusion Image Analyser (AFFPIA; by J.M.H.). (A) Life image with area of scanning (marked by dots). (B) Reflexion image. (C) Perfusion image. (D) Perfusion area selected for analysis with exclusion of saccades, over- and underexposed pixels, as well as vessels with diameter over 20μm. (E) Automatic calculated image of vessels with diameter over 10μm. (F) Automated calculated image of intercapillary area.
Scanning Laser Doppler Flowmetry technology combines confocal scanning laser tomography and laser Doppler flowmetry technique. The laser beam scans consecutive retina volume of 2600 µm length × 640 µm high × 300 µm depth in 2 s. Then the software averages the depth measurements for pixels with the same length and high respectively, and the results are given on the two-dimensional plane with image resolution of one pixel by 10 μm × 10 μm (260 × 64 pixels with averaged depth). Each scanned image line can be attributed to the time value and mean flow of the line. This allows reliable determination of the pulsatile flow curve measured in average during 2 s heartbeat [Citation53]. Two laser wavelengths: 670 nm and 780 nm can be used in this method, but in all studies of Schmieder RE or Michelson G groups using Scanning Laser Doppler Flowmetry the 670 nm laser wavelength was used [Citation48–50,Citation53]. After scanning, the software automatically generates the images of: intensity of the reflected light, Doppler shift 125–500 Hz, Doppler shift 125–1000 Hz, volume, flow, and velocity. Unit of the flow value is a relative arbitrary unit [AU], resulting from the unfeasibility of measurement calibration [Citation49].
In 1998, Automatic Full Field Perfusion Image Analyser (AFFPIA) software for Scanning Laser Doppler Flowmetry images analysis was developed by Michelson et al. [Citation49] and updated by Schmieder group [Citation52].
Wall-to-lumen ratio
The first non-invasive measurement of morphological parameter called Wall-to-Lumen Ratio (WLR) in retinal arterioles in humans was developed and reported by the R.E. Schmieder group in 2007 [Citation50]. WLR study showed significant increase with age in untreated normotensive men, as well as in poorly controlled patients compared to well-controlled patients. Similarly, significant increase has been found in post-stroke patients compared with normotensive persons within the same age groups [Citation50]. The results of WLR studies in arterial hypertension agreed with Schiffrin et al. [Citation54] study of morphological arteriolar wall remodelling obtained by the adipose tissue biopsy. After Akima interpolation application for improvement of the vessel diameter accuracy, the test-retests, inter- and intra-observer reliability of the calculated WLR showed a coefficient of variation of 10% [Citation52].
Adaptive optics
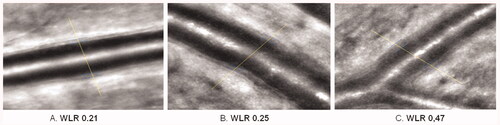
In 2014, E. Koch et al. reported the results of independent research of non-invasively measured WLR in retinal arterioles in human by Adaptive Optics (AO; ) [Citation9,Citation55–57]. The study confirmed the results of Scanning Laser Doppler Flowmetry measurements demonstrating that Adaptive Optics is an alternative method for the morphological studies of retinal arterioles and remodelling. However, this method is not suitable for the investigations of retinal microperfusion, which represents a major limitation. The reliability of structural parameters measurements performed with Adaptive Optics is similar (CV <10%) to Scanning Laser Doppler Flowmetry [Citation9,Citation58,Citation59]. Rtx1 camera enables the clinical ultrahigh-resolution imaging for examining cones, lamina cribrosa, pathological structures (microhaemorrhage, microaneurysm, capillary narrowing etc.), and retinal blood vessels morphology (inner- and outer-diameter, wall thickness, wall to lumen ratio (WLR), and wall cross section area) [Citation56,Citation57]. In contrary to Scanning Laser Doppler Flowmetry, rtx1 measures the wall thickness of arterioles directly (). By compensating for the wavefront distortion that results from atmospheric turbulence, Adaptive Optics was the first computer-based technology developed in the telescopic astronomy that overcome the turbulence, which has been a serious detriment to optical performance [Citation60]. In 1989–1997, Liang et al. [Citation61] adapted it for measurements in ophthalmology. Currently available Imagine Eyes Orsay/France rtx1 Adaptive Optics-based fundus camera uses monochromatic flood-illumination 750/840 nm diodes for imaging of 1° field of the cone mosaic with clear cones in the retina. The measured field of 1.2 mm × 1.2 mm is averaged of 20 images measured during 2 or 40 images in by pixel-resolution 0.8 × 0.8µm. Resulting image enables the visualisation of photoreceptors, capillaries, arterioles, and venules. The rtx1 camera allows morphological study in arterioles over 20 µm diameter [Citation58].
Figure 4. Automatic measurement of retinal arteriole structures by adaptive optics rtx1. Left image: selection of vessel part for analysis; right image: enlarged area of measurement with marked part of directly measured arteriolar wall thickness, inner- and outer diameters. WLR and WCSA are calculated by integrated software. The measurement was taken from right eye temporal superior to optic nerve of 35years old woman with normal blood pressure without arterial hypertension therapy (by J.M.H.).
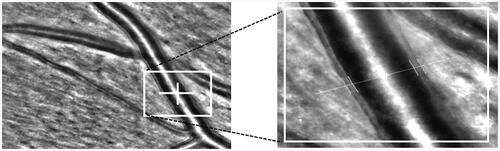
Figure 5. Comparison of retinal arteriolar WLR measured in 3 male patients with normal BMI and similar physical activity (over 300 min/week) by adaptive optics rtx1. (A) Left eye, retina temporal superior from optic nerve of 60 years old man with optimal blood pressure without arterial hypertension therapy. (B) Right eye, retina temporal superior from optic nerve of 61 years old man with measured normal blood pressure with consequently arterial hypertension therapy. (C) Left eye, retina temporal superior from optic nerve of 60 years old man with arterial hypertension stage 2 without arterial hypertension therapy. All measurements and analysis were done in the same conditions (5 min after rest in sitting position in dark room with 23C room temperature without mydriasis; by J.M.H.).
Optical coherence tomography angiography
Optical Coherence Tomography Angiography (OCTA) is a diagnostic imagining method that employs classical Optical Coherence Tomography technology together with motion-contrast imagining of volumetric blood flow. The measurement is based on motion contrast produced by moving RBCs visualised on series of repeated B-scans. This approach is an alternative for classic fluorescein or ICG angiography, which does not require dye injections and allows for the depth-resolved visualisation of retinal and choroidal vasculature [Citation62,Citation63]. The depth information of acquired flow data is one of the biggest advantages of this method [Citation64]. A huge disadvantage of Optical Coherence Tomography Angiography is, however, a relatively long time of data acquisition, in which steady fixation of the eye is necessary to produce a high-quality image [Citation65–67]. A recent study held by Holmen et al. [Citation66] show that presence of at least one artefact can be expected in 97.3% images while severe artefacts can be found in 53.5% images. In another study Say et al. [Citation67] assessed the prevalence of different types of artefacts showing that the most common major artefacts were following: loss of focus (55%), broad blink lines (37%), motion artefact (26%), specular dot (25%) and edge duplication (8%). Optical Coherence Tomography Angiography allows for measurements of retinal capillary density (RCD) and non-perfused areas (R-NPA), choriocapillaris flow area, optic nerve head capillary density.
Doppler optical coherence tomography
Doppler Optical Coherence Tomography (DOCT) or Dual beam Fourier-domain Doppler optical coherence tomography (Doppler FD-OCT) is a variation of Optical Coherence Tomography. It aims to combine measurements of blood flow with assessment of vascular structure [Citation68,Citation69]. This method can be used to measure total perfusion in retinal arterioles and venules [Citation68,Citation69], what cannot be done with the use of Scanning Laser Doppler Flowmetry. However Doppler FD-OCT enables only sequential not simultaneous flow measurement in retinal vessels, which is one of its greatest limitations.
Laser speckle flowgraphy
Laser speckle flowgraphy (LSF) is based on the laser speckle phenomenon. It visualises microcirculation of the retina through analysis of a random interference pattern of laser light scattered by tissue as compared to the pattern of laser light scattered by moving RBCs [Citation37]. Originally, it allowed for two-dimensional and quantitative measurement of retinal blood flow and assessment of following parameters: the Normalised Blur (NB), representing an index of blood velocity, the Square Blur Ratio (SBR), estimating blood velocity, and Mean Blur Rate (MBR), evaluating blood cell velocity and volume [Citation64,Citation70]. Perhaps the greatest shortcoming of this method is lack of separate measurement of choroidal and retinal blood flow without the use of blue-component laser, which can be obtained only with the use of confocal scanning. Another disadvantage is that, similarly as in Scanning Laser Doppler Flowmetry, the obtained values are given in arbitrary units [Citation70]. However, in contrary to Scanning Laser Doppler Flowmetry, which measures the perfusion on the basis of Doppler shift of returning laser light depending directly on the movement of blood cells, Laser Doppler Flowmetry measures the perfusion on the basis of blur rate of returning light, which may be affected by unpredictable factors caused by pathological changes in the eye (e.g. cotton wools, hard exudates, or haemorrhages)
Mean blur rate
Mean Blur Rate (MBR) is an index of ocular blood flow expressed in arbitrary units that was proven to be linearly correlated with actual blood flow in vivo [Citation71] and to accurately reflect blood flow in the deep areas of optic nerve head [Citation72], what is a definitive advantage of this method as compared to Optical Coherence Tomography Angiography [Citation64].
This parameter can be further divided into vessel-area Mean Blur Rate (MV) and tissue-area Mean Blur Rate (MT). In a recent study Kiyota et al. [Citation64] investigated relationship between those parameters and peripapillary relative intensity (PRI) measured with Optical Coherence Tomography Angiography. They documented relationships between following parameters: vessel-area Mean Blur Rate, mainly reflecting PRI in superficial retina, and tissue-area Mean Blur Rate, reflecting peripapillary relative intensity in superficial choroid as well as peripapillary relative intensity in superficial retina, although to a lesser extent. It was also documented that neither vessel-area Mean Blur Rate nor tissue-area Mean Blur Rate correlated with peripapillary relative intensity in dip choroid. Those findings however, cannot erase the major limitation of Laser speckle flowgraphy regarding its lack of depth information.
Pulse waveform
Novel parameter measured with laser spackle flowgraphy is pulse waveform, which combines five parameters, including: 1) the asymmetry of the waveform’s distribution, 2) volume of blood flow maintained in the vessel between heartbeats, termed as Blow-Out Score (BOS), 3) half duration of a heartbeat, measured as full duration at half maximum of the waveform and termed as Blow-Out Time (BOT), 4) rising rate and 5) falling rate [Citation73]. Pulse waveform measurement was assessed to be reproductible [Citation74] and some correlation between measured parameters and age as well as left ventricular systolic and diastolic function have been reported [Citation73,Citation75]. Pulse wave of retinal microperfusion was explored by Harazny et al. [Citation53] using Scanning Laser Doppler Flowmetry in patients with therapy resistant hypertension.
Retinal function imager
Retinal functional imager (RFI, Optical Imaging Ltd. Rehovot/Israel) is a quantitative imaging system that enables the estimation of retinal blood flow velocity, measurement of oxygen concentration as well as visualisation of retinal microvasculature. This approach is based on changes in reflectance of blood vessels, caused by passing RBCs, which allows for the detection of microvessels [Citation76,Citation77]. Due to fractal analysis, high-resolution images obtained with Retinal functional imager can be further used to analysis of morphological state of ocular microcirculation [Citation78]. The method has already been assessed to be highly reproductible [Citation79] and the measured parameters were proven to significantly correlate with the central retina volume, measured by Optical Coherence Tomography [Citation80], however Retinal functional imager has some limitations. One of them is the inability to perform measurement of retinal blood flow, as it is not possible to measure vessels morphology with Retinal functional imager. Similarly, to Laser speckle flowgraphy, with Retinal functional imager it is also impossible to determine the exact depth of measurement and therefore distinguish between retinal and superficial choroidal vessels.
Retinal oximetry
The oximetry was first utilised for retinal measurements by Hickam et al. [Citation81,Citation82]. The principle of this method is based on the relative light intensity difference at wavelengths of different oxygen-sensitivity, of which one is used as reference (isosbestic) and the other is sensitive to the changes in oxygen saturation (non-isosbestic). Retinal oximeters are based on fundus cameras used to acquire images with two different light wavelengths [Citation17,Citation83,Citation84]. Two leading, commercially available systems, which have been proven to provide equally reliable measurements [Citation85], are Vesselmap and Oxymap. Oxymap (Oxymap ehf, Reykjavik, Iceland) uses two cameras (1600 × 1200 square pixels) with attached beam splitter to simultaneously capture two images with 50° fields of view, with the light wavelengths of 586 nm, as oxygen insensitive component, and 605 nm, as oxygen sensitive component of the measurement [Citation17,Citation83,Citation86]. The Vesselmap (Imedos, Jena, Germany) on the other hand, is equipped with one digital fundus camera and a double-band pass filter allowing for transition of light at 548 ± 10 nm (oxygen insensitive) and at 610 ± 10 nm wavelength (oxygen sensitive). Images obtained with this system are of 30° or 50° field of view [Citation87].
Although retinal oximetry measures neither structure nor function of the capillaries directly, it can still provide valuable and reliable information about retinal tissue metabolism [Citation88–90]. Obtained measurements correlate directly with severity of ocular changes such as the extent of peripheral retinal ischaemia and macular oedema thickness. It has been documented that retinal vessel oxygen saturation of haemoglobin is affected by vessel narrowing and can be successfully used in studies of vessel occlusion, local as well as systemic changes in oxygen saturation, nervous system diseases and ocular conditions such as diabetic retinopathy or glaucoma [Citation17,Citation91–94]. However, it should be noted that factors such as age and light intensity may also affect the outcomes [Citation17,Citation86].
Pneumotonometry and laser interferometry
Pneumotonometry for assessment of pulsatile ocular blood flow (POBF) and laser interferometry for pulsatile blood flow both assess the ocular blood flow by measuring pulse amplitude during cardiac cycle [Citation95]. These methods measure relative pulsatile changes in intraocular pressure and in corneo-retinal distance (fundus pulsation), respectively [Citation30]. Those approaches, although are non-invasive and useful in ophthalmology, fall short in terms of accuracy of microcirculation measurements, as they enable only the measurement of total ocular blood flow.
Colour Doppler imaging
Colour Doppler Imaging is a non-invasive ultrasound procedure that enables simultaneous two-dimensional imaging of ocular structure and blood flow velocity [Citation96,Citation97]. This approach is proven to be of high value in ophthalmology, as it can be used for quick, real-time visualisation of ocular structures regardless of the optical system transparency. Nevertheless, it is not particularly useful in microcirculation research, as the only vessels that can be reliably studied using this method are central retinal artery, posterior ciliary arteries, ophthalmic artery, and central retinal vein [Citation96].
Retinal vasculature assessment software
Retinal vasculature assessment software (RVAS) enables the evaluation of images obtained with fundus camera for retinal arterial and venous diameters (). It has been successfully applied in many studies such as Blue Mountains Eye Study [Citation98], Atherosclerosis Risk in Communities Study [Citation99] or Rotterdam Study [Citation100].
Figure 6. Fundus image of the retina (right eye; by J.P. and P.B.).
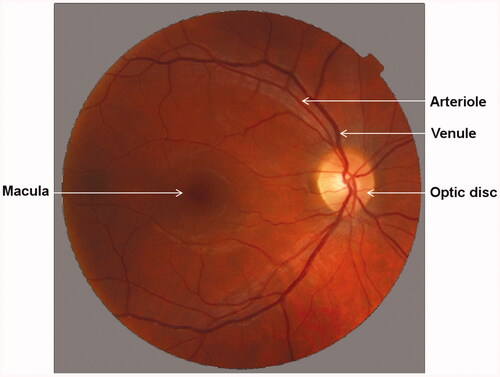
Currently few other software packages are available, including Zeiss Retinal Vessel Analyser (RVA), Interactive Vessel Analyser (IVAN), Vascular Assessment and Measurement Platform for Images of the Retina (VAMPIRE) and Singapore I Vessel Assessment (SIVA) [Citation101–104]. Those methods use Knudtson-Parr-Hubbard formula to standardise individual vessel calibres and therefore allow for measurement of central retinal arteriolar equivalent (CRAE) or central retinal venular equivalent (CRVE) and arteriole-to-venule ratio (AVR) – parameters describing averaged retinal arteriolar and venular width, and their proportion respectively [Citation105,Citation106]. Reproducibility of data obtained with those methods have been reported to be reliable both in individual as well as in comparison studies [Citation101,Citation102,Citation104].
The greatest advantage of this approach is the affordability and increasing portability of required equipment. Many hand-held as well as smartphone-based fundus cameras are currently available with studies showing their reliability, particularly in emergency and resource-limited settings [Citation107–109]. Smartphone-based assessment software for fundus images is also being developed, what can further reduce the cost of this type of screening [Citation110]. However, so far none of retinal vasculature assessment software is able to provide information about microcirculatory haemodynamics.
Non-retinal microperfusion measurements
Capillaroscopy
Capillaroscopy allows direct observation and visualisation of microcirculation, as well as evaluation of morphology and function of microvessels within the skin and mucous membranes [Citation111,Citation112]. With the use of optic microscope capillary number, size, shape, location, and deformity, and subpapillary venous plexuses can be assessed [Citation112,Citation113]. This approach however provides information neither about blood flow nor velocity that makes its application limited.
Thermography
Thermography allows for generation of temperature maps, which can serve as approximation of blood flow. It offers valuable information about the location and intensity of hypo-or hypervascularization, which can be used both in diagnostic process, as well as a measure of treatment effectiveness [Citation112,Citation114]. The relationship between blood flow and surface temperature measured by thermography is however too far complex to assess by this method. Moreover, it is unable to produce accurate and detailed data regarding microvascular morphology.
Application in systemic hypertension
To further analyse the applicability of described methods in hypertension research we performed a systematic search of the PubMed electronic database (April 2020). In our analysis, we included articles in which at least one of described methods was used for assessment of microcirculation of the retina in hypertensive individuals. After initial search, 283 records were evaluated for eligibility. Our exclusion criteria where: 1) paper language other than English (–13 records), 2) study not performed in humans (–57 records), 3) character of study (review or case report) (–15 records) and 4) focus on hypertensive disease other than arterial systemic hypertension (portal hypertension, ocular hypertension etc.) (–87 records). Resulting 111 publications were determined as eligible and included in the analysis ().
Table 1. Publications regarding non-invasive investigation of retinal microcirculation in hypertension, published between January 1994 and April 2020.
The data clearly shows that there is indeed a rising interest in research on microvascular anatomy and function in hypertension (), which seems to accelerate in recent years.
Figure 7. (A) Number of all published papers regarding microcirculation in retina in hypertensive individual, published between January 1994 and April 2020. (B) Number of all publications regarding microcirculation in retina in hypertensive individuals, published between January 1994 and April 2020, categorised by used method. (C) Number of publications regarding microcirculation in retina in hypertensive individuals, published in years 2014–2019, categorised by used method.
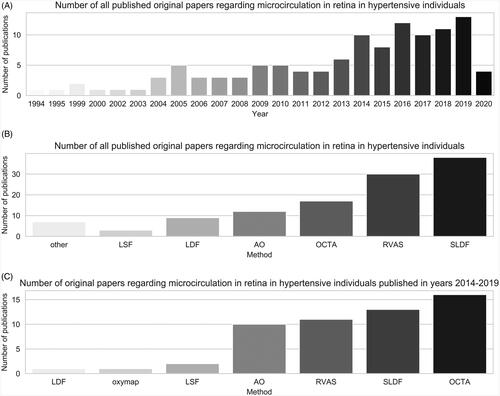
The most common method used in the studies is Scanning Laser Doppler Flowmetry (), as it accounts for 34.2% of all records. However, it should be noted that although research of retinal microcirculation in hypertension continues for decades, several methods have been developed only in the recent years, while others are no longer used. Therefore, evaluation of the data from the last 5 years (2014–2019) might better reflect the current applicability of described methods ().
Discussion
The most obvious criteria used in medical studies to compare scientific methods are their reproducibility and possibility to acquire values comparable to gold standard measurements. Although all presented approaches have been used to measure some parameters of ocular circulation, only few of them can be successfully applied to study microcirculation efficiently. The approaches most commonly used in modern research are following: Scanning Laser Doppler Flowmetry, Optical Coherence Tomography Angiography, Retinal functional imager, Laser speckle flowgraphy, Retinal vasculature assessment software, Oximetry and Adaptive Optics, of which not all have been sufficiently compared between each other in regard of reproducibility and analysed information (), rendering determination of their hierarchy impossible.
Table 2. Retinal microcirculation measurements obtainable with the use of described methods used in human retina.
Few of the presented methods require the use of mydriatic agents. Although extensive research has been conducted over the years in regard to mydriatics’ influence on retinal microvasculature, the data has not been consistent and definitive answer is still debated [Citation115–123]. There are speculations that differences may be at least partially caused by different microcirculation measurement approaches used in those studies. The results of studies performed by Harazny et al. [Citation115,Citation116] with Scanning Laser Doppler Flowmetry showed a significant decrease by over 30% of the retinal capillary flow in mydriasis by both tropicamide and phenylephrine. In contrast, a recent study of Hohberger et al. [Citation117] performed with Optical Coherence Tomography Angiography showed no significant influence of those agents on retinal microvasculature. These differences of mydriatic effect on retinal microcirculation agree with the Poiseuille’s Law – it is far easier to detect changes of microperfusion than of radius of microvessels. In conclusion, it is still worth taking into consideration that mydriatics could act on the vascular receptors involved in the regulation of retinal microcirculation. However, the direct acting of mydriatics on the structural parameters of the retinal vasculature has not been demonstrated, and it should be noted while reviewing individual cases, whether the examinations were performed with the pupil enlarged by vasoactive substances or not.
Some methods however allow for measurement without the use of any mydriatics. In the darkness the pupil is usually large enough for Scanning Laser Doppler Flowmetry measurements. However, there is also a limitation to that approach, as lighting should not be changed in comparative follow-up measurements, because the photodiode in the camera receives photons regardless of its source, and all wavelengths other than used laser wavelength are interpreted as a Doppler shift [Citation51].
Another major issue that arises whenever methods of study of microcirculation are being compared is their availability and feasibility to use in daily medical practice rather than just in clinical research. Most of the presented approaches focus on retinal microcirculation and therefore require patients who are able to focus on the fixation point, rendering measurements in patients with nystagmus, monocular or blind patients all but impossible. Another matter is the transparency of optical system of the eye, the lack of which can also prevent reliable measurements with use of most of the methods. Those issues however are yet to be resolved and none of the approaches of microcirculation measurement seems to be better than others in resolving that matter.
Methods that allow for microcirculation assessment within the skin, mucous membranes and tissuesurface, such as Laser Doppler Flowmetry, thermography or capillaroscopy, are much more feasible. However, among those only Laser Doppler Flowmetry provides actual measurement of capillary blood flow and this method also have its restrictions, including lack of visualisation as well as insufficient evaluation of reproductivity, and depth of measurement.
Although the advanced technologies are under the development [Citation124–126], Scanning Laser Doppler Flowmetry with its supporting perfusion image analysis software Automatic Full Field Perfusion Image Analyser (AFFPIA) is still the only method enabling the reliable examination of microperfusion and arteriolar structure non-invasively and in non-mydriatic conditions in the human retina. Unfortunately, the Scanning Laser Doppler Flowmetry technology is no longer offered by Heidelberg Engineering GmbH/Germany. Among currently commercially available methods the Adaptive Optics and Optical Coherence Tomography Angiography seem to be the most favourable for thorough examination of retinal vessels, as they enable the most detailed analysis, while Retinal vasculature assessment software gains popularity in screening, because of its affordable pricing and increasing mobility. Although, in studies focussing on vessel oxygenation rather than structure, retinal functional imager or Oximetry are far more suitable. Therefore, in order to further complex research, an affordable gold standard measurement system is needed, preferably the one allowing for simultaneous measurement of microcirculatory perfusion, perfusion dynamic, vessel structure and oxygenation.
The examination of retinal microperfusion offers a large opportunity to detect the early phase of the functional and structural changes in the arterial hypertension. It can also serve as a tool to follow up changes induced by the treatment of hypertension.
Online_supplement.docx
Download ()Acknowledgments
The authors thank Barbara Link MD PhD for kindly agreeing to use her excellent retinal angiography image.
Disclosure statement
The authors declare that there is no conflict of interest regarding the publication of this article.
Related Research Data
References
- Zhou B, Bentham J, Di Cesare M, et al. Worldwide trends in blood pressure from 1975 to 2015: a pooled analysis of 1479 population-based measurement studies with 19·1 million participants. Lancet. 2017;389:37–55.
- Savarese G, Lund LH. Global public health burden of heart failure. Card Fail Rev. 2017;03:7.
- Kohara K, Hiwada K. End-organ damage in essential hypertension in the elderly. J Hum Hypertens. 1995;9:717–721.
- Mancia G, Frattola A, Groppelli A, et al. Blood pressure reduction and end-organ damage in hypertension. J Hypertens Suppl. 1994;12:S35–S42.
- Perloff D. Retrospective and prospective research on hypertension-related end-organ damage. J Cardiovasc Pharmacol. 1994;24:S1–S5.
- Laurent S, Briet M, Boutouyrie P. Large and small artery cross-talk and recent morbidity-mortality trials in hypertension. Hypertension. 2009;54:388–392.
- Schmieder RE. End organ damage in hypertension. Dtsch Arztebl Int. 2010;107:866–873.
- Schiffrin EL, Hayoz D. How to assess vascular remodelling in small and medium-sized muscular arteries in humans. J Hypertens. 1997;15:571–584.
- Rizzoni D, Agabiti Rosei C, De Ciuceis C, et al. New methods to study the microcirculation. Am J Hypertens. 2018;31:265–273.
- Mancia G, Fagard R, Narkiewicz K, et al. 2013 Practice guidelines for the management of arterial hypertension of the European Society ofHypertension (ESH) and the European Society of Cardiology (ESC): ESH/ESCTask Force for the Management of Arterial Hypertension. J. Hypertens. 2013;31:1925–1938.
- Lee WH, Park JH, Won Y, et al. Retinal microvascular change in hypertension as measured by optical coherence tomography angiography. Sci Rep. 2019;9:156.
- Dąbrowska E, Harazny JM, Miszkowska-Nagórna E, et al. Lumen narrowing and increased wall to lumen ratio of retinal microcirculation are valuable biomarkers of hypertension-mediated cardiac damage. Blood Press. 2019. Forthcoming.
- Dąbrowska E, Harazny JM, Miszkowska-Nagórna E, et al. Aortic stiffness is not only associated with structural but also functional parameters of retinal microcirculation. Microvasc Res. 2020;129:103974.
- Dąbrowska EE, Harazny JM, Wolf J, et al. The eye – a window to cardiovascular diseases. Arter Hypertens. 2020;24:56–60.
- Levin L, Nilsson S, Ver Hoeve J, et al. Adler’s physiology of the eye. 11th ed. Edinburg (UK): Elsevier Saunders; 2011.
- Wu DM, Kawamura H, Sakagami K, et al. Cholinergic regulation of pericyte-containing retinal microvessels. Am J Physiol Heart Circ Physiol. 2003;284:H2083–H2090.
- Hardarson SH. Retinal oximetry. Acta Ophthalmol. 2013;91:1–47.
- Michelson G, Scibor M. Intravascular oxygen saturation in retinal vessels in normal subjects and open-angle glaucoma subjects. Acta Ophthalmol Scand. 2006;84:289–295.
- Januszewicz A, Więcek A, Hoffman P, et al. Nadciśnienie tętnicze: współczesna diagnostyka i podstawy terapii. 1st ed. Cracow (Poland): Medycyna Praktyczna; 2014.
- Hughes AD, Falaschetti E, Witt N, et al. Association of retinopathy and retinal microvascular abnormalities with stroke and cerebrovascular disease. Stroke. 2016;47:2862–2864.
- Yatsuya H, Folsom AR, Wong TY, et al.; ARIC Study Investigators. Retinal microvascular abnormalities and risk of lacunar stroke: Atherosclerosis Risk in Communities Study. Stroke. 2010;41:1349–1355.
- Doubal FN, MacGillivray TJ, Patton N, et al. Fractal analysis of retinal vessels suggests that a distinct vasculopathy causes lacunar stroke. Neurology. 2010;74:1102–1107.
- Baker ML, Hand PJ, Wang JJ, et al. Retinal signs and stroke: revisiting the link between the eye and brain. Stroke. 2008;39:1371–1379.
- Wong TY, Klein R, Couper DJ, et al. Retinal microvascular abnormalities and incident stroke: The Atherosclerosis Risk in Communities Study. Lancet. 2001;358:1134–1140.
- Liew G, Wang JJ. Retinal vascular signs: a window to the heart? Rev Española Cardiol English Ed. 2011;64:515–521.
- Krill AE. Fluoreszenzangiographie der retina. Lehrbuch und atlas. Am J Ophthalmol. 1969;67:160–161.
- Hodge JV, Clemett RS. Improved method for fluorescence angiography of the retina. Am J Ophthalmol. 1966;61:1400–1404.
- Jung F, Kiesewetter H, Körber N, et al. Quantification of characteristic blood-flow parameters in the vessels of the retina with a picture analysis system for video-fluorescence angiograms: initial findings. Graefes Arch Clin Exp Ophthalmol. 1983;221:133–136.
- Wolf S, Jung F, Kiesewetter H, et al. Video fluorescein angiography: Method and clinical application. Graefes Arch Clin Exp Ophthalmol. 1989;227:145–151.
- Wei X, Balne PK, Meissner KE, et al. Assessment of flow dynamics in retinal and choroidal microcirculation. Surv Ophthalmol. 2018;63:646–664.
- Khoobehi B, Peyman GA. Fluorescent labeling of blood cells for evaluation of retinal and choroidal circulation. Ophthalmic Surg Lasers. 1999;30:140–145.
- Riva CE, Sinclair SH, Grunwald JE. Autoregulation of retinal circulation in response to decrease of perfusion pressure. Investig Ophthalmol Vis Sci. 1981;21:34–38.
- Riva CE, Petrig B. Blue field entoptic phenomenon and blood velocity in the retinal capillaries. J Opt Soc Am. 1980;70:1234–1238.
- Loebl M, Riva CE. Macular Circulation and the Flying Corpuscles Phenomenon. Ophthalmology. 1978;85:911–917.
- Shinohara S, Mochizuki A, Yoshida H, et al. Laser Doppler velocimeter using the self-mixing effect of a semiconductor laser diode. Appl Opt. 1986;25:1417.
- Riva CE, Feke GT, Eberli B, et al. Bidirectional LDV system for absolute measurement of blood speed in retinal vessels. Appl Opt. 1979;18:2301–2306.
- Fujii H. Visualisation of retinal blood flow by laser speckle flow-graphy. Med Biol Eng Comput. 1994;32:302–304.
- Riva CE, Harino S, Petrig BL, et al. Laser Doppler flowmetry in the optic nerve. Exp Eye Res. 1992;55:499–506.
- Riva C, Cranstoun S, Grunwald J, et al. Local choroidal blood flow in the cat by laser Doppler flowmetry. Investig Ophthalmol Vis Sci. 1994;35:608–618.
- Riva CE, Cranstoun SD, Grunwald JE, et al. Choroidal blood flow in the foveal region of the human ocular fundus. Investig Ophthalmol Vis Sci. 1994;35:4273–4281.
- Bender D, Tweer S, Werdin F, et al. The acute impact of local cooling versus local heating on human skin microcirculation using laser Doppler flowmetry and tissue spectrophotometry. Burns. 2020;46:104–109.
- Mowla A, Taimre T, Lim Y, et al. Concurrent reflectance confocal microscopy and laser Doppler flowmetry to improve skin cancer imaging: a monte carlo model and experimental validation. Sensors. 2016;16:1411.
- Sommer B, Kreuzer M, Bischoff B, et al. Combined laser-Doppler flowmetry and spectrophotometry: feasibility study of a novel device for monitoring local cortical microcirculation during aneurysm surgery. J Neurol Surg A Cent Eur Neurosurg. 2016;78:1–11.
- Barry O, Wang Y, Wahl G. Determination of baseline alveolar mucosa perfusion parameters using laser Doppler flowmetry and tissue spectrophotometry in healthy adults. Acta Odontol Scand. 2020;78:31–37.
- Ghouth N, Duggal MS, BaniHani A, et al. The diagnostic accuracy of laser Doppler flowmetry in assessing pulp blood flow in permanent teeth: a systematic review. Dent Traumatol. 2018;34:311–319.
- Abdulhameed YA, Lancaster G, McClintock PVE, et al. On the suitability of laser-Doppler flowmetry for capturing microvascular blood flow dynamics from darkly pigmented skin. Physiol Meas. 2019;40:074005.
- Rajan V, Varghese B, Van Leeuwen TG, et al. Review of methodological developments in laser Doppler flowmetry. Lasers Med Sci. 2009;24:269–283.
- Michelson G, Schmauss B, Langhans MJ, et al. Principle, validity, and reliability of scanning laser Doppler flowmetry. J Glaucoma. 1996;5:99–105.
- Michelson G, Welzenbach J, Pal I, et al. Automatic full field analysis of perfusion images gained by scanning laser Doppler flowmetry. Br J Ophthalmol. 1998;82:1294–1300.
- Harazny JM, Ritt M, Baleanu D, et al. Increased wall:lumen ratio of retinal arterioles in male patients with a history of a cerebrovascular event. Hypertension. 2007;50:623–629.
- Kreis AJ, Nguyen T, Rogers S, et al. Reliability of different image analysis methods for scanning laser Doppler flowmetry. Curr Eye Res. 2008;33:493–499.
- Harazny JM, Raff U, Welzenbach J, et al. New software analyses increase the reliability of measurements of retinal arterioles morphology by scanning laser Doppler flowmetry in humans. J Hypertens. 2011;29:777–782.
- Harazny JM, Ott C, Raff U, et al. First experience in analysing pulsatile retinal capillary flow and arteriolar structural parameters measured noninvasively in hypertensive patients. J Hypertens. 2014;32:2246–2252.
- Schiffrin EL. Effect of antihypertensive treatment on small artery remodeling in hypertension. Can J Physiol Pharmacol. 2003;81:168–176.
- Koch E, Rosenbaum D, Brolly A, et al. Morphometric analysis of small arteries in the human retina using adaptive optics imaging: relationship with blood pressure and focal vascular changes. J Hypertens. 2014;32:890–898.
- Rosenbaum D, Kachenoura N, Koch E, et al. Relationships between retinal arteriole anatomy and aortic geometry and function and peripheral resistance in hypertensives. Hypertens Res. 2016;39:536–542.
- Rosenbaum D, Mattina A, Koch E, et al. Effects of age, blood pressure and antihypertensive treatments on retinal arterioles remodeling assessed by adaptive optics. J Hypertens. 2016;34:1115–1122.
- Rosenbaum D, Koch E, Girerd X, et al. Imagerie des artérioles rétiniennes par optique adaptative, faisabilité et reproductibilité. Ann Cardiol Angeiol (Paris). 2013;62:184–188.
- De Ciuceis C, Coschignano MA, Caletti S, et al. Reproducibility of the evaluation of the wall to lumen ratio of retinal arterioles with two different non-invasive approaches. J Hypertens. 2017;35:e153–e154.
- Babcock HW. Adaptive optics revisited. Science. 1990;249:253–257.
- Liang J, Williams DR, Miller DT. Supernormal vision and high-resolution retinal imaging through adaptive optics. J Opt Soc Am A Opt Image Sci Vis. 1997;14:2884–2892.
- de Carlo TE, Romano A, Waheed NK, et al. A review of optical coherence tomography angiography (OCTA). Int J Retin Vitr. 2015;1:1–15.
- Yannuzzi NA, Gregori NZ, Roisman L, et al. Fluorescein angiography versus optical coherence tomography angiography in macular telangiectasia type i treated with bevacizumab therapy. Ophthalmic Surg Lasers Imaging Retina. 2017;48:263–266.
- Kiyota N, Kunikata H, Shiga Y, et al. Relationship between laser speckle flowgraphy and optical coherence tomography angiography measurements of ocular microcirculation. Graefes Arch Clin Exp Ophthalmol. 2017;255:1633–1642.
- Endersid C, Lang GE, Dreyhaupt J, et al. Quantity and quality of image artifacts in optical coherence tomography angiography. PLos One. 2019;14:e0210505.
- Holmen IC, Konda MS, Pak JW, et al. Prevalence and severity of artifacts in optical coherence tomographic angiograms. JAMA Ophthalmol. 2020;138:119–126.
- Say EAT, Ferenczy S, Magrath GN, et al. Image quality and artifacts on optical coherence tomography angiography. Retina. 2017;37:1660–1673.
- Leitgeb RA, Werkmeister RM, Blatter C, et al. Doppler optical coherence tomography. Prog Retin Eye Res. 2014;41:26–43.
- Wang Y, Bower BA, Izatt JA, et al. In vivo total retinal blood flow measurement by Fourier domain Doppler optical coherence tomography. J Biomed Opt. 2007;12:041215.
- Sugiyama T, Araie M, Riva CE, et al. Use of laser speckle flowgraphy in ocular blood flow research. Acta Ophthalmol. 2010;88:723–729.
- Aizawa N, Nitta F, Kunikata H, et al. Laser speckle and hydrogen gas clearance measurements of optic nerve circulation in albino and pigmented rabbits with or without optic disc atrophy. Investig Ophthalmol Vis Sci. 2014;55:7991–7996.
- Wang L, Cull GA, Piper C, et al. Anterior and posterior optic nerve head blood flow in nonhuman primate experimental glaucoma model measured by laser speckle imaging technique and microsphere method. Investig Ophthalmol Vis Sci. 2012;53:8303–8309.
- Tsuda S, Kunikata H, Shimura M, et al. Pulse-waveform analysis of normal population using laser speckle flowgraphy. Curr Eye Res. 2014;39:1207–1215.
- Luft N, Wozniak PA, Aschinger GC, et al. Ocular blood flow measurements in healthy White subjects using laser speckle flowgraphy. PLoS One. 2016;11:e0168190.
- Shiba T, Takahashi M, Matsumoto T, et al. Pulse waveform analysis in ocular microcirculation by laser speckle flowgraphy in patients with left ventricular systolic and diastolic dysfunction. J Vasc Res. 2018;55:329–337.
- Landa G, Rosen RB. New patterns of retinal collateral circulation are exposed by a retinal functional imager (RFI). Br J Ophthalmol. 2010;94:54–58.
- Landa G, Jangi AA, Garcia PMT, et al. Initial report of quantification of retinal blood flow velocity in normal human subjects using the Retinal Functional Imager (RFI). Int Ophthalmol. 2012;32:211–215.
- Jiang H, DeBuc DC, Rundek T, et al. Automated segmentation and fractal analysis of high-resolution non-invasive capillary perfusion maps of the human retina. Microvasc Res. 2013;89:172–175.
- Lopes De Faria JM, Duarte DA, Larico Chavez RF, et al. Reliability and validity of digital assessment of perifoveal capillary network measurement using high-resolution imaging. Br J Ophthalmol. 2014;98:726–729.
- Landa G, Garcia PMT, Rosen RB. Correlation between Retina Blood Flow Velocity Assessed by Retinal Function Imager and Retina Thickness Estimated by Scanning Laser Ophthalmoscopy/Optical Coherence Tomography. Ophthalmologica. 2009;223:155–161.
- Hickam JB, Frayser R, Ross JC. A study of retinal venous blood oxygen saturation in human subjects by photographic means. Circulation. 1963;27:375–385.
- Hickam JB, Sieker HO, Frayser R. Studies of retinal circulation and A-V oxygen difference in man. Trans Am Clin Climatol Assoc. 1959;71:34–44.
- Stefánsson E, Olafsdottir OB, Eliasdottir TS, et al. Retinal oximetry: metabolic imaging for diseases of the retina and brain. Prog Retin Eye Res. 2019;70:1–22.
- Linsenmeier RA, Zhang HF. Retinal oxygen: from animals to humans. Prog Retin Eye Res. 2017;58:115–151.
- Told R, Boltz A, Schmetterer L, et al. Method comparison of two non-invasive dual-wavelength spectrophotometric retinal oximeters in healthy young subjects during normoxia. Acta Ophthalmol. 2018;96:e614–e618.
- Geirsdottir A, Palsson O, Hardarson SH, et al. Retinal vessel oxygen saturation in healthy individuals. Investig Ophthalmol Vis Sci. 2012;53:5433–5442.
- Man REK, Sasongko MB, Kawasaki R, et al. Associations of retinal oximetry in healthy young adults. Investig Ophthalmol Vis Sci. 2014;55:1763–1769.
- O’Connell RA, Anderson AJ, Hosking SL, et al. Test-retest reliability of retinal oxygen saturation measurement. Optom Vis Sci. 2014;91:608–614.
- Goharian I, Iverson SM, Ruiz RC, et al. Reproducibility of retinal oxygen saturation in normal and treated glaucomatous eyes. Br J Ophthalmol. 2015;99:318–322.
- Blondal R, Sturludottir MK, Hardarson SH, et al. Reliability of vessel diameter measurements with a retinal oximeter. Graefes Arch Clin Exp Ophthalmol. 2011;249:1311–1317.
- Bek T, Stefánsson E, Hardarson SH. Retinal oxygen saturation is an independent risk factor for the severity of diabetic retinopathy. Br J Ophthalmol. 2019;103:1167–1172.
- Eliasdottir TS. Retinal oximetry and systemic arterial oxygen levels. Acta Ophthalmol. 2018;96:1–44.
- Shughoury A, Mathew S, Arciero J, et al. Retinal oximetry in glaucoma: investigations and findings reviewed. Acta Ophthalmol. 2020;98:559–571.
- Stefánsson E, Olafsdottir OB, Einarsdottir AB, et al. Retinal oximetry discovers novel biomarkers in retinal and brain diseases. Investig Ophthalmol Vis Sci. 2017;58:BIO227–BIO233.
- Michelson G, Harazny J. Relationship between ocular pulse pressures and retinal vessel velocities. Ophthalmology. 1997;104:664–671.
- Lieb WE, Cohen SM, Merton DA, et al. Color Doppler imaging of the eye and orbit. Technique and normal vascular anatomy. Arch Ophthalmol. 1991;109:527–531.
- Williamson TH, Harris A. Color Doppler ultrasound imaging of the eye and orbit. Surv Ophthalmol. 1996;40:255–267.
- Wang JJ, Mitchell P, Leung H, et al. Hypertensive retinal vessel wall signs in a general older population: the Blue Mountains Eye Study. Hypertension. 2003;42:534–541.
- Kan H, Stevens J, Heiss G, et al. Dietary fiber intake and retinal vascular caliber in the Atherosclerosis Risk in Communities Study. Am J Clin Nutr. 2007;86:1626–1632.
- Ikram MK, De Jong FJ, Vingerling JR, et al. Are retinal arteriolar or venular diameters associated with markers for cardiovascular disorders? The Rotterdam study. Investig Ophthalmol Vis Sci. 2004;45:2129–2134.
- Polak K, Dorner G, Kiss B, et al. Evaluation of the Zeiss retinal vessel analyser. Br J Ophthalmol. 2000;84:1285–1290.
- Yip W, Tham YC, Hsu W, et al. Comparison of common retinal vessel caliber measurement software and a conversion algorithm. Transl Vis Sci Technol. 2016;5:11.
- Aliahmad B, Kumar DK. Retinal image vasculature analysis software (RIVAS). In: Yang XS, Papa JP, editors. Bio-inspired computation and applications in image processing. Amsterdam (The Netherlands): Elsevier; 2016. p. 323–345.
- Kohler J, White RJ, Divani AA, et al. Comparison of IVAN and VAMPIRE: two free retinal vascular measurement software packages. Investig Ophthalmol Vis Sci. 2016;57:5959.
- Vilser W, Nagel E, Lanzl I. Retinal vessel analysis – new possibilities. Biomed Tech (Berl). 2002;47 Suppl 1 Pt 2:682–685.
- Leung H, Wang JJ, Rochtchina E, et al. Computer-assisted retinal vessel measurement in an older population: correlation between right and left eyes. Clin Experiment Ophthalmol. 2003;31:326–330.
- Muiesan ML, Salvetti M, Paini A, et al. Ocular fundus photography with a smartphone device in acute hypertension. J Hypertens. 2017;35:1660–1665.
- Adam MK, Brady CJ, Flowers AM, et al. Quality and diagnostic utility of mydriatic smartphone photography: the smartphone ophthalmoscopy reliability trial. Ophthalmic Surg Lasers Imaging Retina. 2015;46:631–637.
- Panwar N, Huang P, Lee J, et al. Fundus photography in the 21st century – a review of recent technological advances and their implications for worldwide healthcare. Telemed. e-Health. 2016;22:198–208.
- Xu X, Ding W, Wang X, et al. Smartphone-based accurate analysis of retinal vasculature towards point-of-care diagnostics. Sci Rep. 2016;6:9.
- Bongard O, Bounameaux H. Clinical investigation of skin microcirculation. Dermatology (Basel). 1993;186:6–11.
- Neubauer-Geryk J, Hoffmann M, Wielicka M, et al. Current methods for the assessment of skin microcirculation: Part 1. Postepy Dermatol Alergol. 2019;36:247–254.
- Bonacci E, Santacroce N, D'Amico N, et al. Nail-fold capillaroscopy in the study of microcirculation in elderly hypertensive patients. Arch Gerontol Geriatr. 1996;22:79–83.
- Turner TA. Diagnostic thermography. Vet Clin North Am Equine Pract. 2001;17:95–114.
- Harazny JM, Schmieder RE, Welzenbach J, et al. Local application of tropicamide 0.5% reduces retinal capillary blood flow. Blood Press. 2013;22:371–376.
- Harazny J, Michelson G. Retinale zirkulation und lokale applikation von phenylephrin. 2004 [accessed 2020 Mar 24]. Available from: https://2006.archiv.dog.org/poster2.html
- Hohberger B, Müller M, Hosari S, et al. OCT-angiography: Mydriatic phenylephrine and tropicamide do not influence retinal microvasculature in macula and peripapillary region. PLoS One. 2019;14:e0221395.
- Cheng J, Yu J, Jiang C, et al. Phenylephrine affects peripapillary retinal vasculature-an optic coherence tomography angiography study. Front Physiol. 2017;8:996.
- Mayama C, Ishii K, Saeki T, et al. Effects of topical phenylephrine and tafluprost on optic nerve head circulation in monkeys with unilateral experimental glaucoma. Investig Ophthalmol Vis Sci. 2010;51:4117–4124.
- Tsui E, Sehi M, Cheng RWF, et al. The impact of topical mydriatic ophthalmic solutions on retinal vascular reactivity and blood flow. Exp Eye Res. 2013;112:134–138.
- Robinson F, Petrig BL, Sinclair SH, et al. Does topical phenylephrine, tropicamide, or proparacaine affect macular blood flow? Ophthalmology. 1985;92:1130–1132.
- Takayama J, Mayama C, Mishima A, et al. Topical phenylephrine decreases blood velocity in the optic nerve head and increases resistive index in the retinal arteries. Eye (Lond). 2009;23:827–834.
- Takayama J, Mishima A, Ishii K. Effects of topical phenylephrine on blood flow in the posterior segments of monkey and aged human eyes. Jpn J Ophthalmol. 2004;48:243–248.
- Komar K, Stremplewski P, Motoczyńska M, et al. Multimodal instrument for high-sensitivity autofluorescence and spectral optical coherence tomography of the human eye fundus. Biomed Opt Express. 2013;4:2683–2695.
- McDougall SR, Watson MG, Devlin AH, et al. A hybrid discrete-continuum mathematical model of pattern prediction in the developing retinal vasculature. Bull Math Biol. 2012;74:2272–2314.
- Spaide RF. Volume-rendered optical coherence tomography of retinal vein occlusion pilot study. Am J Ophthalmol. 2016;165:133–144.