
Abstract
Purpose
Elevated serum uric acid (UA) is frequently observed in adults with high blood pressure (BP); however, data from adolescents are limited. We examined the association between serum UA and BP in a nationally representative sample of Taiwan adolescents.
Material and methods
Some 1384 participants, aged 14–19 years, from the Nutrition and Health Survey in Taiwan 2010–2011 were included for the study. Elevated BP was defined as systolic or diastolic BP ≥120/80 mmHg. The analyses examined the relationship between serum UA and BP using linear regression and odds ratios of having an elevated BP using logistic regression.
Results
In this study population, the mean age was 16.0 years, mean serum UA was 5.8 mg/dL, 22.5% were obese (body mass index ≥24 kg/m2) and 9.8% had an elevated BP. Compared to girls, boys are more likely to be obese and to have higher serum UA and BP. After full adjustments, systolic BP, diastolic BP and mean arterial pressure increased 0.45, 0.48 and 0.47 mmHg, respectively, for each 1-mg/dL increase in UA (p = 0.07, 0.03 and 0.02, respectively). The odds of having an elevated BP were 3.4 times higher in subjects of the upper tertile of serum UA than those of the lower tertile (p = 0.02).
Conclusion
Adolescents with factors as male, obesity, and UA ≥5.5 mg/dL were prone to have an elevated BP, regardless of age and family history of hypertension. The present study found that serum UA levels are significantly correlated to BP in Taiwanese adolescents.
Keywords:
Introduction
Hypertension is one of the most common cardiovascular risk factors in the world and is becoming more common in adolescents [Citation1,Citation2]. Between the time of the National Health and Nutrition Examinations Survey (NHANES) III (1988–1994) and the NHANES (2003–2006), the mean systolic and diastolic blood pressure (BP) increased among American children and adolescents [Citation1]. A similar pattern was seen for the significant increase in systolic BP by 3.9 mmHg and 6.8 mmHg for boys and girls, aged 12–14 years, respectively between the 1996 and 2006 Taipei Children Heart Studies [Citation2]. It is noteworthy that childhood hypertension was associated with an increased risk of developing hypertension [Citation3], microalbuminuria [Citation4], and metabolic syndrome [Citation3] in adults. An increasing trend in adolescents’ BP has been largely attributed to increasing overweight and obesity [Citation1,Citation2], but the knowledge about contributing factors of adolescent hypertension is still limited.
Elevated BP levels in children and adolescents are known to be correlated to several factors, including gender, age and height. In the 2005 Chinese National Survey on Students’ Constitution and Health (CNSSCH), the most powerful effect of body size measurements on BP levels in Chinese children and adolescents was weight, followed by body mass index and height [Citation5]. In that study, it lacks biomarkers to explore which has a more powerful impact on BP levels. Several large epidemiological studies have shown that elevated uric acid (UA) is one of the potential risk factors for having elevated BP and the development of hypertension [Citation6–9]. It remains controversial whether UA is an independent causal factor, a mediator, or merely a biomarker for the development of hypertension. Compared to those with a UA level < 5.5 mg/dL, adolescents 12–17 years of age with a UA level ≥5.5 mg/dL had a 2.03 times higher odds of having an elevated BP after adjusting for age, sex, race/ethnicity, and BMI percentile in the 1999–2006 NHANES research [Citation8]. The Xinjiang Congenital Heart Disease Survey consisted of 3778 children aged 10 to 15 years. Hypertensive participants had higher serum UA concentrations than normotensive participants (3.7 vs. 3.4 mg/dL, p = 0.024) [Citation9]. Alper and colleagues reported that higher childhood serum UA levels were associated with increased BP in adulthood [Citation7]. Two small clinical trials suggested that the use of urate-lowering agents in adolescents reduced BP by lowering serum UA levels [Citation10,Citation11].
In addition to typical BP measurements (systolic and diastolic BP), pulse pressure (PP) has been frequently studied to predict cardiovascular disease. PP arises from the interaction of cardiac ejection (stroke volume) and arterial vascular properties. The Framingham Heart study has shown PP was superior to systolic or diastolic BP in predicting coronary heart disease [Citation12]. However, to date, there is a paucity of information on the relationship between serum UA and PP.
In the present study, we used a large, nationally representative sample from Taiwan to investigate the association between UA and BP measurements in adolescents. Since the effects of UA on BP are more apparent at a younger age, adolescents, who usually lack confounding medical conditions, are an ideal population to explore the relationship. We hypothesised that BP measurements were positively associated with serum UA after adjusting for potential confounding factors.
Methods
Study participants
The Nutrition and Health Survey in Taiwan Junior and Senior High School Adolescents (NAHSIT Adolescents 2010–2011) is a nationwide epidemiological survey that focussed on the nutrition and the health status of adolescents in Taiwan. After applying a stratified, multistage, and clustered sampling method, adolescents of the selected schools were the target population of the survey [Citation13]. Based on specific ethnic and geographical characteristics in Taiwan, we designated the Mountain areas, the Northern, the Central, the Southern, and the Eastern areas. A ‘probability proportional to population size’ method was used to select 74 schools (5–6 from each stratum) randomly. From each school, in turn, 54–60 students were drawn randomly, stratified by gender and age. A total of 2204 adolescents (1093 boys and 1111 girls) participated in this survey. Serum UA levels vary widely in different gender due to the uricosuric effects for oestrogen. More than 90% of Chinese girls have reached menarche at age of 14 years, and the peak period of spermarche occurred from 12 to 14 years of age [Citation14]. The adolescents, aged 14–19 years, who underwent a physical examination and had available questionnaire information and biochemistry data were eligible for inclusion in the present analysis. We excluded the adolescents who reported to have underlying diseases (e.g. liver, kidney, thyroid, etc.) and who were on medication (corticosteroids, Chinese herbal medicine, etc.).
Informed consent was obtained by one of the parents of all participants before entering the survey. The study was approved by the Ethics Committee of the National Health Research Institutes in Taiwan.
Data collection
Detailed questionnaire information was collected in a face-to-face interview approach from both the parent/caregiver and the adolescent. Data included gender, age, residential location, medical history and the use of medications. Physical examinations included anthropometric measurements and fasting blood samples were collected.
Details of NAHSIT laboratory procedures have been described elsewhere [Citation13]. The blood specimens were centrifuged immediately after collection. The serum specimens were aliquoted, frozen in a liquid nitrogen tank, and then delivered to the Academia Sinica where they were stored at −70 °C. The serum creatinine, UA, and serum lipids were measured using commercial assay kits (Roche Diagnostics, Basel, Switzerland) on an automatic blood chemistry analyser (COBAS Integra 800 analyser, Roche Diagnostics, Fremont, CA).
Participants were asked to remove their shoes and to wear light clothes. Bodyweight was measured to the nearest 0.1 kg, and height to the nearest 1 mm. Body mass index (BMI) was calculated as weight divided by height squared (kg/m2). BP measurements were obtained by a non-invasive BP monitor with cuffs of appropriate sizes. BP readings were obtained after the participants had been seated, with feet on the ground and back supported, and resting quietly for at least 5 min. The participant’s arm was placed at the same height as the heart. Two measurements were recorded. If the first and second measurements differed by more than 10 mmHg, a third measurement was performed. The mean values of the two or the two closest pressure values were used for data analyses.
Definition of variables
Because the NAHSIT obtained anthropometric measurements at a single study visit, the formal diagnosis of hypertension was not accurately made. Besides, in consideration of ethnic differences, it is not appropriate to use the definition from the Fourth National Task Force on High Blood Pressure in Children and Adolescents. We applied BP reference from recently published studies to define the elevated BP for adolescents ≥13 years of age as systolic or diastolic BP above 120/80 mmHg [Citation15].
This study considered two other BP measurements besides systolic and diastolic BP. First, we calculated the mean arterial pressure (MAP) as 1/3 (systolic BP) + 2/3 (diastolic BP). Second, pulse pressure (PP) was calculated by subtracting diastolic from systolic BP. The creatinine-based formula of Schwartz was applied to calculate the estimated glomerular filtration rate (eGFR; mL/min/1.73 m2). eGFR = k (height in centimeters)/(serum creatinine in milligrams per deciliter), where k is 0.70 in boys and 0.55 in girls [Citation16]. Obesity was defined as BMI ≥24 kg/m2. Adolescents who had one parent with known hypertension were defined as with a family history of hypertension.
Statistical analysis
Continuous variables were given as mean and standard deviation (SD), except for triglycerides, which was expressed as a median and interquartile range because of their skewed distribution. They were log-transformed to better satisfy distribution assumptions before parametric tests were used. Categorical variables were expressed as number and percentage values.
Variables including demographic and clinical characteristics of adolescents stratified by the tertiles of serum UA levels were compared using the analysis of variance (ANOVA). Differences in categorical variables were analysed using the Chi-square test. Multivariable linear regression was used to evaluate the association of UA with BP measurements. We have shown standardised regression coefficients that express a change in the outcome (mmHg for BP) corresponding to a 1-mg/dL of UA increment. Binary logistic regression was used to calculate the relative odds ratio of having an elevated BP. All regression analyses were adjusted for age, gender, BMI, creatinine, glucose, logarithmic transformation of alanine aminotransferase (ALT) and triglycerides (TG), high-density lipoprotein cholesterol (HDL-C), and family history of hypertension (Table S1 in the Online Supplementary Tables). In order to identify adolescents with elevated BP, receiver operating characteristics (ROC) curves and areas under ROC curves (AUC) were conducted to yield the optimal cut-off values of serum UA. All of the statistical analyses were performed using PASW Statistics, version 18.0 (IBM Inc., Armonk, NY). The statistical significance level was set at α = 0.05. All of the statistical analyses were two-sided.
Results
In the NAHSIT 2010–2011, 101 were excluded for having an underlying disease or taking medications, and 53 were excluded because of missing BP and UA, resulting in a final sample size of 1384 adolescents aged 14–19 years. The basic characteristics of the study participants were shown in . Among these adolescents, 311 (194 boys and 117 girls) were defined as obese and the mean BMI was 21.8 kg/m2 (22.4 kg/m2 and 21.2 kg/m2 for boys and girls, respectively). Only two of 701 girls had not experienced menarche. The mean BP levels were 104.1, 59.9, 74.7 and 44.2 mmHg for systolic BP, diastolic BP, MAP and PP, respectively. Boys had higher weight, height, BMI, and four BP measurements, including systolic and diastolic BP, MAP and PP, than girls (all p < 0.001, except p = 0.023 for diastolic BP). As UA tertile increased, participants were more likely to be male, obese and to have higher BP measurements,
Table 1. Clinical characteristics of the study participants by the tertiles of serum uric acid, NAHSIT 2010–2011.
The mean UA level was 5.8 mg/dL in all adolescents (6.7 mg/dL and 4.8 mg/dL in boys and girls, respectively). The serum levels of cholesterol, HDL-C, LDL-C were higher in girls than in boys (p < 0.001 for cholesterol and HDL-C, p = 0.005 for LDL-C).
After adjusting for age and gender (model 1), the four BP measurements all increased per 1-mg/dL increment in UA (p < 0.001; ). After further adjustment for BMI, creatinine, glucose, Ln(ALT), Ln(TG), HDL-C and family history of hypertension, the BP levels increased for each 1-mg/dL increase in UA were 0.45, 0.48, and 0.47 mmHg for systolic BP, diastolic BP and MAP, respectively (p = 0.07, 0.03 and 0.02, respectively), but PP did not have a significant change. As shown in , subjects with higher serum UA levels had a higher prevalence of elevated BP (χ2 = 102.81, p < 0.001). The mean serum UA level in those with an elevated BP was 7.0 mg/dL, higher than those without (p < 0.001; ).
Figure 1. Prevalence of elevated blood pressure by tertiles of serum concentrations of uric acid among 1384 participants aged 14–19 years, NAHSIT 2010–2011. BP: blood pressure. Elevated blood pressure was defined as systolic or diastolic blood pressure ≥120/80 mmHg.
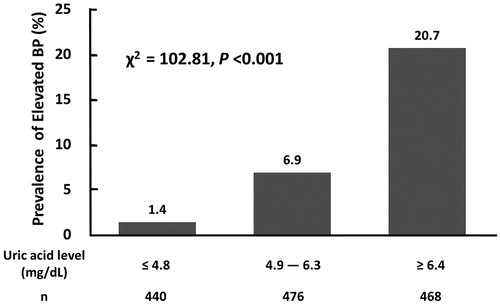
Figure 2. Serum uric acid levels in study participants with normal blood pressure and elevated blood pressure. BP: blood pressure. Elevated blood pressure was defined as systolic or diastolic blood pressure ≥120/80 mmHg.
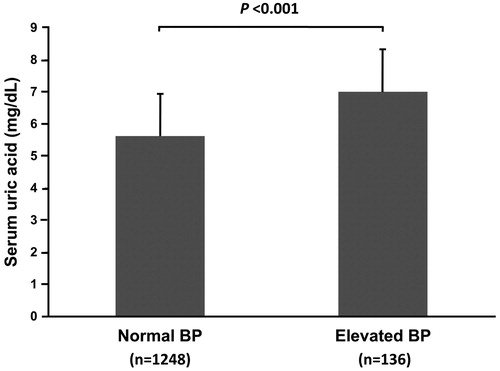
Table 2. Association between uric acid and blood pressure among 1384 adolescents aged 14–19 years, NAHSIT 2010–2011.
By using binary logistic regression, the odds ratio of having an elevated BP for each 1-mg/dL increase in UA was 1.19 (p = 0.04) in the fully adjusted model (). Compared to those of the lower tertile of serum UA, the odds ratio for elevated BP was 3.37 times higher in subjects of the upper tertile (p = 0.02). Subjects with a serum UA level ≥5.5 mg/dL were more likely to have elevated BP (OR = 2.85, p = 0.004).
Table 3. Relative odds of having an elevated blood pressurea among 1384 adolescents aged 14–19 years, NAHSIT 2010–2011.
The most powerful effect on the odds ratio for elevated BP was gender (male versus female), followed by high serum UA levels (UA ≥5.5 mg/dL versus <5.5 mg/dL) and obesity (BMI ≥24 kg/m2 versus <24 kg/m2). Age and family history of hypertension were not associated factors. After adjusting for the other covariates, high serum UA levels still possessed a statistically significant effect on subjects with elevated BP (OR = 3.01, p = 0.002; Table S2).
AUC, Youden criterion, sensitivity and specificity for all participants, female and male were reported respectively (Table S3). The diagnostic accuracy for all participants and female were fair, with AUCs of 0.77 and 0.71, respectively. The Youden criterion in all participants was 6.15 mg/dL. Setting a sensitivity of 70%, the criterion became 6.4 mg/dL with a specificity of 70%. In respect to gender, the Youden criterion in female and male were 5.45 mg/dL and 6.65 mg/dL, respectively. Setting a sensitivity of 70%, the criterion became 5.4 mg/dL with a specificity of 80% for females, and 6.6 mg/dL with a specificity of 50% for males.
Discussion
To the best of our best knowledge, this is the first report to describe the relationship between UA and BP measurements in the national representative samples of Taiwanese adolescents. Our study found that UA is highly associated with BP measurements, including systolic BP, diastolic BP, and MAP, in 1384 adolescents. Given the low prevalence of chronic kidney disease in adolescents, this cohort had normal kidney function, making it logical to assess the independent association between UA and BP. The relationship is strengthened after controlling for age, gender, BMI, creatinine, plasma glucose, Ln(ALT), Ln(TG), HDL-C, and family history of hypertension. It is not surprising that BMI is not only a powerful driving force of BP in adolescents [Citation5] but also substantially weakened the association between UA and BP [Citation17]. However, the association between UA and BP remained significant after adjustment for BMI. Finally, the odds of having an elevated BP, defined as systolic or diastolic BP ≥120/80 mmHg [Citation15], were higher in boys compared with girls and in obese adolescents with BMI ≥24 kg/m2.
Serum levels of UA vary widely in different populations. In the NHANES 2005–2008, UA levels followed a normal distribution and the mean UA level was 5.1 mg/dL [Citation18]. In our study, the mean UA level was 5.8 mg/dL, which is much higher than the UA level of 4.9 mg/dL in the Western Australian Pregnancy Cohort (Raine) study [Citation19] and 5.2 mg/dL among adolescents in northeast China [Citation20]. The main difference might result from diversity in race/ethnicity, dietary cultural pattern and survey year for the NHANES 2005–2008. Although the latter two studies are not nationwide epidemiological surveys, the age of study adolescents is also an important reason for the striking difference. Round had reported that the plasma urate rose sharply during puberty in boys but not in girls [Citation21]. Different ranges of age for the Western Australian and northeast China studies were 13–15 years and 11–16 years, respectively.
A biological mechanism indicated the impact of oestrogen on the renal tubular elimination of UA, resulting in reduced serum UA concentrations. In the previous nationally representative study, the NAHSIT Children 2001–2002 [Citation22], 2284 children (1227 boys and 1057 girls), aged 6–12 years, had similar serum UA levels of 6.07 mg/dL and 5.74 mg/dL for boys and girls, respectively. In our study, only two girls had not experienced menarche. It makes a great difference in the serum UA levels between the children in the NAHSIT 2001–2002 and the adolescents in the NAHSIT 2010–2011. Data from the NHANES III (1988–1994) demonstrated that women with either natural or surgical menopause had a higher serum UA concentration than premenopausal women [Citation23]. Current postmenopausal hormone use was associated with a lower serum UA level than in postmenopausal women who had never used [Citation23]. These results suggest that hormone has an effect on lowering serum UA concentrations.
Experimental and animal studies demonstrated a plausible physiological mechanism that links hyperuricaemia and hypertension through endothelial dysfunction resulting from blocking nitric oxide release [Citation24] and activation of the renin–angiotensin system [Citation25]. Gruskin conducted a small comparable study [Citation26], which demonstrated that the hypertensive adolescents were found to have elevated levels of UA (mean, >6.5 mg/dL) and that plasma renin activity was higher in hypertensive adolescents with hyperuricaemia than in those with normouricaemia. A recent experimental study found that elevated UA induced hypertension through up-regulation of distal nephron epithelial sodium channel expression [Citation27]. A growing body of evidence from cross-sectional and longitudinal studies in children and adolescents demonstrated that UA plays a causal role in elevated BP and in the development of early hypertension [Citation6]. Two randomised, double-blinded, placebo-controlled trials had shown that either allopurinol, a xanthine oxidase inhibitor [Citation10,Citation11], or probenecid, a uricosuric agent [Citation11], reduces BP through their urate-lowering effects.
Several previous studies showed that weight or obesity had a strong effect on adolescents’ BP [Citation1,Citation2,Citation5]. In our study, BMI strongly weakened the relationship between serum UA and BP; however, UA remained significantly correlated to systolic and diastolic BP and MAP after adjusting for age, sex and BMI. Concerning ethnic differences and complex BP references to define elevated BP for children and adolescents, it is more applicable to use BP reference from the recently published studies [Citation15] to define elevated BP in this study population. A cross-sectional study revealed that a serum UA value higher than 5.5 mg/dL had a positive predictive value of 82% and high sensitivity and specificity (87 and 86%, respectively) for essential hypertension in children [Citation28]. Thus, our study found that adolescents with high serum UA levels had a significantly higher likelihood of having an elevated BP. Compared to those with a UA level <5.5 mg/dL, adolescents had a 2.03 and 2.85 times higher odds of having elevated blood pressure in the NHANES 1999–2006 [Citation8] and our study, the NAHSIT 2010–2011, respectively. For screening adolescents of elevated BP, we set a high sensitivity of 70% to yield an approximate negative predictive value of 95%. The cut-off values of serum UA were 5.4 mg/dL for females and 6.6 mg/dL for males.
In 2000, Huxley et al. conducted a systemic review, indicating an inverse association between birth weight and systolic BP. Either preterm birth or poor intrauterine growth leads to low birth weight. Low birth weight was associated with higher serum UA in the US and Korean adolescents [Citation29,Citation30]. In the observational cohort study, adolescents born prematurely had significantly lower birth weight (mean, 1056 vs. 3457 g), greater serum UA and higher systolic BP than those born at term [Citation31]. Among 78 children born at full term, 42 had low birth weight (<2500 g) and 36 had birth weight >3000 g. At the age of 8 to 13 years, those with a history of low birth weight had higher BP and markedly higher UA levels [Citation32]. A 20% reduction of nephron number was identified in children with low birth weight [Citation33]. Feig and co-workers have conducted an impressive experimental study to establish a plausible hypothesis that uric acid plays a causal role in the pathogenesis of hypertension in children with low birth weight and low nephron number [Citation34]. These results suggest that adolescents with preterm birth or intrauterine growth retardation are vulnerable to have low birth weight, reduced nephron number, higher serum UA and subsequent hypertension.
While MAP indicates a steady component of BP, PP, a pulsatile component, arises from the interaction of cardiac ejection (stroke volume) ad arterial vascular properties. Stregiou et al. found that 24-hour PP was closely associated with arterial stiffness in 82 children and adolescents (mean age of 13.1 years) [Citation35]. Compared to those with normal PP in the 7th Korean National Health and Nutrition Examination Survey, participants with high PP (>65.0 mmHg) had higher odds ratios of hyperuricemia in the overall population and women, but not in men [Citation36]. In our study, the positive association between UA and PP was significant in unadjusted and partially adjusted models, and not in a fully adjusted model, suggesting that BMI is a strong confounder. Although the data from NHANES III revealed that obesity, defined by high waist circumference >75th percentile, not by BMI ≥95th percentile, was significantly correlated with high PP [Citation37], the supporting data showed a decrease in BMI resulted in a reduction of PP [Citation38].
There are several limitations of this study. First, this is a cross-sectional study. It is not possible to establish the causal role of UA in elevated BP. Second, we lack the Tanner stage for pubertal development in the present study. Almost all girls in our study experienced menarche, which usually occurs during the fourth or fifth stage. Third, we did not explore diet habits, nutritional effects (e.g. fructose on UA), physical activities, and habits of cigarette smoking and alcohol consumption, but it did not alter the study results. These limitations do not minimise the strengths of this study. The large nationally representative sample of adolescents enables us to explore the association between UA and BP, and the results are very generalisable. We excluded the adolescents with chronic illness and those who are on medication from the study, which minimised the confounding effects to investigate the association in healthy adolescents.
In conclusion, this is the first study using nationwide epidemiological survey data to explore the association between serum UA and BP among healthy adolescents in Taiwan. Among adolescents aged 14–19 years, a higher serum UA level was highly associated with BP measurements, but not with PP. Those with higher levels of serum UA are more likely to have an elevated BP, especially in boys and the obese adolescent population.
Author contributions
KHL, CCY and CMH participated in the study design. KHL and CMH participated in the study coordination and data collection. KHL, FSY and HSC participated in the data analysis. All authors contributed to the interpretation of results as well as to the discussion. KHL, FSY, and CCY all participated in manuscript writing.
iblo_a_1848417_sm0459.doc
Download MS Word (107 KB)Acknowledgements
Data analyzed in this article were collected by the research project ‘Nutrition and Health Survey in Taiwan (2010) on Junior High School Students (NAHSIT)’ and ‘Nutrition and Health Survey in Taiwan (2011) on High School Students (NAHSIT)’ sponsored by the Food and Drug Administration, Department of Health, Executive Yuan (99TFDA-FS-408 and 100TFDA-FS-406). This research project was carried out by the Division of Preventive Medicine and Health Services Research, the Institute of Population Health Sciences of the National Health Research Institutes (NHRI), directed by Dr. Wen-Harn Pan. The Office of Nutrition Survey, the Division of Preventive Medicine and Health Services Research, the Institute of Population Health Sciences of the National Health Research Institutes (NHRI) is responsible for data distribution. The assistance provided by the institutes and aforementioned individuals is greatly appreciated.
Disclosure statement
No potential conflict of interest was reported by the author(s).
Additional information
Funding
References
- Muntner P, He J, Cutler JA, et al. Trends in blood pressure among children and adolescents. JAMA. 2004;291(17):2107–2113.
- Lin FH, Chu NF, Hsieh AT. The trend of hypertension and its relationship to the weight status among Taiwanese young adolescents. J Hum Hypertens. 2012;26(1):48–55.
- Sun SS, Grave GD, Siervogel RM, et al. Systolic blood pressure in childhood predicts hypertension and metabolic syndrome later in life. Pediatrics. 2007;119(2):237–246.
- Hoq S, Chen W, Srinivasan SR, et al. Childhood blood pressure predicts adult microalbuminuria in African Americans, but not in whites: the Bogalusa Heart Study. Am J Hypertens. 2002;15(12):1036–1041.
- Ma J, Wang Z, Dong B, et al. Quantifying the relationships of blood pressure with weight, height and body mass index in Chinese children and adolescents. J Paediatr Child Health. 2012;48(5):413–418.
- Hwu CM, Lin KH. Uric acid and the development of hypertension. Med Sci Monit. 2010;16(10):RA224–RA230.
- Alper AB, Jr., Chen W, Yau L, et al. Childhood uric acid predicts adult blood pressure: the Bogalusa Heart Study. Hypertension. 2005;45(1):34–38.
- Loeffler LF, Navas-Acien A, Brady TM, et al. Uric acid level and elevated blood pressure in US adolescents: National Health and Nutrition Examination Survey, 1999-2006. Hypertension. 2012;59(4):811–817.
- Pan S, He CH, Ma YT, et al. Serum uric acid levels are associated with high blood pressure in Chinese children and adolescents aged 10-15 years. J Hypertens. 2014;32:998–1003.
- Feig DI, Soletsky B, Johnson RJ. Effect of allopurinol on blood pressure of adolescents with newly diagnosed essential hypertension: a randomized trial. JAMA. 2008;300(8):924–932.
- Soletsky B, Feig DI. Uric acid reduction rectifies prehypertension in obese adolescents. Hypertension. 2012;60(5):1148–1156.
- Franklin SS, Khan SA, Wong ND, et al. Is pulse pressure useful in predicting risk for coronary heart disease? The Framingham Heart Study. Circulation. 1999;100(4):354–360.
- Tu SH, Chen C, Hsieh YT, et al. Design and sample characteristics of the 2005-2008 Nutrition and Health Survey in Taiwan. Asia Pac J Clin Nutr. 2011;20(2):225–237.
- Deng Y, Liang J, Zong Y, et al. Timing of spermarche and menarche among urban students in Guangzhou, China: trends from 2005 to 2012 and association with. Sci Rep. 2018;8(1):263.
- Flynn JT, Kaelber DC, Baker-Smith CM, et al. Clinical practice guideline for screening and management of high blood pressure in children and adolescents. Pediatrics. 2017;140(3):e20171904.
- Schwartz GJ, Brion LP, Spitzer A. The use of plasma creatinine concentration for estimating glomerular filtration rate in infants, children, and adolescents. Pediatr Clin North Am. 1987;34(3):571–590.
- Lyngdoh T, Viswanathan B, Myers GJ, et al. Impact of different adiposity measures on the relation between serum uric acid and blood pressure in young adults. J Hum Hypertens. 2012;26(11):677–683.
- Shatat IF, Abdallah RT, Sas DJ, et al. Serum uric acid in U.S. adolescents: distribution and relationship to demographic characteristics and cardiovascular risk factors. Pediatr Res. 2012;72(1):95–100.
- Bobridge KS, Haines GL, Mori TA, et al. Dietary fructose in relation to blood pressure and serum uric acid in adolescent boys and girls. J Hum Hypertens. 2013;27(4):217–224.
- Wang ZN, Li P, Jiang RH, et al. The association between serum uric acid and metabolic syndrome among adolescents in northeast China. Int J Clin Exp Med. 2015;8(11):21122–21129.
- Round JM. Changes in plasma urate, creatinine, alkaline phosphatase and the 24 hours excretion of hydroxyproline during sexual maturation in adolescents. Ann Hum Biol. 1980;7(1):83–88.
- Lee MS, Wahlqvist ML, Yu HL, et al. Hyperuricemia and metabolic syndrome in Taiwanese children. Asia Pac J Clin Nutr. 2007;16(2):594–600.
- Hak AE, Choi HK. Menopause, postmenopausal hormone use and serum uric acid levels in US women–the Third National Health and Nutrition Examination Survey. Arthritis Res Ther. 2008;10(5):R116.
- Mazzali M, Hughes J, Kim YG, et al. Elevated uric acid increases blood pressure in the rat by a novel crystal-independent mechanism. Hypertension. 2001;38(5):1101–1106.
- Mazzali M, Kanellis J, Han L, et al. Hyperuricemia induces a primary renal arteriolopathy in rats by a blood pressure-independent mechanism. Am J Physiol Renal Physiol. 2002;282(6):F991–F997.
- Gruskin AB. The adolescent with essential hypertension. Am J Kidney Dis. 1985;6(2):86–90.
- Xu W, Huang Y, Li L, et al. Hyperuricemia induces hypertension through activation of renal epithelial sodium channel (ENaC). Metabolism. 2016;65(3):73–83.
- Feig DI, Johnson RJ. Hyperuricemia in childhood primary hypertension. Hypertension. 2003;42(3):247–252.
- Rhone ET, Carmody JB. Birthweight and serum uric acid in American adolescents. Pediatr Int. 2017;59(8):948–950.
- Park B, Lee JW, Kim HS, et al. Effects of prenatal growth status on subsequent childhood renal function related to high blood pressure. J Korean Med Sci. 2019;34(25):e174.
- Washburn LK, Nixon PA, Russell GB, et al. Preterm birth is associated with higher uric acid levels in adolescents. J Pediatr. 2015;167(1):76–80.
- Franco MC, Christofalo DM, Sawaya AL, et al. Effects of low birth weight in 8- to 13-year-old children: implications in endothelial function and uric acid levels. Hypertension. 2006;48(1):45–50.
- Mañalich R, Reyes L, Herrera M, et al. Relationship between weight at birth and the number and size of renal glomeruli in humans: a histomorphometric study. Kidney Int. 2000;58(2):770–773.
- Feig DI, Nakagawa T, Karumanchi SA, et al. Hypothesis: uric acid, nephron number, and the pathogenesis of essential hypertension. Kidney Int. 2004;66(1):281–287.
- Stergiou GS, Kollias A, Giovas PP, et al. Ambulatory arterial stiffness index, pulse pressure and pulse wave velocity in children and adolescents. Hypertens Res. 2010;33(12):1272–1277.
- Park CE, Sung HH, Jung EY, et al. Gender difference in the relationship between uric acid and pulse pressure among Korean adults. Clin Exp Hypertens. 2019;41(6):499–504.
- Chandramohan G, Kalantar-Zadeh K, Kermah D, et al. Relationship between obesity and pulse pressure in children: results of the National Health and Nutrition Survey (NHANES) 1988-1994. J Am Soc Hypertens. 2012;6(4):277–283.
- Kwagyan J, Tabe CE, Xu S, et al. The impact of body mass index on pulse pressure in obesity. J Hypertens. 2005;23:619–624.