
Abstract
Purpose
Sympathetic nervous system (SNS) over-activity is associated with essential hypertension. Renal sympathetic denervation (RDN) possibly lowers office- and ambulatory blood pressure (BP) in patients with treatment-resistant hypertension (TRH). We aimed to assess the effect of RDN compared to drug adjustment on SNS activity among patients with TRH by measuring plasma catecholamines and heart rate variability (HRV) during stress tests.
Materials and methods
Patients with TRH were randomised to RDN (n = 9) or Drug Adjustment (DA) (n = 10). We measured continuous HRV and beat-to-beat-BP using FinaPres® and obtained plasma catecholamines during standardised orthostatic- and cold-pressor stress tests (CPT) before- and six months after randomisation.
Results
CPT revealed no differences between groups at baseline in peak adrenaline concentration (69.3 pg/mL in the DA group vs. 70.0 pg/mL in the RDN group, p = 0.38) or adrenaline reactivity (Δ23.1 pg/mL in the DA group vs. Δ29.3 pg/mL in the RDN group, p = 0.40). After six months, adrenaline concentrations were statistically different between groups after one minute (66.9 pg/mL in the DA group vs. 55.3 pg/mL in the RDN group, p = 0.03), and six minutes (62.4 pg/mL in the DA group vs. 50.1 pg/mL in the RDN group, p = 0.03). There was a tendency of reduction in adrenaline reactivity after six months in the RDN group (Δ26.3 pg/mL at baseline vs. Δ12.8 pg/ml after six months, p = 0.08), while it increased in the DA group (Δ13.6 pg/mL at baseline vs. Δ19.9 pg/mL after six months, p = 0.53). We also found a difference in the Low Frequency band at baseline following the CPT (667µs2 in the DA group vs. 1628µs2 in the RDN group, p = 0.03) with a clear tendency of reduction in the RDN group to 743µs2 after six months (p = 0.07), compared to no change in the DA group (1052µs2, p = 0.39).
Conclusion
Our data suggest that RDN reduces SNS activity after six months. This finding warrants investigation in a larger study. Clinical Trial Number registered at www.clinicaltrials.gov: NCT01673516
Introduction
Several factors contribute to the development- and maintenance of arterial hypertension, with sympathetic nervous system (SNS) over-activity playing an important role [Citation1]. This is supported by both the reactivity hypothesis and several findings of elevated catecholamine concentrations in both venous- and arterial samples in hypertensive subjects compared to normotensive controls, as well as increased catecholamine secretion from the heart and kidneys in hypertensive subjects [Citation2,Citation3]. Medical treatment of hypertension remains the mainstay. Early RDN trials were hampered with their sub-optimal design. However, with recently well-designed trials of SPYRAL HTN OFF-MED and SPYRAL HTN ON-MED that validate the safety- and feasibility of RDN, it becomes apparent that some patients are more likely to experience a greater reduction in both office- and ambulatory blood pressure after six months than others [Citation4,Citation5]. Additionally, the reduction in daytime systolic ambulatory blood pressure (ABPM) is most evident in patients with truly resistant hypertension [Citation6].
The efficacy- and safety of RDN after three years have been previously described, along with our own, recently published seven year follow-up data [Citation7,Citation8]. Although available data indicate that RDN is a safe procedure, proper selection of patients who are likely to respond to the procedure beforehand would be of advantage. Although specific biomarkers that predict response have been proposed, no such test is presently available [Citation9]. Heart Rate Variability (HRV) and plasma catecholamine sampling are well-known methods for assessing overall cardiovascular health, and are strongly associated with age, gender, physical fitness and overall morbidity [Citation10,Citation11]. Simultaneous sampling of catecholamines and measurement of HRV during standardised stress tests could be helpful in assessing sympatho-adrenal activity, as well as evaluating the effect of the RDN procedure in reducing SNS over-activity [Citation12].
We aimed to describe repeated measures of plasma catecholamines and HRV in response to stress tests in patients with treatment-resistant hypertension in attempts to assess the effect of RDN compared to drug adjustment on the SNS activity.
Methods
Patient population
All patients included in the Oslo RDN study (n = 19) had treatment-resistant hypertension verified by same-day ABPM following witnessed intake of drugs. In brief, patients were randomised to either RDN (n = 9) or to having their medication optimised assisted by hemodynamic monitoring (n = 10). Stress tests were performed prior to randomisation and at six months follow-up. Both the RDN procedure itself and the outline of the study along with methods of witnessed drug intake and standardised stress tests have been previously described in depth by us and others and are further detailed in the Online Supplement [Citation13–15].
Stress tests (cold pressor test (CPT) and orthostatic test (OT)) with simultaneous catecholamine measurements and HRV monitoring were predetermined as secondary objectives in the Oslo RDN study. The rationale behind this was based on the hypothesis that patients with treatment-resistant hypertension who exhibit significant alterations in HRV and catecholamines during stress tests may be more likely to benefit from RDN because their hypertension is being largely driven by increased sympatho-adrenal activity. In addition, assessment of possible alterations in the SNS activity after RDN was performed. Among the nine patients who underwent RDN, we identified two patients who, when compared to both the RDN group and the Drug Adjustment (DA) group, experienced a far more pronounced reduction in both office blood pressure (BP) and daytime ABPM after six months. We labelled these two patients RDN responders [Citation13]. In this context, the DA group serves as a control group.
Catecholamine collection and analysis
We analysed venous samples of noradrenaline and adrenaline collected at five time points during each of the stress tests both at baseline and after six months, as detailed in the Online Supplement. Since the biological half-life of catecholamines in plasma is short, the predetermined resting period of 20 min between tests was presumed sufficient to reflect a true resting concentration [Citation16]. Peak adrenaline concentration (pAC) and peak noradrenaline concentration were defined as the highest measured concentration in each patient at any time point throughout each stress test, reflecting the overall ability to mobilise catecholamines as a response to a stressor. In the cold-pressor test (CPT), the reactivity (Δ) was defined as the difference between concentration at rest and the concentration measured one minute after the hand was submerged into ice water. Receiving information on the nature of the cold-pressor test was viewed as a psychological stress test, as being informed about a painful procedure may elicit a stress response. In the case of the orthostatic test (OT), peak concentration and reactivity to the test hold the same definition. We were unable to obtain venous access in two of the patients from the DA group, and thus the mean catecholamine concentrations in this group were based on eight patients.
Blood pressure and heart rate variability
During the stress tests, patients were connected to a non-invasive hemodynamics measurement device (Finometer Pro, Finapres Medical Systems, Amsterdam, The Netherlands). Monitoring and data capture during the stress tests were performed using PowerLab 4/30 and analysed with LabChart Pro v8.0.8 (ADInstruments, Dunedin, New Zealand). Continuous BP was measured using an infra-red finger plethysmograph, while beat-to-beat variation in heart rate was assessed by continuous ECG monitoring. In accordance with the recommendations from the Task Force of the European Society of Cardiology and the Heart Rhythm Society, five-minute segments were used in short-term analysis of HRV during rest [Citation17]. These were inspected manually to ensure a minimum of missing data, ectopic beats and noise. In HRV assessment, we included average heart rate, the intervals between each normal RR-segment recorded from the ECG reading (NN-intervals), the percentage of NN-intervals >50 ms apart (pNN50), the Low Frequency (LF) Band (0.04–0.15 Hz), the High Frequency (HF) Band (0.15–0.45 Hz), and the LF/HF ratio. Although subject to debate, the LF band, the HF band and the LF/HF ratio illustrate global sympathico-vagal balance, and the LF/HF ratio is usually found to be in the range of 1–2 in adults at rest [Citation18]. Standardised office- and ambulatory BPs were measured after the stress tests and randomisation using the same device (Microlife WatchBP O3, Widnau, Switzerland).
Statistical analyses
Statistical analyses were performed using IBM SPSS Statistics 25 (SPSS, Chicago, IL, USA). Variables were tested for normality using the Kolmogorov-Smirnov test. Differences between groups and within each group were tested using either an independent- or paired samples t-test or their corresponding non-parametric alternatives; Mann-Whitney U-test or Wilcoxon signed rank tests. The statistical significance was set at α-level of 0.05. Unless otherwise specified, all continuous variables are presented as mean (Standard Error of the Mean, SEM), while categorical values are presented as absolute numbers.
Results
Conventional office BP and ABPM
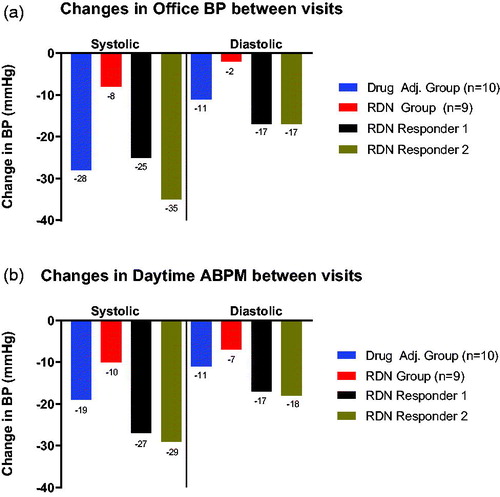
As described in the original publication, office systolic BP was significantly decreased in both groups over the course of six months, but was more pronounced in the DA group (−28 mmHg vs. −8 mmHg in the RDN group) [Citation13]. When viewing the two RDN responders separately from the whole RDN group, their large contribution to the overall reduction in office systolic BP () and daytime systolic BP () in the RDN group becomes evident. In fact, if these two patients were to be viewed separately from the remaining seven patients in the RDN group, the reduction in office systolic BP in the RDN group would mitigate to only −3 mmHg along with an increase in diastolic BP of +2 mmHg after six months. A similar trend was observed for daytime systolic BP, where the reduction in systolic BP was −19 mmHg in the DA group vs. −10 mmHg in the whole RDN group, but upon removal of the two RDN responders, the decrease in daytime systolic BP for the seven remaining in the RDN group would be reduced to −5 mmHg.
Figure 1. (a) Title: ‘Changes in office BP between visits’. The y-axis denotes the overall reduction in blood pressure in mmHg from baseline to the 6 month visit. Below each column, the exact number in mmHg is shown. The x-axis is split into two segments: ‘Systolic’, denoting systolic blood pressure, and ‘Diastolic’, denoting diastolic blood pressure. The Drug Adjustment group (n = 10) is shown in blue colour, the RDN group (n = 9) is shown in red colour, while RDN responder 1 is shown in black and RDN responder 2 in brown colour. (b). Title: ‘Changes in daytime ABPM between visits’. The y-axis denotes the overall reduction in blood pressure in mmHg from baseline to the 6 month visit. Below each column, the exact number in mmHg is shown. The x-axis is split into two segments: ‘Systolic’, denoting systolic blood pressure, and ‘Diastolic’, denoting diastolic blood pressure. The Drug Adjustment group (n = 10) is shown in blue colour, the RDN group (n = 9) is shown in red colour, while RDN responder 1 is shown in black and RDN responder 2 in brown colour.
Changes in adrenaline during stress tests
Adrenaline concentrations during both the orthostatic tests (OT) and the cold-pressor tests (CPT) are illustrated in (baseline) and (after six months). This is detailed further in Supplementary Appendix 1a and Appendix 1b in the Online Supplement. At baseline, the two groups did not statistically differ at any time point in either stress test, including pAC immediately following the CPT (69.3 pg/mL in the DA group vs. 70.0 pg/mL in the RDN group, p = 0.38). The reactivity to the CPT were also similar (Δ23.1 pg/mL in the DA group vs. Δ29.3 pg/mL in the RDN group, p = 0.40). This was also valid for the psychological stressor of receiving information about the nature of the CPT (Δ14.3 pg/mL in the DA group vs. Δ8.9 pg/mL in the RDN group, p = 0.85).
Figure 2. (a) Title: ‘Catecholamine concentrations during stress tests at baseline’. The y-axis denotes catecholamine concentration in pg/mL, and is truncated to bridge the gap between 80 pg/mL and 200 pg/mL. The uppermost cluster of four lines are labelled ‘Noradrenaline’, denoting the noradrenaline concentration, while the same is valid for the lower cluster of four lines, denoting adrenaline. The x-axis is separated by a line into two segments; the left segment illustrating the orthostatic BP test (and all registered time points), while the right segment illustrates the cold-pressor test. The Drug Adjustment group (n = 8) is shown using a solid, blue line. The RDN group (n = 7) is shown using a solid, red line. At each time point, the standard error of the mean is shown by error bars. RDN responder 1 is shown as a separate, dotted, black line. RDN responder 2 is shown as a separate, dotted, brown line. (b). Title: ‘Catecholamine concentrations during stress tests 6 months after randomization’. The y-axis denotes catecholamine concentration in pg/mL, and is truncated to bridge the gap between 80 pg/mL and 200 pg/mL. The uppermost cluster of four lines are labled ‘Noradrenaline’, denoting the noradrenaline concentration, while the same is valid for the lower cluster of four lines, denoting adrenaline. The x-axis is separated by a line into two segments; the left segment illustrating the orthostatic BP test (and all registered time points), while the right segment illustrates the cold-pressor test. The Drug Adjustment group (n = 8) is shown using a solid, blue line. The RDN group (n = 7) is shown using a solid, red line. At each time point, the standard error of the mean is shown by error bars. RDN responder 1 is shown as a separate, dotted, black line. RDN responder 2 is shown as a separate, dotted brown line.
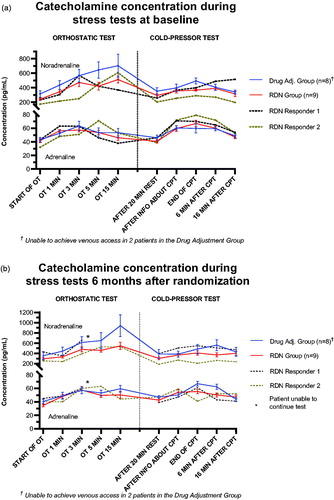
After six months, the two groups remained comparable in their resting adrenaline concentrations (47.0 pg/mL in the DA group vs. 42.6 pg/mL in the RDN group, p = 0.25). However, they were statistically different one minute after the beginning of the CPT (66.9 pg/mL in the DA group vs. 55.3 pg/mL in the RDN group, p = 0.03). This difference was sustained up to 6 min after the CPT (62.4 pg/mL in the DA group vs. 50.1 pg/mL in the RDN group, p = 0.03), before the groups became similar again after 16 min, indicating a difference in adrenaline mobilisation and reactivity to the CPT.
We also revealed a significant difference between the groups in their reactivity to the psychological stressor of receiving information about the CPT (Δ3.3 pg/mL in the DA group vs. Δ11.6 pg/mL in the RDN group, p = 0.01). We found no statistically significant changes in adrenaline reactivity between the visits in either group.
Additionally, the pAC in the RDN group was substantially reduced, being nearly statistically significant (70.0 pg/mL to 61.8 pg/mL, p = 0.06), whereas the DA group in fact experienced a slight increase in pAC (69.3 pg/mL to 69.6 pg/mL, p = 0.93). The adrenaline reactivity in the RDN group was modestly decreased after six months, though not statistically significant (Δ26.3 pg/mL at baseline to Δ12.8 pg/ml after six months, p = 0.08), whereas this increased in the DA group (Δ13.6 pg/mL at baseline to Δ19.9 pg/mL after six months, p = 0.53). Although the reduction in adrenaline reactivity between the groups were not statistically significant in itself, (Δ − 19.9 pg/mL in the RDN group vs. Δ6.3 pg/mL in the DA group, p = 0.53), these findings illustrate how the adrenaline reactivity of the two groups moved in opposite directions six months after randomisation.
We found no differences between the groups at any time point during the OT, including the reactivity/pAC to the test (Δ28.0 pg/mL in the DA group vs. Δ30.0 pg/mL in the RDN group, p = 0.65).
The two RDN responders exhibited a similar pattern to the two groups at baseline, but had consistently higher adrenaline concentrations than the mean of both groups throughout the CPT.
After six months, one responder had to discontinue the OT due to severe, symptomatic hypotension.
Changes in noradrenaline during stress tests
We revealed no statistical differences in peak noradrenaline concentration or its reactivity between the DA group and the RDN group or within each of the groups at any time point during the stress tests at baseline or after six months follow up, as detailed in the Online Supplement.
Changes in BP during stress tests
BP measured by FinaPres during the stress tests at baseline revealed no statistical differences between the two groups at any time point, as detailed in Supplementary Appendix 2a in the Online Supplement. The RDN group experienced a slow, steady decrease in systolic BP throughout the OT. This trend was also seen in the DA group, although there was a non-sustained slightly sharper decrease in systolic BP (Δ −15 mmHg) one minute into the OT. Neither systolic nor diastolic BP significantly increased during the psychological stressor of receiving information about the CPT (Δ5/1 mmHg in the DA group vs. Δ6/2 mmHg in the RDN group, p = 0.78/0.59). There were rather markedly increases in both groups as a response to the noxious stimulus of the test itself when compared to resting values (Δ49/18 mmHg in the DA group vs. Δ48/20 mmHg in the RDN group, p = 0.81/0.89).
The two RDN responders had higher systolic- and diastolic BP than the two groups throughout both stress tests. During the OT, one of the responders showed a trend similar to the two groups, whereas the other exhibited less consistent BP measurements that even increased near the end of the test. During the CPT, the responders exhibited a reactivity pattern similar to the two groups.
After six months, the two groups remained comparable in regards to BP during the OT (although there was a borderline significant difference in systolic BP 15 min into the test; detailed in Supplementary Appendix 2b in the Online Supplement). During the CPT the two groups statistically differed in both systolic- and diastolic BP after the psychological stress of receiving information about the upcoming CPT (141/57 mmHg in the DA group vs. 163/72 mmHg in the RDN group, p < 0.01/<0.01), but did not differ in reactivity to psychological stress (+2 mmHg in the DA group vs. −7 mmHg in the RDN group, p = 0.13). The two groups also differed in both systolic- and diastolic BP 16 min after the test (139/58 mmHg in the DA group vs. 157/71 mmHg in the RDN group, p = 0.02/<0.01).
One of the RDN responders showed a very similar BP pattern six months after RDN, although with overall lower systolic- and diastolic BP values compared to those measured before the intervention. Nevertheless, this patient still had the highest observed BP measurements at nearly all time points. The other responder had the lowest observed BP values of all at the beginning of the OT six months after intervention, and had to stop the OT prematurely due to severe hypotension.
Heart rate variability during stress tests
We examined HRV at baseline (Supplementary Appendix 3a) and after six months (Supplementary Appendix 3b). We found no significant differences between the RDN group and the DA group before the stress tests at baseline. However, activity in the Low Frequency (LF) band was statistically different between the groups after the CPT (667 µs2 in the DA group vs. 1628 µs2 in the RDN group, p = 0.03).
At six months follow-up, the LF band after the CPT was no longer statistically different between the groups (1155 µs2 in the DA group vs. 743 µs2 in the RDN group, p = 0.84). Although not statistically significant, there was a clear tendency of decline in the LF band following the CPT in the RDN group (1628 µs2 at baseline vs. 743 µs2 at six months, p = 0.07) compared to no change in the DA group (667 µs2 at baseline vs. 1052 µs2 at six months, p = 0.39). Besides this, we did not find other statistically significant alterations in the other components of the HRV when comparing baseline values with those six months after intervention.
The two RDN responders had a lower resting LF/HF ratio at both visits (0.1 and 1.2 at randomisation; 0.3 and 0.4 at six months respectively), than the RDN group in general (2.5 at randomisation and 1.8 after six months) and the DA group (1.5 at randomisation and 0.9 at six months). The most apparent change in the RDN responders between randomisation and six months seems to be a large increase in pNN50 (Supplementary Appendix 3a and Supplementary Appendix 3b in the Online Supplement).
Medication
All patients used the highest tolerable doses of ≥3 antihypertensive agents, of which at least one had to be a diuretic. This was in accordance with the current guidelines at inclusion; the 2007 guidelines of the European Society of Hypertension and the European Society of Cardiology (Supplementary Appendix 4) [Citation19].
In the RDN group, the number of antihypertensive agents was higher at randomisation (6.0 vs. 5.0 in the DA group). After six months, the RDN group had reduced the mean number of agents by 0.2 vs. an increase of 1.0 in the DA group.
Unless severe side effects arose, antihypertensive medication in the RDN group was to remain unchanged between randomisation and six months follow-up. One patient from this group experienced a symptomatic reduction in BP and subsequently discontinued use of an angiotensin II receptor blocker (ARB)/diuretic combination.
Characteristics and biochemistry
The biochemical assays and BP measurements have previously been published and are detailed in Supplementary Appendix 5a (baseline) and Supplementary Appendix 5b (6 months) in the Online Supplement [Citation8].
Discussion
In this study we have assessed the responsiveness to CPT and OT among patients with treatment-resistant hypertension prior to randomisation to RDN or drug adjustment. We hypothesised that identification of patients who might respond to RDN was possible by assessing SNS over-activity and measured the concentrations of plasma catecholamines to assess peak values and reactivity during standardised stress tests. Simultaneously, we obtained continuous, beat-to-beat BP and calculated HRV parameters including HF, LF, LF/HF and pNN50.
Our baseline data did not reveal any significant alterations in HRV, catecholamine concentration- or reactivity during stress tests in the 19 patients with TRH. We were thus not able to identify individuals with SNS over-activity prior to RDN. However, six months after randomisation, adrenaline concentrations and its reactivity during CPT revealed a clear decline in SNS activity in the RDN group compared to the DA group. One of the RDN responders had a substantial decline in SNS activity that might indicate a successful renal denervation.
Both the OT and the CPT are well-known throughout the literature, and have previously been described in detail as appropriate tools to assess autonomic nervous system activity [Citation10,Citation20,Citation21]. Both tests elicit a response caused by α-adrenergic receptor stimulation causing peripheral vasoconstriction. The psychological stress response induced by receiving information about the CPT is centrally activated by β-adrenergic receptor stimulation [Citation10]. Additionally, it is well documented that venous concentrations of catecholamines differ from arterial concentrations, and that resting levels of noradrenaline tend to increase with age while adrenaline decreases [Citation22].
Sympathetic over-activity causes an increased level of circulating catecholamines as a response to both acute- and chronic stress, as well as being subject to circadian fluctuations [Citation23,Citation24]. Noradrenaline is mostly synthesised in neuronal synapses, with a relatively low spill-over into systemic circulation due to nerve reuptake, with a slightly delayed response to stressors [Citation25]. Adrenaline on the other hand, mainly originates in the adrenal medulla and is mobilised in response to both psychological- and physical stress. As such, measurement of plasma adrenaline represents a stress reaction that is less affected by confounding factors.
When the adrenaline concentration was compared to that of noradrenaline, its incline- and peak concentrations occur earlier throughout the stress tests, confirming its rapid synthesis- and mobilisation in response to stress. Since the RDN procedure ablates afferent sympathetic nerves in the adventitia of the renal arteries, the overall synthesis of adrenaline and its reactivity to a stressor could be expected to decrease six months after the procedure. As some patients had a larger reduction in pAC and adrenal reactivity than others, the possibility of incomplete ablation remains a topic of discussion. Additional innervation of the adrenal gland that is not located within the adventitia of the renal arteries, and thus not reached by this ablation technique, could also be a possible confounder. Even though the reduction in pAC is only near-statistically significant in the RDN group (p = 0.06), in particular one of the RDN responders had a substantially reduced adrenaline reactivity six months after the procedure, along with a large reduction in both office- and ambulatory BP. This might indicate that this patient is in fact a true responder to RDN. Our findings thus support that catecholamine assessment and stress tests may be included in assessment of patients whose hypertension is thought to be largely driven by SNS over-activity, who might have an increased possibility of benefitting from RDN.
Although measurement of catecholamine concentrations may be more accurate to describe the sympatho-adrenal activity, clinical indicators such as heart rate should be evaluated. Interestingly, the only statistical difference between the RDN group and the DA group on baseline was ambulatory daytime heart rate (59 in the DA group vs. 71 in the RDN group, p = 0.04). The higher mean ambulatory heart rate in the RDN group could perhaps reflect a higher sympatho-adrenal activity not necessarily revealed during stress tests. This is further supported by the diminished difference between the groups after six months.
Changes in HRV during stress tests
HRV is a modality that can aid in the examination of the complex interactions of the autonomic nervous system. The frequencies of each signal represent different facets of neurophysiological regulatory mechanisms that are dependent on several factors, including age, gender, overall health and use of certain medications [Citation26–28]. Both the Ultra-Low Frequency band (≤0.003 Hz) and the Very Low Frequency band (0.0033 − 0.04 Hz) are not normally seen in context with sympathetic activity, as the signals are thought to originate elsewhere [Citation29]. Although a subject of some debate, the LF band and the LF/HF ratio may describe the complex relationship between sympathetic- and parasympathetic activity as regulatory mechanisms of heart rate and blood pressure [Citation29,Citation30]. A recent study on hypertensive patients showed that renal nerve stimulation before RND was not able to elicit any significant changes in the LF band, HF band or LF/HF ratio. After RDN, however renal nerve stimulation showed an increase in HF band with a corresponding decrease in the LF band and a subsequent LF/HR ratio decrease [Citation31]. Our material supports these findings. It also illustrates the large, individual variations amongst the patients, and appreciating the ratio between LF/HF-bands will provide a more accurate picture of the finely tuned balance of the autonomic nervous system. Since the CPT is a physically painful stressor, sympathetic activity increases, causing increased heart rate and a shift in the distribution of frequency signals towards the LF band.
At baseline, the LF band following the CPT was more prominent in the RDN group, perhaps indicating higher sympathetic activity compared to the DA group. After six months, the groups were no longer statistically different in their LF band recordings, but this was clearly reduced in the RDN group compared to the baseline value, indicating a reduction in SNS activity. There were no specific distinctions in any of the HRV variables between the two RDN responders and the rest of the RDN group. Thus, HRV could not be used as a predictor for response to RDN in this study.
Changes in continuous BP during stress tests
The DA group and the RDN group had similar patterns of BP variation throughout the stress tests at both visits. However, mean systolic- and diastolic BP were slightly higher in the RDN group throughout the stress tests; particularly at baseline (). This seems to be largely driven by the elevated measurements in the two responders, possibly reflecting their increased sympathetic activity compared to the rest of the RDN group.
Figure 3. (a) Title: ‘BP measured by FinaPres during stress tests at baseline’. The y-axis denotes blood pressure (BP) in mmHg, and is truncated. The x-axis is separated by a line into two segments; the left segment illustrating the orthostatic test (and all registered time points), while the right segment illustrates the cold-pressor test. The Drug Adjustment group (n = 8) is shown using a solid, blue line. The RDN group (n = 7) is shown using a solid, red line. At each time point, the standard error of the mean is shown by error bars. RDN responder 1 is shown as a separate, dotted, black line. RDN responder 2 is shown as a separate, dotted, brown line. (b). Title: ‘BP measured by FinaPres during stress tests 6 months after randomization’. The y-axis denotes blood pressure (BP) in mmHg, and is truncated. The x-axis is separated by a line into two segments; the left segment illustrating the orthostatic test (and all registered time points), while the right segment illustrates the cold-pressor test. The Drug Adjustment group (n = 8) is shown using a solid, blue line. The RDN group (n = 7) is shown using a solid, red line. At each time point, the standard error of the mean is shown by error bars. RDN responder 1 is shown as a separate, dotted, black line. The asterisk at the ‘OT 3 MIN’-mark denotes the need for RDN responder 1 to stop the test. RDN responder 2 is shown as a separate, dotted brown line.
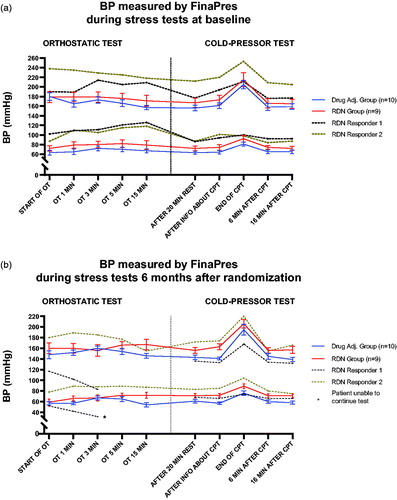
The observed difference between the groups is not explained by number of antihypertensive drugs, as in fact the DA group used on average 5.0 drugs at baseline compared to an average of 6.0 in the RDN group. After six months, the average number of drugs in the DA group increased to 6.0 while the average number of drugs in the RDN group decreased to 5.8, due to one of the responders discontinuing a combination drug as a result of symptomatic hypotension. As illustrated in , both systolic- and diastolic BP in this responder plummeted throughout the first few minutes of the OT six months after RDN was performed (despite a sharp increase in catecholamine concentration). The final BP measurement was 83/32 mmHg just before the test had to be stopped prematurely. During the CPT, systolic BP values in this patient remained comparatively low, yet increased in a pattern similar to the two groups of patients. Although this could reflect a true response to RDN, one cannot rule out other possible explanations, such as improvement of drug adherence and persistence throughout the course of the study.
Medication
It is in the nature of some antihypertensive drugs to alter the sympathetic nervous system [Citation32]. As seen it Supplementary Appendix 4, both RDN responders used drugs such as β-blockers, ARBs and centrally acting sympatholytics at baseline. Although these drugs are known to suppress the sympathetic nervous system, these two patients showed increased sympathetic activity and it seems they benefitted from RDN. Even though one of the RDN responders stopped using an ARB/diuretic combination before the six months visit, all other patients in the RDN group maintained their antihypertensive drug regime, and underwent witnessed intake at both visits. As a result, the increase in pNN50 in these two patients cannot be explained by their medications alone, but could perhaps indicate a true effect of RDN.
Over the last few years, drug non-adherence has become a leading topic in the field of resistant hypertension [Citation33]. Even though witnessed intake virtually guarantees same-day adherence, patients who take a single dose of a drug would be far from reaching a pharmacological steady state, as it requires several half-lives to reach a steady state of serum drug concentration and thus full effect of the drug [Citation34,Citation35]. The severe orthostatism experienced by one of the responders during the orthostatic stress test six months after the procedure could be a symptom of simultaneous intake of several antihypertensive drugs that might otherwise not be taken so regularly. Repeated measures of either serum- or urine drug concentrations would provide a much more accurate image of actual adherence to antihypertensive drugs, especially if performed alongside witnessed intake of drugs [Citation36].
Limitations and strengths
A methodological weakness is found in the use of venous sampling of catecholamines. As opposed to arterial sampling, this limits proper assessment of catecholamines and yields less accurate results. There is limited literature on repeated stress tests combined with HRV, but similar studies on different populations have previously been performed by our research group [Citation10,Citation37]. Even though this material provides unique, repeated data on circulating catecholamines during stress tests in patients with verified treatment-resistant hypertension, the sample size is small. This allows for a greater risk of type 2 errors when interpreting the data, and reduces statistical power of the manuscript. Although the DA group serves as a control group in this setting, we lack a true control group devoid of any intervention. Thus, we conclude with caution, and consider our data on potential RDN responders to be hypothesis-generating.
As the responders in the RDN group only comprises two patients, any meaningful statistical computation is difficult. Had the number of patients in the RDN group been larger, and by extension, possibly the number of responders, they could have been viewed as a separate group. However, with the limited number of observations, they were included as a part of the RDN group in the statistical analyses, but listed separately to emphasise their differences. Any observations made serve to be hypothesis-generating.
The main strength of this study is that included patients were carefully selected in order to find true treatment-resistant hypertension. To our knowledge, this is the first study to assess sympathetic over-activity using cold-pressor and orthostatic stress tests in this population.
Conclusion
Our findings show that RDN is able to reduce adrenaline reactivity six months after the procedure along with a reduction in the overall mobilisation of adrenaline, whereas drug adjustment does not. This assessment may be used to evaluate the effect of RDN. These findings warrant further investigation in a larger study.
Online_Supplement_and_Appendices.docx
Download MS Word (106 KB)Acknowledgements
The authors would like to thank MSc. Ulla Hjørnholm at the Section for Cardiovascular and Renal Research, Oslo University Hospital Ullevål, Oslo, Norway for her invaluable contribution to this work.
This sub-study was made possible by a public PhD grant from Helse Sør-Øst (South-Eastern Norway Regional Health Authority).
Disclosure statement
The authors report no relevant conflicts of interest.
References
- Grassi G, Mark A, Esler M. The sympathetic nervous system alterations in human hypertension. Circ Res. 2015;116(6):976–990.
- Esler M, Jennings G, Biviano B, et al. Mechanism of elevated plasma noradrenaline in the course of essential hypertension. J Cardiovasc Pharmacol. 1986;8(Suppl 5):S39–S43.
- Goldstein DS, Lake CR. Plasma norepinephrine and epinephrine levels in essential hypertension. Fed Proc. 1984;43(1):57–61.
- Townsend RR, Mahfoud F, Kandzari DE, et al. Catheter-based renal denervation in patients with uncontrolled hypertension in the absence of antihypertensive medications (SPYRAL HTN-OFF MED): a randomised, sham-controlled, proof-of-concept trial. Lancet. 2017;390(10108):2160–2170.
- Kandzari DE, Bohm M, Mahfoud F, et al. Effect of renal denervation on blood pressure in the presence of antihypertensive drugs: 6-month efficacy and safety results from the SPYRAL HTN-ON MED proof-of-concept randomised trial. Lancet. 2018;391(10137):2346–2355.
- Weber MA, Mahfoud F, Schmieder RE, et al. Renal denervation for treating hypertension: current scientific and clinical evidence. JACC Cardiovasc Interv. 2019;12(12):1095–1105.
- Mahfoud F, Bohm M, Schmieder R, et al. Effects of renal denervation on kidney function and long-term outcomes: 3-year follow-up from the Global SYMPLICITY Registry. Eur Heart J. 2019;40(42):3474–3482.
- Bergland OU, Soraas CL, Larstorp ACK, et al. The randomised Oslo study of renal denervation vs. Antihypertensive drug adjustments: efficacy and safety through 7 years of follow-up. Blood Press. 2020:1–10. doi: 10.1080/08037051.2020.1828818.
- Dorr O, Liebetrau C, Mollmann H, et al. Brain-derived neurotrophic factor as a marker for immediate assessment of the success of renal sympathetic denervation. J Am Coll Cardiol. 2015;65(11):1151–1153.
- Hassellund SS, Flaa A, Sandvik L, et al. Long-term stability of cardiovascular and catecholamine responses to stress tests: an 18-year follow-up study. Hypertension. 2010;55(1):131–136.
- Tsuji H, Larson MG, Venditti FJ, Jr, et al. Impact of reduced heart rate variability on risk for cardiac events. The Framingham Heart Study. Circulation. 1996;94(11):2850–2855.
- Breuer HW, Skyschally A, Schulz R, et al. Heart rate variability and circulating catecholamine concentrations during steady state exercise in healthy volunteers. Br Heart J. 1993;70(2):144–149.
- Fadl Elmula FE, Hoffmann P, Larstorp AC, et al. Adjusted drug treatment is superior to renal sympathetic denervation in patients with true treatment-resistant hypertension. Hypertension. 2014;63(5):991–999.
- Fadl Elmula FE, Hoffmann P, Fossum E, et al. Renal sympathetic denervation in patients with treatment-resistant hypertension after witnessed intake of medication before qualifying ambulatory blood pressure. Hypertension. 2013;62(3):526–532.
- Symplicity HTNI, Esler MD, Krum H, et al. Renal sympathetic denervation in patients with treatment-resistant hypertension (The Symplicity HTN-2 Trial): a randomised controlled trial. Lancet. 2010;376(9756):1903–1909.
- Goldstein DS. Catecholamines 101. Clin Auton Res. 2010;20(6):331–352.
- Heart rate variability: standards of measurement, physiological interpretation and clinical use. Task Force of the European Society of Cardiology and the North American Society of Pacing and Electrophysiology. Circulation. 1996;93(5):1043–1065.
- von Rosenberg W, Chanwimalueang T, Adjei T, et al. Resolving ambiguities in the LF/HF ratio: LF-HF scatter plots for the categorization of mental and physical stress from HRV. Front Physiol. 2017;8:360.
- Mansia G, De Backer G, Dominiczak A, et al. ESH-ESC Guidelines for the management of arterial hypertension: the task force for the management of arterial hypertension of the European Society of Hypertension (ESH) and of the European Society of Cardiology (ESC). Blood Press. 2007;16(3):135–232.
- Hines EA, Brown GE. Jr. Cold pressor test for measuring reactibility of blood pressure: data concerning 571 normal and hypertensive subjects. Amer Heart J. 1936;11(1):1–9.
- Zygmunt A, Stanczyk J. Methods of evaluation of autonomic nervous system function. Arch Med Sci. 2010;6(1):11–18.
- Goldstein DS, Eisenhofer G, Kopin IJ. Sources and significance of plasma levels of catechols and their metabolites in humans. J Pharmacol Exp Ther. 2003;305(3):800–811.
- Abboud FM. The sympathetic system in hypertension. State-of-the-art review. Hypertension. 1982;4(3 Pt 2):208–225.
- Grassi G, Bombelli M, Seravalle G, et al. Diurnal blood pressure variation and sympathetic activity. Hypertens Res. 2010;33(5):381–385.
- Esler M, Jennings G, Lambert G, et al. Overflow of catecholamine neurotransmitters to the circulation: source, fate, and functions. Physiol Rev. 1990;70(4):963–985.
- Umetani K, Singer DH, McCraty R, et al. Twenty-four hour time domain heart rate variability and heart rate: relations to age and gender over nine decades. J Am Coll Cardiol. 1998;31(3):593–601.
- Shaffer F, Ginsberg JP. An overview of heart rate variability metrics and norms. Front Public Health. 2017;5:258.
- Sevre K, Lefrandt JD, Nordby G, et al. Autonomic function in hypertensive and normotensive subjects: the importance of gender. Hypertension. 2001;37(6):1351–1356.
- Heathers JA. Everything Hertz: methodological issues in short-term frequency-domain HRV. Front Physiol. 2014;5:177.
- Billman GE. Heart rate variability - a historical perspective. Front Physiol. 2011;2:86
- Hoogerwaard AF, de Jong MR, Adiyaman A, et al. Renal sympathetic denervation induces changes in heart rate variability and is associated with a lower sympathetic tone. Clin Res Cardiol. 2019;108(1):22–30.
- Grassi G. Sympathomodulatory effects of antihypertensive drug treatment. Am J Hypertens. 2016;29(6):665–675.
- Burnier M, Egan BM. Adherence in hypertension. Circ Res. 2019;124(7):1124–1140.
- Rognstad S, Soraas CL, Bergland OU, et al. Establishing serum reference ranges for antihypertensive drugs. Ther Drug Monit. 2020.doi: 10.1097/FTD.0000000000000806.
- Muller P, Flesch G, de Gasparo M, et al. Pharmacokinetics and pharmacodynamic effects of the angiotensin II antagonist valsartan at steady state in healthy, normotensive subjects. Eur J Clin Pharmacol. 1997;52(6):441–449.
- Patel P, Gupta PK, White CM, et al. Screening for non-adherence to antihypertensive treatment as a part of the diagnostic pathway to renal denervation. J Hum Hypertens. 2016;30(6):368–373.
- Sevre K, Rostrup M. Blood pressure and heart rate responses to cold pressor test in patients admitted to hospital due to chest pain. Blood Press. 1999;8(2):110–113.