
 ?Mathematical formulae have been encoded as MathML and are displayed in this HTML version using MathJax in order to improve their display. Uncheck the box to turn MathJax off. This feature requires Javascript. Click on a formula to zoom.
Abstract
Purpose
Existing technologies to measure central blood pressure (CBP) intrinsically depend on peripheral pressure or calibration models derived from it. Pharmacological or physiological interventions yielding different central and peripheral responses compromise the accuracy of such methods. We present a high-frame-rate ultrasound technology for cuffless and calibration-free evaluation of BP from the carotid artery. The system uses a pair of single-element ultrasound transducers to capture the arterial diameter and local pulse wave velocity (PWV) for the evaluation of beat-by-beat BP employing a novel biomechanical model.
Materials and methods
System’s functionality assessment was conducted on eight male subjects (26 ± 4 years, normotensive and no history of cardiovascular risks) by perturbing pressure via short-term moderate lower body negative pressure (LBNP) intervention (−40 mmHg for 1 min). The ability of the system to capture dynamic responses of carotid pressure to LBNP was investigated and compared against the responses of peripheral pressure measured using a continuous BP monitor.
Results
While the carotid pressure manifested trends similar to finger measurements during LBNP, the system also captured the differential carotid-to-peripheral pressure response, which corroborates the literature. The carotid diastolic and mean pressures agreed with the finger pressures (limits-of-agreement within ±7 mmHg) and exhibited acceptable uncertainty (mean absolute errors were 2.4 ± 3.5 and 2.6 ± 4.0 mmHg, respectively). Concurrent to the literature, the carotid systolic and pulse pressures (PPs) were significantly lower than those of the finger pressures by 11.1 ± 9.4 and 11.3 ± 8.2 mmHg, respectively (p < .0001).
Conclusions
The study demonstrated the method’s potential for providing cuffless and calibration-free pressure measurements while reliably capturing the physiological aspects, such as PP amplification and dynamic pressure responses to intervention.
Introduction
Blood pressure (BP) measured at the brachial artery using a cuff is the most widely practiced and clinically accepted method for BP estimation. Several recent studies have underlined the prognostic and therapeutic significance of BP measured from the central arterial system (central blood pressure [CBP]). Pulsatile components of arterial pressure are indeed not comparable across different arterial sites owing to pulse pressure (PP) amplification [Citation1]. Discrepancies also exist in CBP values among subjects with identical brachial BP, and therefore, the peripheral measures are not always a surrogate of the central ones [Citation2,Citation3]. In this regard, CBP independently reflects the actual load on the heart and other target organs, with better implications than the brachial BP [Citation4–6]. Compared to the brachial BP, CBP is more closely related to the carotid intima-media thickness, left ventricular mass index and pulse wave velocity (PWV) [Citation2]. Studies have recognized the differential influence of various anti-hypertensive drugs on central and peripheral BP parameters [Citation2]. It has become increasingly evident over the last decade that CBP holds superior predictive value concerning cardiovascular events [Citation2–4].
However, a vast majority of findings on improved risk prediction employing CBP over brachial BP have been confined to only invasive studies, and such evidence tends to get masked when accumulated using the current non-invasive CBP measuring technologies [Citation3,Citation7,Citation8]. Existing non-invasive CBP measuring devices, both cuff-based and cuffless, are calibration-based methods that make use of brachial BP and/or peripheral waveforms to derive the CBP measures [Citation2,Citation9]. Their primary working principles include the method of direct substitution, general or adaptive transfer functions, pressure pulse analysis, N-point moving average and blind system identification, learning-based approaches [Citation10–13]. The estimated values are dependent on the brachial BP values or peripheral pressure waveforms. Also, they may not provide correct estimates for those cases that deviate from the general trend obtained from population-specific calibration models and transfer functions. In cases of age-induced changes and interventions where the response of central arteries versus peripheral arteries are different, the accuracies are likely compromised [Citation14,Citation15]. Methods that independently provide non-invasive CBP measurements, without relying on peripheral pressures in any form, are needed and should track the dynamic responses in CBP to interventions and perturbations, making them more robust for clinical use [Citation3,Citation14].
Our group had earlier introduced mathematical models to evaluate BP from the carotid artery in a calibration-free and cuffless manner without requiring peripheral BP values or waveforms [Citation16]. In this work, we introduce an easy-to-use unimodal high-frame-rate ultrasound system for the measurement of carotid pressure employing these mathematical models. The method uses a set of biomechanical equations that involve arterial wall dynamics and the intra-beat variations in local PWV which are measured using the proposed fast ultrasound. The technology does not use images, rather raw radiofrequency (RF) data, supporting high scan rates, which are recommended to capture the changes in distension with sufficient temporal resolution for accurate measurement of local PWV. In this study, we investigated the technology’s ability to track the beat-to-beat dynamics in the carotid pressure as a response to lower body negative pressure (LBNP) intervention on a total of eight healthy adult humans. This intervention is known to cause a differential response for carotid versus peripheral pressures [Citation17] and, therefore, we have compared the yielded variations in the beat-to-beat carotid pressure against the peripheral pressure. The measurement system is first presented, followed by the study objectives and experimental design. The outcomes of the functionality assessment are presented, and the unique features of the system are elaborately discussed based on them.
Materials and methods
Carotid pressure measurement: theory
In the arteries, the transmural pressure (P) causes the changes in the lumen diameter, and the relation between them can be expressed exponentially [Citation18]. Further, the pressure also causes the blood pulse propagation speed to change non-linearly given the hyperplastic nature of the artery. Within each cardiac cycle, the parameters DP and CP increase as the pressure increases from end-diastole to peak-systole. Considering this, our group had proposed and validated a mathematical model for calibration-free pressure estimation, known as ‘P–β model’ [Citation16,Citation19], that combines the independent relationships of arterial pressure with diameter [Citation18] and local PWV [Citation20], respectively. This model is shown in (1), where the product of pressure P and specific stiffness of blood vessel β [Citation18] is expressed in terms of pressure-dependent local PWV (CP) and the pressure-dependent arterial diameter (DP).
(1)
(1)
Here, ρ is the blood mass density and DD is the end-diastolic diameter. In the equation, P, DP and CP are the only parameters that vary within each cardiac cycle. Measuring DP and CP at two instances within one beat allows rewriting EquationEquation (1)(1)
(1) into two with respective instant values. Hence, rearranging EquationEquation (1)
(1)
(1) in terms of PWV and diameter measures obtained from two independent phases of a cardiac cycle, i.e. from end-diastole (CD and DD) and neighborhood of peak-systole (CF and DF), β is evaluated as
(2)
(2)
The end-diastolic point (D) is identified as the pulse cycle minimum occurring prior to the peak of the cycle. Similarly, the second derivative minimum post to D is identified as the point in the neighborhood of peak-systole (F). Using the estimated β, now diastolic blood pressure (DBP) and systolic blood pressure (SBP) are evaluated as
(3)
(3)
(4)
(4)
where ΔD is the maximum distension during a cardiac cycle. The difference between the SBP and DBP yielded the PP. Further, the diameter cycles upon scaling with SBP and DBP are used for mean arterial pressure (MAP). The method, therefore, uses the measured stiffness-related parameters CD and CF in addition to the dimensional parameters DD, DF and ΔD to evaluate the pressure values in a calibration-free manner, which is directly measurable from the target central arteries using the developed system. Interested readers may find a detailed discussion on the mathematical model elsewhere [Citation16,Citation19].
Proposed measurement system
The developed high-frame-rate ultrasound system incorporated two independent single-element transducers (center-frequency = 5 MHz, spatial half-angle < 1.3 degrees, diameter = 5 mm) that were operated in pulse-echo mode for the measurement of required arterial dimensions and local PWV. The system is a portable one (dimensions = 280 mm × 200 mm × 80 mm and weight = 830 g) that could be connected to a computer via USB 2.0. The raw A-mode RF signals (acquired at frame rate = 500 Hz and sampling rate = 80 MHz) from the two transducers were processed in real-time by custom software. Processing included RF signal conditioning, automated detection [Citation21] and continuous tracking of arterial walls [Citation21], and evaluation of high-resolution diameter waveforms. The local PWV values were measured for two independent fiducial points within each cycle, i.e. end-diastolic (point D) and 80% of peak amplitude (point F) based on transit time calculated from the diameter waveforms pair. For avoiding corruption from arterial wave reflections [Citation19], PWV needed to be measured on the forward-moving pulses, and for this purpose, a frequency domain forward wave separation method was employed using a triangular blood flow velocity model [Citation22]. The diameter waveforms were further used to evaluate ΔD and to extract the corresponding diameter values from the points D and F.
The measured diameter parameters and incremental local PWV (DD, DF, ΔD, CD and CF), were used to evaluate the carotid systolic pressure (SBPCAR), diastolic pressure (DBPCAR) and pulse pressure (PPCAR) using the P–β model described in EquationEquations (1)–(4). The arterial diameter cycle waveforms were scaled between the calculated DBPCAR and SBPCAR to estimate the carotid pressure waveform, and the mean of the cycle was computed to yield the mean arterial pressure (MAPCAR). Finally, the dynamic heart rate (HR) was also evaluated by measuring the cycle intervals. Since the measurement reliability intrinsically depended on the fidelity of diameter waveforms, or more specifically, the RF frames from which these waveforms were derived, a signal quality (SQ) check algorithm was employed [Citation23]. The evaluated SQ scores along with the live recording of the RF frames were displayed on the screen providing the operators the opportunity to correct the orientation for achieving high-quality scans. These scores representing the quality of arterial walls were also the basis for screening the beat-to-beat measurements so that only the good quality beats were used for the final BP measurements. The automated framework for detection and tracking arterial walls, SQ quantification, cycle cutting and screening, and finally, the visual feedback on the recording quality minimizes the operator-dependent variability.
Continuous peripheral pressure
A commercial NIBP system (Human NIBP Nano, ADInstruments South Asia, New Delhi, India) used with appropriate finger-cuff provided the measures of continuous peripheral pressure values. The parent technology Finapres (FMS), and its calibration algorithm ‘Physiocal’, have been validated and used as a reference in literature [Citation24,Citation25]. The equipment also employed a hydrostatic pressure sensory unit for offset adjustment. Since these measurements were from the peripheral artery (finger) and are available in beat-by-beat, they were used to compare the dynamic response of the evaluated carotid pressure to LBNP. Finger pressure cycles, aligned with the measured diameter cycles, yielded the corresponding beat’s diastolic (DBPFIN), systolic (SBPFIN) and mean arterial (MAPFIN) pressures. Only the diastolic and MAP measurements can be directly compared for measurement uncertainty, as in the supine posture, they are found to be relatively constant across the arterial tree [Citation2], devoid of hydrostatic offset. On the other hand, systolic pressure varies traversing from central to peripheral arteries as a result of pulse pressure amplification (PPA) [Citation2]. This restricts a direct comparison of the SBPCAR against SBPFIN for the accuracy analysis.
Study objectives
The preliminary study objectives were: (i) to evaluate the continuous carotid pressures (DBPCAR, MAPCAR and SBPCAR), and investigate their dynamic response to a short-term moderate LBNP intervention, (ii) to compare and verify the LBNP response in carotid pressure against that of the continuous peripheral (finger) pressure, and (iii) to assess the accuracy of the DBPCAR and MAPCAR, by comparing them against the corresponding measurements obtained from the finger (DBPFIN and MAPFIN) in supine.
Subjects
Young and healthy male subjects were selected that were devoid of cardiovascular risk symptoms (such as hyper/hypotension or autonomic nervous dysfunction) and were not on any medication known to alter autonomic nervous function. This was to ensure appropriate hemodynamic response and adequate tolerance to the orthostatic interventions. The volunteers’ response to the LBNP intervention was assessed initially to verify if the intervention could yield at least a 10 mmHg perturbation in the finger DBP. This was necessary for functionality assessment, as the intervention was intended to serve as a source for dynamic pressure profile and yield a range perturbation in BP values. The subjects whose data revealed modest DBP changes due to the intervention (baseline-to-intervention < 10 mmHg) were rejected. Data that formed the part of analysis was collected from 8 out of 10 normotensive subjects (mean SBP = 115.5 ± 7.1 mmHg, DBP = 77.5 ± 8.2 mmHg and MAP = 90.1 ± 7.5 mmHg). The mean age of the subjects was 26 ± 4 years, with height = 171 ± 12 cm, weight = 73.1 ± 18.6 kg and BMI = 24.9 ± 5.1 kg/m2.
Ethical declaration
The conducted study conforms to the principles outlined in the Declaration of Helsinki. The protocols were reviewed and approved by the institute ethics committee (IEC) of All India Institute of Medical Sciences, AIIMS, New Delhi, India (IECPG-153/28.02.2019). All methods and procedures were carried out in accordance with the guidelines and regulations of the IEC. The objectives and measurement procedure were detailed to the individual participants and written informed consent was collected.
Experimental procedure
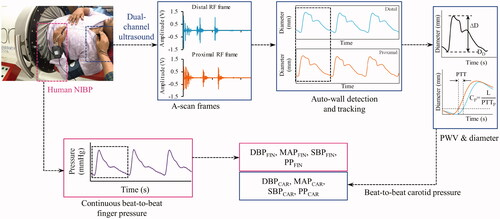
The experimental procedure was performed in a temperature-controlled room (∼23 °C). Investigations were scheduled from 9 AM to 2 PM, after standard intake of a meal without any caffeinated beverages. The entire measurement scheme is shown in . The subject was positioned horizontally in supine posture in an LBNP chamber (VACUSPORT® – Regeneration system, Weyergans High Care® Medical, Germany) up to the level of the iliac crest and was allowed to rest for 10–15 min. The baseline BP was measured using an automatic BP device (HEM-8712, Omron Healthcare, Kyoto, Japan) and a D-ring type arm cuff. NIBP system was then instrumented onto the subject for the measurement of continuous peripheral BP from the finger. The left common carotid artery was identified by palpation, and the developed dual-element ultrasound probe was positioned at the identified site. The probe was oriented to yield the best quality RF signals with strong wall echoes from both the proximal and distal sites. Baseline measurements from NIBP and the proposed devices were performed for 30–50 s. LBNP (−40 mmHg) was then applied as this level of stimulus is known to incur considerable changes in the MAP [Citation26]. Most of the cardiovascular events are seen occurring within 3 min [Citation27], during which the BP perturbs in the beginning and then is corrected by compensatory reflexes. Therefore, the length of the intervention was kept as 1 min where the instantaneous BP changes are likely to occur, and the measurement was continued. Finally, upon the withdrawal of intervention, the measurements were continually collected for another 30–50 s (recovery phase). In this pilot study, the LBNP intervention was intended only to provide a variable range of BP, which could be adequately achieved within a short span of intervention [Citation26] with negligible motion and breathing artifacts. Therefore, the participants were not studied under acute LBNP intervention, such as until the onset of pre-syncopal symptoms.
Figure 1. Schematic of the measurement procedure during the lower-body-negative-pressure intervention study, illustrating the acquisition of simultaneous A-mode ultrasound data from the two proximal locations at carotid and continuous peripheral waveforms from finger employed for the evaluation or beat-to-beat pressure measurements from carotid artery and finger.
Statistical data analysis
The group averaged values are presented in terms of mean and standard deviation. Box-and-whisker plots constructed using median and interquartile ranges were used to indicate the similarity or difference between the groups. The beat-to-beat coefficient of variation (in%) in the baseline measurements is calculated as the ratio of the standard deviation to mean expressed in percentage. The significance of agreement or the difference between corresponding parameters with equal sample size was tested using ‘paired two samples for mean’ t-test. Mean and deviation plots were used to indicate the difference between the parameters measured during the baseline and intervention phases. The significance of the difference between these parameter groups with unequal sample sizes was quantified using Welch’s t-test. The absolute percentage changes δ (with respect to baseline) in measurements incurred during the interventions were also calculated. Regression analyses were performed to analyze the correlations between various parameters, and the respective correlation coefficients (r) are reported along with p value to present the statistical significance. Bland–Altman (BA) analysis was also performed to assess the agreement between the measured parameters. Histogram error plots are provided to illustrate the error distribution. The frequency of measurements (%) yielding accuracy with errors within a limit-of-interest is indicated on the respective histogram plots.
Results
Fidelity of measured signals and parameters
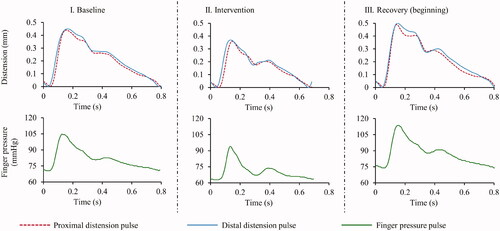
The signal-to-noise ratio (SNR) of the acquired high-speed A-mode frames was greater than 25 dB during all the phases – baseline, intervention and recovery. The fidelity of the diameter cycles measured from both proximal and distal carotid sites was adequate for the reliable evaluation of DD, ΔD, CD and CF. Similarly, high-quality finger BP cycles could be recorded for all the participants. In , representative examples of the signals recorded from subject (EquationEquation (4)(4)
(4) ) (age = 28 years, height = 168 cm, weight = 62 kg and BMI = 22 kg/m2) during baseline, intervention and recovery (immediate to intervention withdrawal) phases. The DD measurements were in the range of 5.6–7.3 mm, with a mean value 6.28 ± 0.72 mm. Similarly, the measured ΔD values were within 0.30–0.65 mm, with a mean value 0.45 ± 0.12 mm. The measured PWV values, collectively, were within the range of 3–5.5 m/s. A significant (p < .001) difference existed between CF and CD, with group average CF = 4.21 ± 1.02 m/s versus that of CD = 3.92 ± 0.82 m/s. The mean variation in the DD, ΔD, CD and CF measurements performed during baseline phase were 2.6 ± 0.60, 2.59 ± 0.62, 5.2 ± 1 and 6.4 ± 2.5%, respectively.
Figure 2. Sample proximal and distal distension pair and finger pressure pulse cycles recorded during different phases of the experiment on a subject, baseline (left column), mid of intervention (center column) and the beginning of recovery post intervention (right column).
Response of measured carotid BP to LBNP
illustrates the sample beat-to-beat measures of finger BP, HR and carotid BP measured for the subject (#4), indicating their absolute values and variations as a hemodynamic response to the LBNP intervention. The mean variation in the DBPCAR, SBPCAR and MAPCAR measurements performed during the baseline phase were 3.9 ± 2.1, 4.4 ± 2.2 and 4.0 ± 1.9%, respectively. The trends in measured carotid BP followed the instantaneous variations in the finger BP, demonstrating a reliable tracking process. For all the recruited subjects, the changes in the finger and carotid pressures across various phases of the experimental time course (M1: baseline, M2: minimum value during Intervention, M3: immediate post-intervention and M4: recovery) are shown in , respectively. In the figure, each subject’s data is represented with a distinct combination of color and symbol. The exhibited measurements for both finger () and carotid () include DBP, MAP, SBP and PP, respectively, across the columns.
Figure 3. Beat-to-beat measures during the entire course of experiment on a particular subject (#4), indicating the dynamic changes (time synchronized) incurred in the finger DBP and SBP (top row), heart rate (middle row) and carotid DBP and SBP in response to the intervention.
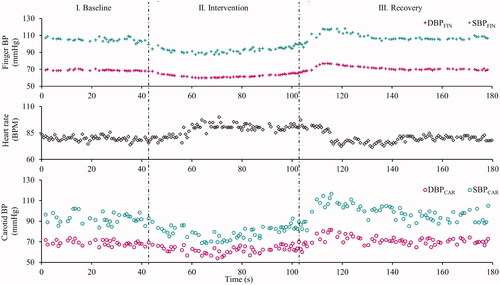
Figure 4. Pressure measurements (DBP, MAP, SBP and PP) of all the eight subjects from (a) finger and (b) carotid, corresponding to various important phases (M1, M2, M3 and M4) of the experimental time course, that include baseline, the minimum value attained during intervention, the maximum value immediately to post intervention, and the recovery. (Each subject is represented by a distinct combination of symbol and color).
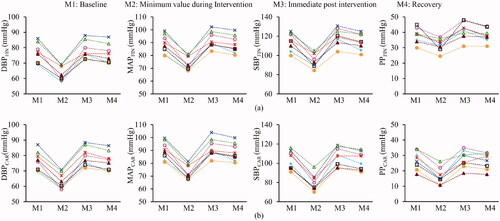
The mean and deviation plots obtained for the carotid and finger DBP, MAP, SBP and PP from all the subjects during the baseline versus intervention phase are illustrated in to compare the effect of the intervention on the various finger versus carotid pressure parameters. The δ values indicating the %difference between the baseline and intervention measurements are shown in the respective plots (). The mean bias in DBPFIN, MAPFIN, SBPFIN and PPFIN during baseline versus intervention phases was 13.8, 15.6, 19.4 and 5.6 mmHg, respectively, all of which were statistically significant (p < .001). Similarly, the mean bias in DBPCAR, MAPCAR, SBPCAR and PPCAR during baseline versus intervention phases were 13.7, 17.5, 22.8 and 9.1 mmHg, respectively, all of which were statistically significant (p < .001).
Figure 5. (a) Mean and deviation plot obtained for the measured and reference DBP, MAP, SBP and PP during the baseline versus intervention phase, indicating a differential central-to-peripheral pressure response to LBNP intervention. (b) Likewise, the box and whisker diagrams (indicating median and quartile ranges) for the measured versus reference DBP, MAP, SBP and PP for the entire measurement time course from all the subjects, show the magnitude of difference between the central and peripheral pressures measured. SBP and PP plots indicate a significant pulse pressure amplification.
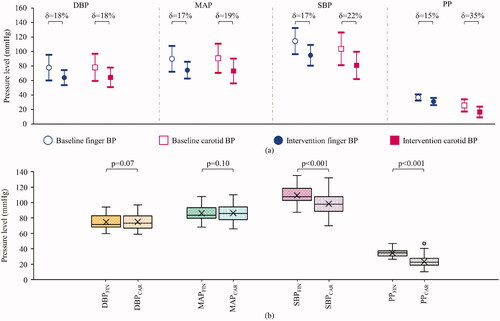
The carotid-to-peripheral BP ratios were calculated for the baseline and intervention phases using the respective beats’ carotid BP and the finger BP measures. For DBP and MAP measures, the respective carotid-to-peripheral ratios were similar, with a statistically non-significant difference (p = .49 and .20, respectively) for the baseline versus intervention phases (1.00 ± 0.09) versus (1.01 ± 0.13) for DBP and (1.00 ± 0.09) versus (0.99 ± 0.10) for MAP. On the other hand, these ratios significantly decreased (p < .001) during intervention from (0.91 ± 0.10) to (0.85 ± 0.13) for SBP and (0.69 ± 0.22) to (0.53 ± 0.22) for PP, respectively.
Reliability of calibration-free carotid BP
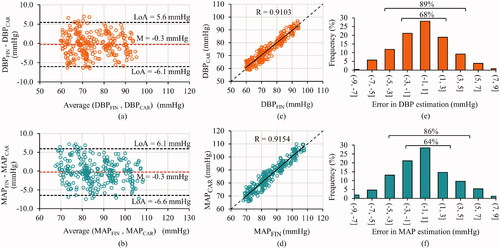
shows the box and whisker plots (representing the median and interquartile ranges) of finger versus measured carotid BP parameters for the entire measurement time course from all the subjects pooled together. The DBP and MAP values measured by the proposed system significantly agreed (p = .07 and .10, respectively) with that by NIBP device from the peripheral site. As expected physiologically, the SBP and PP values measured by the proposed system significantly (p < .001) differed from the corresponding measures from the finger. The mean difference between the finger and carotid SBP was 11.1 ± 9.4 mmHg, likewise for PP was 11.3 ± 8.2 mmHg. In supine posture DBP and MAP from the several arteries are consistent in magnitude; therefore, carotid and finger measures were compared for the baseline, intervention and recovery phases in . The BA plots for DBP and MAP are shown in , respectively. The bias between the finger and carotid DBP was −0.3 mmHg, and MAP was −0.3 mmHg, respectively, both of which were statistically non-significant (p > .05). The limits of agreement (LoA) for the BA analysis on the DBP were −6.1 and 5.6 mmHg and on MAP were −6.6 and 6.1 mmHg. The correlation scatter plots for DBP and MAP are shown in , respectively, indicating the obtained and ideal regression line along. The correlation coefficient for the finger and carotid DBP and MAP were r = 0.91 and 0.92 (p < .001), respectively. Their mean absolute errors were 2.4 ± 3.5 and 2.6 ± 4.0 mmHg, respectively. The error histograms for the DBP and MAP measurements are shown in , respectively. The frequency of measurements (%) with errors within ±3 mmHg was greater than 60% and, likewise, within ±5 mmHg was greater than 85%. These frequencies for the DBP and MAP are indicated in the respective histogram plots ().
Figure 6. Accuracy performance of the presented method illustrated by comparing carotid versus finger pressure measurement from all the three phases – baseline, intervention and recovery. (a) and (b) Bland–Altman plots along with the mean and confidence interval lines, (c) and (d) correlation scatter plots indicating the obtained (solid) and ideal (dashed) regression lines and (e) and (f) frequency distribution (in%) of the relative errors for the diastolic and mean pressures, respectively.
Discussion
We have presented a cuffless and calibration-free BP measurement technique from the carotid artery using a high-frame-rate image-free ultrasound system. We have demonstrated that with the high scan rate, the system was able to simultaneously capture the changes in diameter and local PWV within each cardiac cycle. These measured parameters furnished carotid pressure estimates, which, compared with peripheral pressures, manifested accurate diastolic and MAP values (over a range of 60–95 and 65–110 mmHg, respectively) captured the PPA evidenced by systolic pressures. The unique verification study based on LBNP intervention revealed that the system not only measured the instantaneous beat-to-beat perturbations reliably but also was sensitive to the difference in response of carotid pressures as opposed to the peripheral pressures to the stimulus. In this regard, the system was able to measure the beat-to-beat changes in the PPA under the influence of LBNP. This demonstrated that the system measured the carotid pressure and its response to stimuli independent of the peripheral pressure.
Currently, the popular CBP measuring devices [Citation2,Citation9] adopt one of these techniques; (i) scaling the blood-pulse recorded using tonometer-like sensors at the carotid site by adjusting its mean and minima against the brachial MAP and DBP, respectively, (ii) calibrating peripheral pressure waveforms based on generalized or adaptive transfer function(s), (iii) N-point averaging of the peripheral pressure wave, (iv) estimation based on second systolic peak or shoulder point of peripheral pressure wave, (v) blind system identification and (vi) learning-based techniques [Citation10–13,Citation28]. Another popular category of methods that have been employed for estimating peripheral BP, but could also be potentially adapted for CBP, is the use of models that scale PTT or PWV to the BP values [Citation25,Citation28–32]. A common challenge associated with these non-invasive approaches that estimate CBP is their inherent dependence on peripheral pressure measurements. Their model accuracy and/or the errors of peripheral BP measurements compromise the accuracy [Citation3,Citation33]. Machine learning approaches purport to provide a calibration-free BP as they may not require recording surrogate pressures at the time of measurement [Citation12,Citation13,Citation25]. However, they do use prior BP information as ground truth for training the architectures on large data sets that contain inherent trends. Such approaches should be less useful for clinical applications as they would fail to provide reliable measurements unless they have been thoroughly trained for diverse populations and pathophysiological cases [Citation25]. Recent evidence has shown that interventions, such as pharmacological and hemodynamic modulations amplify the discrepancies between the central and peripheral pressures [Citation14], which poses a further challenge to aforesaid methods.
Unlike other non-invasive BP measurement methods reported so far, the novelty of the presented system is its non-dependence on any subject-specific or population-specific calibration model. More importantly, it does not require or use any prior information of neither the BP values nor the surrogate pressure waveforms recorded from peripheral arterial sites. In terms of cuffless techniques, ultrasound has been actively used and several approaches have been reported [Citation25]. One advantage with ultrasound methods is they have accessibility to deeper vessels and provide true blood pulse from the arteries (either diameter or flow waveforms) that are not corrupted by the introduction of tissue or skin transfer functions. Few of the popular ultrasound methods include the ones based on the PWV-calibration [Citation34,Citation35], diametric-calibration [Citation36,Citation37] and based on active external force-vessel interaction [Citation25,Citation38]. The methods again pose similar challenges (alluded earlier), such as calibration-associated issues or limited ability in tracking the beat-to-beat pressures, especially in the presence of interventions [Citation14,Citation25].
The developed system is capable of simultaneously measuring the pressure-dependent variations of both the carotid artery diameter and local PWV within each cardiac cycle. Since the system yields PWV measure as well in addition to the pressure, it is amenable for monitoring of early vascular aging [Citation39]. While methods in the literature rely on simultaneous pressure-diameter waveforms from a single site [Citation19] for tracking PWV changes in a cardiac cycle, the unique aspect of the developed system is that it tracks them directly by measuring (varying) local PTT within each cardiac cycle. As yielded, the carotid CF was systematically higher than CD (by 7.27 ± 4.30%) and concord with the ones reported in the literature [Citation19]. The system also demonstrated repeatable baseline measurements of diameter and local PWV. The methodological considerations to perform such reliable measurements from smaller arterial segments have been addressed in our earlier works [Citation19,Citation40]. Using simultaneously measured diameter and local PWV incremental parameters, the carotid pressure was evaluated for all the subjects during both the baseline and intervention. The baseline measurements of carotid DBP, SBP and MAP were repeatable. The pressure obtained from the carotid artery is known to be a reliable surrogate for central aortic pressures [Citation2]. Though employing a calibration technique, patch-based ultrasound has already been introduced for measuring BP, advancing the wearable technology [Citation37]. Adopting such technologies in compliment with a calibration-free technique as presented here would address the need for a continuous BP. Since the results suggest the ability of the method to track the changes in the beat-to-beat pressure, it has the potential to be applied for monitoring short-term perturbations in clinical settings, such as operative and post-operative care.
The use of the LBNP intervention provided a dynamic range of BP perturbations in a controlled manner while allowing measurement devoid of motion artifacts. The trends in carotid pressure followed that of the peripheral pressure (as depicted in ). From the pressure profile, it was evident that for the recruited subjects the all the pressure parameters both from finger and carotid manifested a decrement during the intervention, a moderate overshoot immediate after withdrawing the stimulus, and recovery to baseline value eventually ().
Both the diastolic and systolic carotid measurements decreased significantly (p < .001), concomitant to their peripheral counterparts as a result of the intervention. One outcome of interest, however, is that the decrement for carotid DBP and MAP during the intervention was similar to that of the peripheral site (18 and 19%) versus (18 and 17%). Whereas the decrement in SBP and PP was relatively greater for the carotid artery compared to (22 and 35%) versus (17 and 15%). This inference was drawn by observing the calculated carotid-to-peripheral pressure ratios during the intervention, which were statistically similar for DBP and MAP (p = .49 and .20, respectively), but significantly decreased for SBP and PP (p < .001). Such a differential response of carotid versus peripheral pulsatile BP components to LBNP intervention is corroborated in an earlier work by Pannier et al. [Citation17]. While these results have demonstrated the ability of the device to capture LBNP-induced perturbations in BP, they have also captured the differential response incurred in carotid versus peripheral pressures, especially in SBP and PP.
The carotid SBP and PP were systematically lower (p < .001) than the peripheral measures, whereas DBP and MAP from both the devices were significantly comparable (p = .07 and .10, respectively) for all subjects. The phenomenon of PPA explains such an outcome, where the SBP and PP in peripheral arteries are usually higher than the central ones [Citation1,Citation41]. The PPA for the recruited subjects concurs with the range reported in the literature (10 − 20 mmHg for an age group of 20 − 40 years) [Citation1]. Likewise, studies show that DBP and MAP are reasonably constant across the arterial tree in the supine posture, where the hydrostatic offset is negligible [Citation2]. For that matter, this has been the basis for many several calibration methods in the literature that evaluate central BP [Citation2].
The carotid DBP and MAP measured by the system were strongly correlated with the finger pressure counterparts, and their corresponding magnitudes were in close agreement with a non-significant bias. A mean absolute error less than 3 mmHg further demonstrated the measurement accuracy. Note that the carotid DBP and MAP evaluated by the models did not utilize any calibration procedures or surrogate pressures but only are dependent on closed-form expressions relating pressure with intra-beat variations in diameter and local PWV. Therefore, the performance results obtained were encouraging, given that the system could yield reliable BP measures in spite of HR variability during LBNP. The potential influence of HR on the PWV [Citation42] makes the BP assessment challenging, especially when based on calibration. Future invasive studies in accordance with the recommendations of ARTERY Society task force [Citation43] are warranted to fully establish the proposed system’s accuracy over a wide physiological range.
In conclusion, the system is promising in light of the current functional assessment that demonstrated reliable measurement of calibration-free, cuffless carotid pressure over continuous cardiac cycles without the need for peripheral BP. Consistent with the earlier work [Citation17], the carotid measurements manifested a differential carotid-to-peripheral pressure response during the LBNP. On comparing the peripheral and the measured carotid BP, PPA was observed with a magnitude that was concurrent with the literature [Citation1]. The measurement accuracy was demonstrated on the directly comparable carotid versus finger measures (DBP and MAP) even in the presence of altering BP and HR.
Study limitations and future work
A small sample size was used to demonstrate the functionality of the developed system, which is study limitation. However, a wide range of BP changes was induced in a continuous manner through LBNP intervention (DBP: 60–95 mmHg and MAP: 65–110), and beat-to-beat measures were available for uncertainty analysis. Another limitation concerns the lack of an appropriate clinical-grade carotid BP reference device. It may be noted that, to our knowledge, no clinically established non-invasive carotid BP monitors are available as a reference standard. Thus, validation of the device against an invasive reference is essential [Citation43] to fully establish the system’s performance in terms of repeatability, reproducibility and accuracy. Such studies on large animal models (with drug interventions to induce BP changes) are underway. Further, a large-scale study on human subjects comprising of the normal and diseased populations is in progress to investigate the system’s screening capability and incremental value of the carotid pressure.
Acknowledgments
The authors thank the doctors and researchers from the Space Research Laboratory, Department of Physiology, AIIMS, New Delhi, India, for their support and assistance in conducting this study.
Disclosure statement
The authors declare no competing interests.
Data availability statement
All the relevant data generated and analyzed during this study are included in this article. Individual-level participant raw-data obtained from the image-free ultrasound device are available from the corresponding author on request.
References
- Avolio AP, Van Bortel LM, Boutouyrie P, et al. Role of pulse pressure amplification in arterial hypertension: experts’ opinion and review of the data. Hypertension. 2009;54(2):375–383.
- Cheng HM, Chuang SY, Wang TD, et al. Central blood pressure for the management of hypertension: is it a practical clinical tool in current practice? J Clin Hypertens (Greenwich). 2020;22(3):391–406.
- Laurent S, Sharman J, Boutouyrie P. Central versus peripheral blood pressure: finding a solution. J Hypertens. 2016;34(8):1497–1499.
- Kollias A, Lagou S, Zeniodi ME, et al. Association of Central versus brachial blood pressure with target-organ damage: systematic review and Meta-analysis. Hypertension. 2016;67(1):183–190.
- Sharman JE, Laurent S. Central blood pressure in the management of hypertension: soon reaching the goal? J Hum Hypertens. 2013;27(7):405–411.
- Yamashita S, Dohi Y, Takase H, et al. Central blood pressure reflects left ventricular load, while brachial blood pressure reflects arterial damage. Blood Press. 2014;23(6):356–362.
- Mitchell GF. Central pressure should not be used in clinical practice. Artery Res. 2015;9:8–13.
- Mitchell GF, Hwang SJ, Larson MG, et al. Transfer function-derived Central pressure and cardiovascular disease events: the Framingham heart study. J Hypertens. 2016;34(8):1528–1534.
- McEniery CM, Cockcroft JR, Roman MJ, et al. Central blood pressure: current evidence and clinical importance. Eur Heart J. 2014;35(26):1719–1725.
- Miyashita H. Clinical assessment of Central blood pressure. Curr Hypertens Rev. 2012;8(2):80–90.
- Gao M, Rose WC, Fetics B, et al. A simple adaptive transfer function for deriving the Central blood pressure waveform from a radial blood pressure waveform. Sci Rep. 2016;6(1):33230.
- Xiao H, Qasem A, Butlin M, et al. Estimation of aortic systolic blood pressure from radial systolic and diastolic blood pressures alone using artificial neural networks. J Hypertens. 2017;35(8):1577–1585.
- Xing X, Ma Z, Zhang M, et al. An unobtrusive and calibration-free blood pressure estimation method using photoplethysmography and biometrics. Sci Rep. 2019;9(1):1–8.
- Cheng HM, Lang D, Tufanaru C, et al. Measurement accuracy of non-invasively obtained Central blood pressure by applanation tonometry: a systematic review and Meta-analysis. Int J Cardiol. 2013;167(5):1867–1876.
- Wojciechowska W, Stolarz-Skrzypek K, Tikhonoff V, et al. Age dependency of Central and peripheral systolic blood pressures: cross-sectional and longitudinal observations in European populations. Blood Press. 2012;21(1):58–68.
- Nabeel PM, Joseph J, Karthik S, et al. Bi-Modal arterial compliance probe for calibration-free cuffless blood pressure estimation. IEEE Trans Biomed Eng. 2018;65(11):2392–2404.
- Pannier B, Slama MA, London GM, et al. Carotid arterial hemodynamics in response to LBNP in normal subjects: methodological aspects. J Appl Physiol. 1995;79(5):1546–1555.
- Hayashi K, Handa H, Nagasawa S, et al. Stiffness and elastic behavior of human intracranial and extracranial arteries. J Biomech. 1980;13(2):175–184.
- Nabeel PM, Raj VK, Joseph J, et al. Local pulse wave velocity: theory, methods, advancements, and clinical applications. IEEE Rev Biomed Eng. 2020;13:74–112.
- Bramwell JC, Hill AV. The velocity of the pulse wave in man. R Soc Publ. 1922;93:298–306.
- Joseph J, Radhakrishnan R, Kusmakar S, et al. Technical validation of ARTSENS-an image free device for evaluation of vascular stiffness. IEEE J Transl Eng Health Med. 2015;3:1900213.
- Qasem A, Avolio A. Determination of aortic pulse wave velocity from waveform decomposition of the Central aortic pressure pulse. Hypertension. 2008;51(2):188–195.
- Joseph J, Raj VK, Nabeel PM, et al. ARTSENS® pen — portable easy-to-use device for carotid stiffness measurement: technology validation and clinical-utility assessment. Biomed Phys Eng Express. 2020;6:1–12.
- Imholz BPM, Wieling W, Van Montfrans GA, et al. Fifteen years experience with finger arterial pressure monitoring: assessment of the technology. Cardiovasc Res. 1998;38(3):605–616.
- Rastegar S, GholamHosseini H, Lowe A. Non-invasive continuous blood pressure monitoring systems: current and proposed technology issues and challenges. Phys Eng Sci Med. 2020;43(1):11–28.
- Goswami N, Blaber AP, Hinghofer-Szalkay H, et al. Lower body negative pressure: physiological effects, applications, and implementation. Physiol Rev. 2019;99(1):807–851.
- Goswami N, Loeppky JA, Hinghofer-Szalkay H. LBNP: past protocols and technical considerations for experimental design. Aviat Space Environ Med. 2008;79(5):459–471.
- Yao Y, Wang L, Hao L. Blood pressure - from bench to bed. 1st ed. London: IntechOpen; 2018.
- Yousefian P, Shin S, Mousavi A, et al. The potential of wearable limb ballistocardiogram in blood pressure monitoring via pulse transit time. Sci Rep. 2019;9(1):1–11.
- Ding X, Yan BP, Zhang YT, et al. Pulse transit time based continuous cuffless blood pressure estimation: a new extension and a comprehensive evaluation. Sci Rep. 2017;7(1):1–11.
- Douniama C, Sauter CU, Couronne R. Blood pressure tracking capabilities of pulse transit times in different arterial segments: a clinical evaluation. Comput Cardiol. 2009;201–204.
- Patzak A, Mendoza Y, Gesche H, et al. Continuous blood pressure measurement using the pulse transit time: comparison to intra-arterial measurement. Blood Press. 2015;24(4):217–221.
- Kayrak M, Ulgen MS, Yazici M, et al. A comparison of blood pressure and pulse pressure values obtained by oscillometric and Central measurements in hypertensive patients. Blood Press. 2010;19(2):98–103.
- Mukkamala R, Hahn JO, Inan OT, et al. Toward ubiquitous blood pressure monitoring via pulse transit time: theory and practice. IEEE Trans Biomed Eng. 2015;62(8):1879–1901.
- Seo J, Pietrangelo SJ, Lee HS, et al. Noninvasive arterial blood pressure waveform monitoring using two- element ultrasound system. IEEE Trans Ultrason Ferroelectr Freq Control. 2015;62(4):776–784.
- Meinders JM, Hoeks APG. Simultaneous assessment of diameter and pressure waveforms in the carotid artery. Ultrasound Med Biol. 2004;30(2):147–154.
- Wang C, Li X, Hu H, et al. Monitoring of the Central blood pressure waveform via a conformal ultrasonic device. Nat Biomed Eng. 2018;2(9):687–695.
- Zakrzewski AM, Huang AY, Zubajlo R, et al. Real-time blood pressure estimation from force-measured ultrasound. IEEE Trans Biomed Eng. 2018;65(11):2405–2416.
- Nilsson PM, Khalili P, Franklin SS. Blood pressure and pulse wave velocity as metrics for evaluating pathologic ageing of the cardiovascular system. Blood Press. 2014;23(1):17–30.
- Raj VK, Nabeel PM, Joseph J, et al. Methodological and measurement concerns of local pulse wave velocity assessment. IEEE Int Symp Med Meas Appl. 2019;1–6.
- Joseph J, Nabeel PM, Shah MI, et al. Arterial compliance probe for cuffless evaluation of carotid pulse pressure. PLoS One. 2018;13(8):e0202480–19.
- Lantelme P, Mestre C, Lievre M, et al. Heart rate: an important confounder of pulse wave velocity assessment. Hypertension. 2002;39(6):1083–1087.
- Sharman JE, Avolio AP, Baulmann J, et al. Validation of non-invasive Central blood pressure devices: ARTERY society task force consensus statement on protocol standardization. Eur Heart J. 2017;38(37):2805–2812.