
Abstract
Purpose
The dismal combination of hypertension and chronic kidney disease potentiates both cardiovascular disease and loss of renal function. Research points to the importance of arterial and left ventricular stiffening in this process but few studies have compared aspects of central and peripheral hemodynamics in relation to renal function in hypertension.
Materials and methods
We investigated 107 hypertensive individuals with renal function ranging from normal to severe dysfunction with pulse wave analysis to obtain central blood pressures (BP), augmentation index, carotid-femoral and carotid-radial pulse wave velocity (cfPWV, crPWV), aortic-to-brachial stiffness mismatch (cfPWV/crPWV), endothelial function by forearm flow-mediated vasodilation and myocardial microvascular function by subendocardial viability ratio, and indices of left ventricular structure (left ventricular mass index and relative wall thickness, RWT) and diastolic function (left atrial volume index, E/A, and E/é).
Results
Mean age was 58 years, BP 149/87 mm Hg, 9% had cardiovascular disease, and 31% were on antihypertensive treatment. Mean estimated glomerular filtration rate (eGFR) was 74 (range 130–21) ml/min × 1.73 m2. Whereas cfPWV and cfPWV/crPWV were independently related to eGFR (r = −0.20, p = 0.002, r = −0.16, p = 0.01), central diastolic BP (r = 0.21, p = 0.04), RWT (r = −0.34, p = 0.001), E/é (r = −0.39, p < 0.001) and E/A (r = 0.27, p = 0.01) were related to eGFR in bivariate correlations, but these findings were not retained in multivariate analyses. Remaining markers of hypertensive heart disease and measures of microvascular function were not related to eGFR.
Conclusion
Increased aortic stiffness and aortic-to-brachial stiffness mismatch are independently related to reduced eGFR in hypertensive patients, suggesting an important role for aortic stiffness in the evolution of hypertension-mediated renal dysfunction. Aortic stiffness and aortic-brachial stiffness mismatch may be useful early markers to find hypertensive patients at risk for decline in renal function.
Introduction
Increased blood pressure is the leading cause of cardiovascular morbidity and premature death, and hypertension is a major cause of chronic kidney disease (CKD) [Citation1,Citation2]. CKD is a condition with markedly increased cardiovascular risk, and the leading cause of death in patients with CKD is indeed cardiovascular disease [Citation3]. Thus, the combination of hypertension and CKD is an alarming situation, which accelerates the progression of both cardiovascular morbidity and renal disease [Citation3,Citation4].
Evidence shows the importance of structural cardiac and vascular alterations with arterial and left ventricular remodelling and stiffening in patients with CKD-related vascular disease [Citation5–8]. Studies in individuals with estimated glomerular filtration rate (eGFR) >60 ml/min × 1.73 m2 and in patients with CKD suggest that aortic stiffness assessed by pulse pressure or by pulse wave velocity (PWV) derived from pulse wave analysis, can predict a decline in renal function, and progression to end stage renal disease and death [Citation5,Citation9–12]. However, an increased aortic stiffness is apparently not accompanied by an increased peripheral arterial stiffness in CKD patients, since previous studies have shown a decrease in carotid-to-radial PWV [Citation13]. This aortic-to peripheral stiffness mismatch has gained interest as a potential mediator in the development of renal injury [Citation14–16]. This said, there are few studies in hypertensive people with latent or mild CKD comparing aortic stiffness and aortic-brachial stiffness mismatch, myocardial function, and endothelial function in relation to renal function. Thus, we still lack tools to single out hypertensive individuals prone to develop renal dysfunction, which would facilitate preventive efforts.
The feasibility of the assessment of arterial stiffness to reclassify subjects, particularly at intermediate risk of future cardiovascular disease, has been acknowledged [Citation17]. While measures of arterial function are sparsely used in the clinical setting today, as they have been considered time-consuming, operator-dependent, and expensive, the technical development is rapid and these issues are underway to be resolved. Furthermore, the different impacts of antihypertensive medication on arterial stiffness beyond that of blood pressure-lowering have gained interest and are an important part of personalised antihypertensive treatment [Citation18–20]. Thus, this study aimed to provide simultaneously obtained information about several markers of cardiac and vascular function, and to assess their independent associations to renal function. Accordingly, we performed detailed investigations of cardiac structure and function, aortic and peripheral arterial stiffness, and endothelial function in a hypertensive population with renal function ranging from normal to CKD stage 4.
Materials and methods
Study design and setting
This patient cohort originates from two previously published randomised interventional trials, the Doxazosin-Ramipril Study (DoRa) [Citation21] and the Sympathetic Activation and Inflammation in Moderate Kidney Failure and in Diabetic Nephropathy: Disease Modification with Vitamin-D Receptor Activation – the SOLID Trial (SOLID) [Citation22]. These studies included men and women >18 years, with either hypertension and eGFR >60 ml/min × 1.73 m2 (DoRa), or CKD patients with hypertension and eGFR 59–15 ml/min × 1.73 m2 (SOLID). Patients were eligible with a mean of 2 or more measurements >140 mm Hg systolic and/or >90 mm Hg diastolic by standard techniques in the clinical setting, or ongoing antihypertensive medication. The primary aims of DoRa were to evaluate the effects of treatment with ramipril or doxazosin on endothelial function and haemostasis [Citation21,Citation23] and for SOLID to examine the effects of paricalcitol on sympathetic activation, endothelial function, arterial stiffness, and inflammatory markers [Citation22]. For the current post hoc analysis only baseline measurements were used. Both studies were approved of by the appropriate Ethics committee, performed in accordance with the Declaration of Helsinki, and all patients provided oral and written informed consent. Both studies are registered at clinicaltrails.gov (NCT02901977 and NCT01204528).
Procedures
All investigations were performed at the Cardiovascular research laboratory, within the Clinical research centre, Danderyd University Hospital, Stockholm (Sweden). The procedures were performed in the supine position in a quiet room, after overnight fasting and without the intake of morning medicines. For details, see elsewhere [Citation21,Citation22].
Brachial blood pressure was obtained by an oscillometric device (OMRON 705IT, OMRON Healthcare Co Ltd, Kyoto, Japan) on the right arm with an appropriately sized cuff as a mean of 3 readings. Mean arterial pressure (MAP) was calculated as DBP + 1/3 (SBP–DBP). Pulse wave analysis by applanation tonometry (Millar Instruments, Houston, TX, USA) assessed by the integral software of a SphygmoCor device (AtCor Pty, West Ryde, NSW, Australia) was used to obtain an averaged peripheral and central waveform, from which carotid-radial and carotid-femoral PWV (crPWV and cfPWV, respectively), central systolic and diastolic blood pressure (cSBP and cDBP), and pulse wave augmentation index (AIx) were calculated according to recommendations [Citation24], as described previously [Citation21,Citation22]. Furthermore, cfPWV/crPWV was calculated, as a marker of aortic-brachial stiffness mismatch [Citation14].
Endothelium-dependent flow mediated vasodilatation (FMD) was assessed by forearm ischaemia induced reactive hyperaemia and measured as relative change in brachial artery diameter from rest by a Vivid 7 Dimension ultrasound device (GE Medical System, Horten, Norway) according to recommendations [Citation25], as described previously [Citation21,Citation22]. Subendocardial viability ratio (SEVR) was assessed as a marker of coronary microvascular function and derived from a general transfer function using pulse wave analysis, as described elsewhere [Citation26] SEVR is a non-invasive estimate of myocardial oxygen supply and demand, calculated as the ratio (aortic diastolic pressure × time integral)/(aortic systolic blood pressure × time integral), which is taken to represent subendocardial perfusion capacity relative to myocardial contraction, i.e. myocardial perfusion relative to cardiac workload [Citation27,Citation28].
Transthoracic echocardiography and conventional pulsed Doppler echocardiography (Vivid 7 Dimension, GE Medical System, Horten, Norway) was performed according to current recommendations [Citation29,Citation30], as described elsewhere [Citation31]. Left chamber dimensions were used to calculate left atrial volume and left ventricular mass, both indexed to body surface area to express left atrial volume index (LAVI) and left ventricular mass index (LVMI). Left ventricular relative wall thickness (RWT) was calculated as (interventricular septum thickness + posterior wall thickness)/left ventricular end-diastolic diameter. Left ventricular diastolic function was assessed using E/A, E/é, and LAVI.
Body mass index was calculated as weight/height2. Routine biochemistry was analysed by standard procedures from fasting blood samples. eGFR was calculated by the CKD-EPI formula. Low density lipoprotein cholesterol (LDL) values were calculated by the Friedewald formula as total cholesterol – plasma HDL – (0.45 × fasting plasma triglycerides).
Statistical analyses
Data are presented as mean values ± SD or n and proportions (percentage), as appropriate. Analysis of variance (ANOVA) was used to compare strata of eGFR, grouped as >90ml/ml × 1,73 m2, 89–60 ml/ml × 1,73 m2, 59–30 ml/ml × 1,73 m2, and <30ml/ml × 1,73 m2. Bivariate correlations were used to investigate the relationship between circulatory variables and eGFR. Bivariate correlations between stiffness indices and MAP were also analysed, to further clarify the roles of each in relation to renal function. In case of correlations with eGFR and p < 0.1, multivariate linear regression analyses were performed, including age, sex, height, heart rate, MAP, previous cardiovascular disease (myocardial infarction, heart failure, atrial fibrillation, transient ischaemic attack, haemorrhagic or ischaemic stroke), and antihypertensive medication as covariates. Separate models with SBP, DBP, and pulse pressure instead of MAP were also performed. The significance level was set to a two-sided probability (p) value of <0.05. SPSS versions 25 and 27 (IBM Corp. IBM SPSS Statistics for Windows. Armonk, NY), were used for the analyses.
Results
General
The baseline characteristics of the 107 participants are presented in . Renal function ranged from eGFR 130 to 21 ml/min × 1.73 m2. Antihypertensive medication was present in 33 (31%), almost exclusively in patients with eGFR ≤59 ml/min × 1.73 m2. Concomitant cardiovascular disease was present in only 10 patients (9%); however, it increased with decline in renal function.
Table 1. Baseline characteristics according to eGFR group.
Pulse wave analysis
Central blood pressures and indices of aortic and arterial stiffness according to the stage of renal function are shown in . Similar to brachial blood pressures (), there were differences in central blood pressure according to eGFR group () due to lower central blood pressures in the eGFR 59–30 ml/min × 1.73 m2 group, where 84% were on antihypertensive medication (). Accordingly, cDBP related to eGFR (r = 0.21, p = 0.04) but cSBP and cPP did not; and the relation for cDBP was not retained in a multivariate linear regression analysis.
Table 2. Circulatory measurements according to the eGFR group.
Both cfPWV and cfPWV/crPWV increased with groups having lower eGFR, whereas crPWV and AIx did not relate to eGFR group (). Accordingly, cfPWV (r = 0.40, p < 0.001) and cfPWV/crPWV (r = 0.39, p < 0.001) related inversely to eGFR, whereas crPWV did not relate to renal function (r = 0.07, p = 0.52) (). Furthermore, crPWV related to MAP (r = 0.33 p < 0.001), whereas cfPWV and cf/crPWV did not (r = 0.19 p = 0.07, and r = 0.06, p = 0.59, respectively). Subsequent multivariate regression analyses confirmed cfPWV and cfPWV/crPWV to be independently correlated with eGFR (r = −0.20, p = 0.002, and r = −0.16, p = 0.01, respectively). crPWV was independently related to MAP (r = 0.29, p = 0.005), whereas the trend for a relation between cfPWV and MAP was attenuated by accounting for the confounding influence of antihypertensive treatment (r = 0.19, p = 0.13). Multivariate regression analyses where MAP as covariate was replaced by SBP and DBP, or pulse pressure showed similar results (cfPWV with SBP and DBP instead of MAP: r = −0,18, p = 0,004; cfPWV with pulse pressure instead of MAP: r = −0.19, p = 0.003; cf/PWV/crPWV with SBP and DBP instead of MAP: r = −0.14 p = 0,02; cfPWV/crPWV with pulse pressure instead of MAP: r = −0.15, p = 0.02).
Figure 1. Relations between carotid-femoral pulse wave velocity (cfPWV) and eGFR. The solid regression line shows all 107 patients: bivariate correlation r = 0.40, p < 0.001; multivariate correlation slope = −1.9, R = 0.88, r = −0.20, p = 0.002. Broken line shows 74 patients without antihypertensive medication (only four cases had an eGFR <60 ml/min × 1.73m2), slope = −2.32, R = 0.58, r = −0.28 p = 0.08. The broken-dotted line shows 33 patients on antihypertensive medication (only two cases had a eGFR > 60 ml/min × 1.73m2), slope = −2.10, R = 0.63 r = −0.60, p = 0.003.
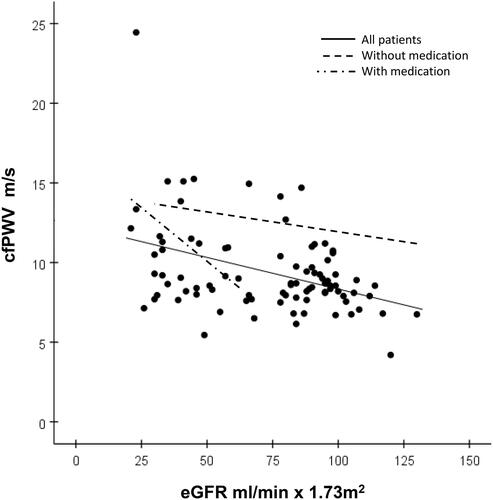
Figure 2. Relations between carotid-femoral pulse wave velocity (PWV) to carotid-radial PWV ratio (cfPWV/crPWV) and eGFR. The solid regression line shows all 107 patients: bivariate correlation r = 0.39, p < 0.001; multivariate correlation slope −14.8, R = 0.87, r = −0.16, p = 0.01. The broken line shows 74 patients without antihypertensive medication (only four cases had an eGFR <60 ml/min × 1.73 m2), slope = −19.3, R = 0.58, r = −0.23 p = 0.09. The broken-dotted line shows 33 patients on antihypertensive medication (only two cases had a eGFR > 60 ml/min × 1.73 m2), slope = −14.1, R = 0.50, r = −0.49 p = 0.03.
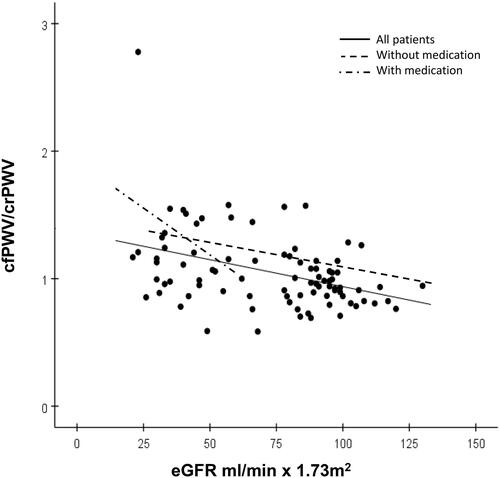
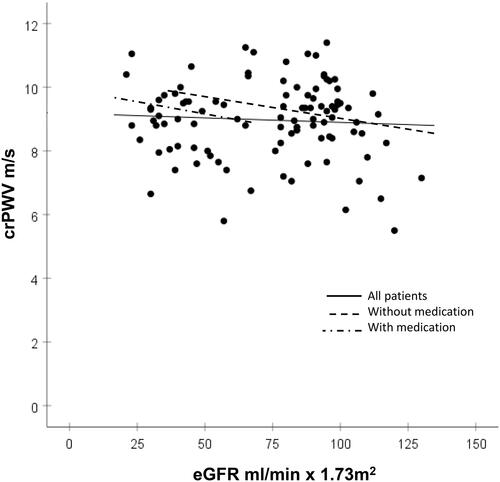
Figure 3. Relations between carotid to radial pulse wave velocity (crPWV) and eGFR. The solid regression line shows all 107 patients: bivariate correlation r = 0.07, p = 0.52, multivariate correlation slope = −1.47, R = 0.85, r = −0.07, p = 0.29. The broken line shows 74 patients without antihypertensive medication (only four cases with eGFR <60 ml/min × 1.73m2), slope = −0.28, R = 0.53, r = −0.02, p = 0.88. The broken-dotted line shows 33 patients on antihypertensive medication (only two cases with eGFR > 60 ml/min × 1.73m2), slope = −3.54, R = 0.35, r = −0.36, p = 0.18.
Endothelial function and myocardial microvascular function
Endothelial function (assessed by FMD) and myocardial microvascular function (assessed by SEVR) did not relate to renal function, neither by analyses by eGFR group (data not shown) nor by bivariate regression analyses ().
Echocardiographic measures
Echocardiographic indices for left ventricular structure and diastolic function according to eGFR group are shown in . RWT and E/é increased with groups having lower eGFR. In bivariate regression analyses, RWT was inversely related to eGFR (r = −0.34, p = 0.001), whereas E/é was inversely related and E/A directly related to eGFR (r = −0.39, p < 0.001; and r = 0.27, p = 0.01, respectively). However, none of these findings were retained significant in the multivariate regression analyses. No other echocardiographic indices of LV structure or diastolic function examined, related to renal function.
Discussion
This cross-sectional study in 107 hypertensive patients with renal function ranging from normal to severe dysfunction demonstrates independent associations between aortic stiffness and aortic-brachial stiffness mismatch, and renal function. However, assessments of forearm endothelial function, cardiac structure and function, and myocardial microvascular function failed to reveal similar associations to renal function.
Our finding of an association between increased cfPWV and impaired renal function is in agreement with reports of an increased aortic stiffness related to a decline in eGFR and to renal microvascular damage with microalbuminuria in hypertensive patients [Citation5,Citation32]. Aortic stiffness is related to blood pressure. However, aortic stiffness provides additional independent information to improve the prediction of CV events [Citation33], and aortic stiffness assessed by cfPWV increases before blood pressure in people with incident hypertension [Citation34]. These and other findings [Citation35,Citation36] suggest that aortic stiffness may serve as an early marker for people at increased risk to develop hypertension-mediated organ damage (such as an impaired renal function) and untoward prognosis.
Patients with CKD develop an aggressive structural vascular disease with inflammation and vascular calcification, with subsequent arterial stiffening [Citation6,Citation37,Citation38]. A greater aortic (cfPWV), as compared to brachial (crPWV) stiffness indicates a mismatch and loss of protection in the periphery for the propagating pulse wave, with increases in renal microvascular flow which induces end-organ damage [Citation39]. This seems to be especially important in CKD [Citation14,Citation40], where pulse wave propagation has been shown of importance to the microcirculation of the kidney [Citation15,Citation41]. In our study, increased aortic stiffness (cfPWV) was independently related to impaired renal function, whereas peripheral stiffness (crPWV) did not show such a relation. Furthermore, crPWV was independently related to blood pressure (MAP), whereas cfPWV and the cfPWV/crPWV ratio were not, in line with previous findings [Citation42]. We suggest that the impact of cfPWV on renal function is beyond central arterial forward wave pressures. A separation analysis of the central arterial waveform would help clarify this [Citation43–45]. Unfortunately the data available did not allow us to perform such an analysis. Thus, whether our findings are related to a pressure effect generated by forward travelling waves or because of a decrease in the impedance mismatch between central and peripheral arteries remains to be clarified.
Our results extend previous observations by revealing a relation of the aortic-to-brachial ratio to renal function independent of MAP, showing an increased stiffness mismatch in the CKD population. In addition, almost all patients with eGFR <60 ml/min × 1.73 m2 were on antihypertensive medication (see ), indicating that such therapy has insufficient beneficial effect on aortic stiffness. Studies performed in people with normal renal function indicate that cfPWV, pulse pressure and carotid artery stiffness can predict future decline of renal function [Citation5,Citation12]. Taken together, these and our results imply a central role for aortic stiffness and aortic-to-brachial stiffness mismatch in renal dysfunction, and suggest that these measures may be useful early markers for future risk of CKD in hypertensive patients with no overt renal dysfunction.
We did not find relations between cBP, cPP or AIx, and eGFR. Although these measures seem to predict future CV events in late-stage CKD [Citation46,Citation47], the impact on the decline in renal function in earlier stages of renal dysfunction is inconsistent. However, few of our patients with eGFR >60 ml/min × 1.73m2 were on antihypertensive medications, while nearly all with eGFR <60 ml/min × 1.73m2 were treated. This may, at least in part, confound our findings and explain why no independent relations for these markers to eGFR were observed.
Endothelial function (here assessed by FMD) did not relate to eGFR in this study. This is in line with previous results, where endothelial dysfunction evaluated by FMD seems to be more related to comorbidity with CV disease in late-stage CKD than to declining kidney function [Citation48–50]. These results, together with our findings, imply that endothelial function assessed by FMD is not as useful as measures of arterial stiffness to predict renal dysfunction. Neither did myocardial microvascular function (evaluated by SEVR) relate to renal function. SEVR is an established non-invasive marker of coronary flow reserve [Citation27,Citation28], relates to albuminuria in CKD patients [Citation51,Citation52] and predicts CV prognosis in moderate to late stage CKD [Citation53,Citation54]. However, coronary microvascular function may be more closely related to the development of atherosclerosis, while hypertension mediated changes in renal microvascular function may depend more on arteriosclerotic manifestations, which could contribute to our findings. In addition, there may be confounding influence by antihypertensive medications such as blockers of the renin-angiotensin system (with anti-inflammatory and nitric oxide releasing properties) on endothelial function measurements, as compared to indices of aortic stiffness such as PWV.
Finally, we found that indices of LV structural remodelling (RWT) and of diastolic dysfunction (E/é) related to decline in renal function. This is in agreement with observations in patients with manifest CKD, where LV structural changes and diastolic dysfunction predict CV events and negative renal outcome [Citation7,Citation55]. However, our results were not retained in multivariate analyses, suggesting possible confounding influence by e.g. blood pressure and concomitant medication.
Limitations
This was a cross-sectional study and prospective implications could not be assessed. The study sample was relatively small, and there were few subjects with severe renal dysfunction. There were also differences in antihypertensive treatment, with more medication as eGFR declined. However, statistical models were used to control for BP and ongoing treatment. Lastly, we only used standard echocardiographic measures, and more advanced techniques might have rendered other results.
Conclusions
Aortic stiffness and aortic-to-brachial stiffness mismatch are independently related to eGFR in hypertensive patients, suggesting an important role for aortic stiffness in the evolution of early hypertension mediated renal dysfunction. Furthermore, aortic stiffness remained associated with CKD even after risk factor management, while other measures of organ damage did not relate to CKD. Thus, compared to assessments of endothelial or microvascular function, or cardiac structure or function, aortic PWV may be an earlier and more specific measure for CKD. We suggest aortic stiffness and aortic-to-brachial stiffness mismatch to be potentially useful markers to identify hypertensive patients at risk for progressive decline in renal function, where preventive measures may be of particular value. Properly designed prospective studies are warranted.
Acknowledgements
We thank Ms. E. Andersson, J. Rasck and E. Wallén Nielsen for expert technical assistance.
Disclosure statement
KL declares advisory board honoraria from NovoNordisk and Bayer. JS declares speaker honoraria from AstraZeneca, Bayer, Boehringer-Ingelheim and NovoNordisk, and advisory board honoraria from AstraZeneca and NovoNordisk. TK declares research grants to Karolinska Institutet from Amgen, Medtronic, and ReCor Medical; all outside the submitted work. SJ declares speaker honoraria and advisory board honoraria from AstraZeneca, Astellas, ViforPharma, Baxter and Fresenius Medical Care. LD and AJ, have no conflicts of interest to report.
Additional information
Funding
References
- Lopez AD, Mathers CD, Ezzati M, et al. Global and regional burden of disease and risk factors, 2001: systematic analysis of population health data. Lancet. 2006;367(9524):1747–1757.
- Hamrahian SM, Falkner B. Hypertension in chronic kidney disease. Adv Exp Med Biol. 2017;956:307–325.
- Ronco C, Di Lullo L. Cardiorenal syndrome. Heart Fail Clin. 2014;10(2):251–280.
- Duni A, Dounousi E, Pavlakou P, et al. Hypertension in chronic kidney disease: novel insights. Curr Hypertens Rev. 2020;16(1):45–54.
- Sedaghat S, Mattace-Raso FU, Hoorn EJ, et al. Arterial stiffness and decline in kidney function. Clin J Am Soc Nephrol. 2015;10(12):2190–2197.
- Schlieper G, Schurgers L, Brandenburg V, et al. Vascular calcification in chronic kidney disease: an update. Nephrol Dial Transplant. 2016;31(1):31–39.
- Paoletti E, De Nicola L, Gabbai FB, et al. Associations of left ventricular hypertrophy and geometry with adverse outcomes in patients with CKD and hypertension. Clin J Am Soc Nephrol. 2016;11(2):271–279.
- Townsend RR, Anderson AH, Chirinos JA, et al. Association of pulse wave velocity with chronic kidney disease progression and mortality: findings from the CRIC Study (Chronic Renal Insufficiency Cohort). Hypertension. 2018;71(6):1101–1107.
- Ford ML, Tomlinson LA, Chapman TP, et al. Aortic stiffness is independently associated with rate of renal function decline in chronic kidney disease stages 3 and 4. Hypertension. 2010;55(5):1110–1115.
- Peralta CA, Jacobs DR, Jr., Katz R, et al. Association of pulse pressure, arterial elasticity, and endothelial function with kidney function decline among adults with estimated GFR >60 mL/min/1.73 m(2): the Multi-Ethnic Study of Atherosclerosis (MESA). American Journal of Kidney Diseases. 2012;59(1):41–49.
- Madero M, Peralta C, Katz R, et al. Association of arterial rigidity with incident kidney disease and kidney function decline: the health ABC study. CJASN. 2013;8(3):424–433.
- van Varik BJ, Vossen LM, Rennenberg RJ, et al. Arterial stiffness and decline of renal function in a primary care population. Hypertens Res. 2017;40(1):73–78.
- Utescu MS, Couture V, Mac-Way F, et al. Determinants of progression of aortic stiffness in hemodialysis patients: a prospective longitudinal study. Hypertension. 2013;62(1):154–160.
- Fortier C, Mac-Way F, Desmeules S, et al. Aortic-brachial stiffness mismatch and mortality in dialysis population. Hypertension. 2015;65(2):378–384.
- Woodard T, Sigurdsson S, Gotal JD, et al. Mediation analysis of aortic stiffness and renal microvascular function. J Am Soc Nephrol. 2015;26(5):1181–1187.
- Kim ED, Tanaka H, Ballew SH, et al. Associations between kidney disease measures and regional pulse wave velocity in a large community-based cohort: the Atherosclerosis Risk in Communities (ARIC) study. Am J Kidney Dis. 2018;72(5):682–690.
- Wilkinson IB, Mäki-Petäjä KM, Mitchell GF. Uses of arterial stiffness in clinical practice. Arterioscler Thromb Vasc Biol. 2020;40(5):1063–1067.
- Boutouyrie P, Lacolley P, Briet M, et al. Pharmacological modulation of arterial stiffness. Drugs. 2011;71(13):1689–1701.
- Laurent S, Chatellier G, Azizi M, et al. SPARTE study: normalization of arterial stiffness and cardiovascular events in patients with hypertension at medium to very high risk. Hypertension. 2021;78(4):983–995.
- Safar ME. Arterial stiffness as a risk factor for clinical hypertension. Nat Rev Cardiol. 2018;15(2):97–105.
- Jekell A, Kalani M, Kahan T. The effects of alpha 1-adrenoceptor blockade and angiotensin converting enzyme inhibition on central and brachial blood pressure and vascular reactivity: the doxazosin-ramipril study. Heart Vessels. 2017;32(6):674–684.
- Lundwall K, Jörneskog G, Jacobson SH, et al. Paricalcitol, microvascular and endothelial function in non-diabetic chronic kidney disease: a randomized trial. Am J Nephrol. 2015;42(4):265–273.
- Ekholm M, Jekell A, Wallén NH, et al. Effects of angiotensin-converting enzyme inhibition and alpha 1-Adrenergic receptor blockade on inflammation and hemostasis in human hypertension. J Cardiovasc Pharmacol. 2018;71(4):240–247.
- Laurent S, Cockcroft J, Van Bortel L, et al. Expert consensus document on arterial stiffness: methodological issues and clinical applications. Eur Heart J. 2006;27(21):2588–2605.
- Corretti MC, Anderson TJ, Benjamin EJ, et al. Guidelines for the ultrasound assessment of endothelial-dependent flow-mediated vasodilation of the brachial artery: a report of the international brachial artery reactivity task force. J Am Coll Cardiol. 2002;39(2):257–265.
- Jekell A, Kalani M, Kahan T. Skin microvascular reactivity and subendocardial viability ratio in relation to dyslipidemia and signs of insulin resistance in non-diabetic hypertensive patients. Microcirculation. 2022;29(2):e12747.
- Hoffman JI, Buckberg GD. The myocardial supply: demand ratio-a critical review. Am J Cardiol. 1978;41(2):327–332.
- Tsiachris D, Tsioufis C, Syrseloudis D, et al. Subendocardial viability ratio as an index of impaired coronary flow reserve in hypertensives without significant coronary artery stenoses. J Hum Hypertens. 2012;26(1):64–70.
- Lang RM, Badano LP, Mor-Avi V, et al. Recommendations for cardiac chamber quantification by echocardiography in adults: an update from the American Society of Echocardiography and the European Association of Cardiovascular Imaging. Eur Heart J Cardiovasc Imaging. 2015;16(3):233–270.
- Nagueh SF, Smiseth OA, Appleton CP, et al. Recommendations for the evaluation of left ventricular diastolic function by echocardiography: an update from the American Society of Echocardiography and the European Association of Cardiovascular Imaging. Eur Heart J Cardiovasc Imaging. 2016;17(12):1321–1360.
- Iacobaeus C, Andolf E, Thorsell M, et al. Cardiac function, myocardial mechano-energetic efficiency, and ventricular-arterial coupling in normal pregnancy. J Hypertens. 2018;36(4):857–866.
- Hashimoto J, Ito S. Central pulse pressure and aortic stiffness determine renal hemodynamics: pathophysiological implication for microalbuminuria in hypertension. Hypertension. 2011;58(5):839–846.
- Ben-Shlomo Y, Spears M, Boustred C, et al. Aortic pulse wave velocity improves cardiovascular event prediction: an individual participant meta-analysis of prospective observational data from 17,635 subjects. J Am Coll Cardiol. 2014;63(7):636–646.
- Kaess BM, Rong J, Larson MG, et al. Aortic stiffness, blood pressure progression, and incident hypertension. JAMA. 2012;308(9):875–881.
- Böcskei RM, Benczúr B, Müller V, et al. Oscillometrically measured aortic pulse wave velocity reveals asymptomatic carotid atherosclerosis in a middle-aged, apparently healthy population. Biomed Res Int. 2020;2020:1–7.
- Sehestedt T, Jeppesen J, Hansen TW, et al. Risk prediction is improved by adding markers of subclinical organ damage to SCORE. Eur Heart J. 2010;31(7):883–891.
- Townsend RR. Arterial stiffness in CKD: a review. Am J Kidney Dis. 2019;73(2):240–247.
- Safar ME, Plante GE, Mimran A. Arterial stiffness, pulse pressure, and the kidney. Am J Hypertens. 2015;28(5):561–569.
- Laurent S, Agabiti-Rosei C, Bruno RM, et al. Microcirculation and macrocirculation in hypertension: a dangerous cross-link? Hypertension. 2022;79(3):479–490.
- Yu S, McEniery CM. Central versus peripheral artery stiffening and cardiovascular risk. Arterioscler Thromb Vasc Biol. 2020;40(5):1028–1033.
- Stea F, Sgrò M, Faita F, et al. Relationship between wave reflection and renal damage in hypertensive patients: a retrospective analysis. J Hypertens. 2013;31(12):2418–2424.
- Fortier C, Sidibé A, Desjardins MP, et al. Aortic-brachial pulse wave velocity ratio: a blood pressure-independent index of vascular aging. Hypertension. 2017;69(1):96–101.
- Kips JG, Rietzschel ER, De Buyzere ML, et al. Evaluation of noninvasive methods to assess wave reflection and pulse transit time from the pressure waveform alone. Hypertension. 2009;53(2):142–149.
- Westerhof BE, Guelen I, Westerhof N, et al. Quantification of wave reflection in the human aorta from pressure alone: a proof of principle. Hypertension. 2006;48(4):595–601.
- Weber T, Wassertheurer S, Rammer M, et al. Wave reflections, assessed with a novel method for pulse wave separation, are associated with end-organ damage and clinical outcomes. Hypertension. 2012;60(2):534–541.
- Kousios A, Kouis P, Hadjivasilis A, et al. Cardiovascular risk assessment using ultrasonographic surrogate markers of atherosclerosis and arterial stiffness in patients with chronic renal impairment: a narrative review of the evidence and a critical view of their utility in clinical practice. Can J Kidney Health Dis. 2020;7:2054358120954939.
- Lioufas N, Hawley CM, Cameron JD, et al. Chronic kidney disease and pulse wave velocity: a narrative review. Int J Hypertens. 2019;2019:9189362.
- Lilitkarntakul P, Dhaun N, Melville V, et al. Blood pressure and not uraemia is the major determinant of arterial stiffness and endothelial dysfunction in patients with chronic kidney disease and minimal co-morbidity. Atherosclerosis. 2011;216(1):217–225.
- Verbeke FH, Pannier B, Guérin AP, et al. Flow-mediated vasodilation in end-stage renal disease. CJASN. 2011;6(8):2009–2015.
- Kopel T, Kaufman JS, Hamburg N, et al. Endothelium-dependent and -independent vascular function in advanced chronic kidney disease. CJASN. 2017;12(10):1588–1594.
- Ekart R, Bevc S, Hojs N, et al. Albuminuria is associated with subendocardial viability ratio in chronic kidney disease patients. Kidney Blood Press Res. 2015;40(6):565–574.
- Ekart R, Šegula A, Hartman T, et al. Subendocardial viability ratio is impaired in highly proteinuric chronic kidney disease patients with low estimated glomerular filtration rate. Ther Apher Dial. 2016;20(3):281–285.
- Di Micco L, Salvi P, Bellasi A, et al. Subendocardial viability ratio predicts cardiovascular mortality in chronic kidney disease patients. Blood Purif. 2013;36(1):26–28.
- Ekart R, Bevc S, Hojs N, et al. Derived subendocardial viability ratio and cardiovascular events in patients with chronic kidney disease. Cardiorenal Med. 2019;9(1):41–50.
- Toida T, Toida R, Yamashita R, et al. Grading of left ventricular diastolic dysfunction with preserved systolic function by the 2016 American Society of Echocardiography/European Association of Cardiovascular Imaging recommendations contributes to predicting cardiovascular events in hemodialysis patients. Cardiorenal Med. 2019;9(3):190–200.