
Abstract
Purpose: This study aims to analyse the direct and indirect relationship between the prevalence of depression and hypertension through central obesity in the Indonesian population.
Material and methods: This quantitative analytical observational study is based on secondary data with a cross-sectional design. The data is taken from the Indonesian Baseline Health Research of the Health Research and Development Agency in 2018, which is aggregated data from survey results on household members in 34 Indonesian provinces. We used path analysis and the Sobel test using AMOS 23.0 program to assess the direct and indirect relationship of depression and obesity to hypertension. Multiple linear regression analysis was used to determine the effect of confounding factors on hypertension.
Results: The average prevalence (± SD) of depression, central obesity and hypertension in 2018 was 6.21% (± 2.30), 31.26% (± 4.80), and 31.07% (± 4.76). There was an indirect positive relationship between depression and hypertension through central obesity (p = 0.041). The direct effect of depression was associated with a 17% chance of being centrally obese (p = 0.009), and the direct effect of depression and central obesity was associated with a 32.7% chance of becoming hypertensive (p = 0.001). There is no significant direct relationship between depression and hypertension. The effect of confounding factors on hypertension was 21.9% (p = 0.007), lower than the effect of depression and central obesity.
Conclusion: Central obesity might be an intermediate variable linking depression and hypertension.
Keywords:
Introduction
Hypertension is one of the leading causes of mortality globally, accounting for 7.6 million fatalities each year (13.5% of all deaths). It is associated with 54% of strokes and 47% of coronary heart disease, and over 80% of this burden occurs in low and middle-income nations [Citation1]. In Indonesia, 34.1% of adults are estimated to have hypertension. This prevalence is lower than Southeast Asia and Australia's prevalence of 35.4% but has increased from the previous national prevalence in 2013 (25.8%) [Citation2–4]. In addition, the Indonesian May Measurement Months (MMM) screening in 2018 showed that only around 47.6% of people were aware of having hypertension, 47.4% of people were under hypertension treatment, and 78.0% of them still had uncontrolled blood pressure [Citation5]. This data demonstrates the poor awareness of hypertension in Indonesian society, as well as the difficulties in controlling it. The treatment of hypertension should involve lifestyle modification, as it can also reduce the risk of cardiovascular disease [Citation6,Citation7].
Obesity is a known risk factor for hypertension and abdominal circumference is used to measure central obesity. The increased abdominal circumference can raise the risk of hypertension, whereas a reduction in abdominal circumference can lower blood pressure [Citation8]. Several researchers have also consistently discovered a link between obesity and depressive symptoms. These two-risk factors are capable of coexisting and influencing one other. A meta-analysis involving 15 prospective observational studies found that depressed people are more likely to become obese and obese people are more likely to become depressed [Citation9].
According to several research, psychological variables may have a role in the development of cardiovascular disease. Symptoms of depression have been linked to an increased incidence of hypertension in the National Health and Nutrition Examination Survey I Epidemiologic Follow-up Study (NHEFS-I) and the Coronary Artery Risk Development in Young Adults (CARDIA) prospective study [Citation10,Citation11]. However, not all population shows similar results. This can be due to the influence of race, culture, and largely indirect causal relationships through intermediate factors for many other patient populations [Citation12,Citation13]. As such the present study was conducted to examine the direct and indirect relationship between the prevalence of depression, central obesity, and hypertension in the Indonesian population. We also include the relative influence of depression and obesity on hypertension with the influence of confounding factors such as Diabetes mellitus (DM), chronic kidney disease (CKD), and Cigarette smoking.
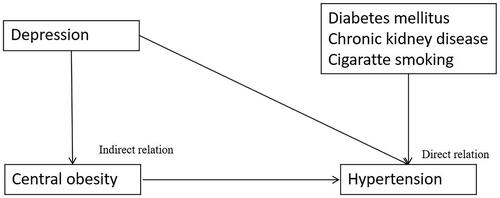
We made the hypothesis as follows. The prevalence of depression was considered to be directly associated with the prevalence of central obesity, and the prevalence of central obesity was considered to be directly associated with the prevalence of hypertension. Even though some evidence said that depression was directly associated with hypertension, we believe that the prevalence depression was indirectly associated with the prevalence of hypertension due to higher prevalence of central obesity (intermediate variable) [Citation10–12]. We think that there was no direct association between the prevalence of depression and the prevalence of hypertension. The flow chart depicted in essentially summarises the inter-relationships.
Figure 1. Flowchart illustrating the study’s conceptual framework. The dependent variable was hypertension. The independent variable was depression. The moderating variable was central obesity. The confounding variables were diabetes mellitus, chronic kidney disease, and cigarette smoking.
Methods
This was a cross-sectional study which evaluated the direct and indirect relationship of depression and central obesity to hypertension based on secondary data obtained from Indonesian Baseline Health Research 2018 (http://repository.litbang.kemkes.go.id/3514/). We then compared the overall effect of depression and central obesity on hypertension to the overall effect of confounding factors (DM, CKD, and cigarette smoking) on hypertension to determine which effect was greater. Primary data collection was carried out by the Health Research and Development Agency of the Indonesian ministry of health. Independent external data validation was carried out by the Indonesian Health Research Association (APKESI).
Patients
The population of this study was all 34 provinces in Indonesia which was registered to participate in 2018 Indonesian Baseline Health research. Every 34 provinces provide aggregate data in the form of prevalence. The Indonesian Ministry of Health's Health Research and Development Agency granted permission to use the data therefore the participants' informed consent was omitted.
Data collection
The data we took from 2018 Indonesian Baseline Health Research were the prevalence of depression, central obesity, DM, CKD, cigarette smoking, and hypertension. This baseline health research involved 300.000 households and was conducted by the trained professional from Indonesian health ministry with a minimum educational background of associate’s degree in health.
The prevalence of depression was calculated by dividing the total number of people over 15 years old who were depressed according to the Mini-International Neuropsychiatric Interview (MINI) with the total population over 15 years old. MINI is a short structured diagnostic interview for DSM-IV and ICD-10 psychiatric disorders including depression or anxiety disorder, created jointly by psychiatrists and physicians in the United States and Europe [Citation14]. The official version of MINI-International Neuropsychiatric in local language has been used extensively by the Indonesian Ministry of Health to measure community mental health. The MINI interview instrument has been validated in Indonesian population [Citation15].
The prevalence of central obesity is calculated by dividing the population over 15 years old who had central obesity (males with an abdominal circumference of more than 90 cm and females with an abdominal circumference of more than 80 cm for east Asian region) with the total population over 15 years old. Waist circumference was measured by using measuring tape at the midpoint between the lower margin of the least palpable rib and the top of the iliac crest [Citation16]. Abdominal circumference is a way of measuring central obesity that gives independent risk information not included in body mass index (BMI) [Citation17].
The prevalence of hypertension was obtained by dividing the entire hypertensive population with the total population over 18 years old. Hypertension diagnosis was based on a measurement of an average systolic blood pressure of more than 140 mmHg or a diastolic blood pressure of more than 90 mmHg. Blood pressure was measured three times followed the standard of International society of hypertension global hypertension practice guidelines [Citation18].
The prevalence of DM was obtained by dividing the entire DM population over 15 years old with the total population over 15 years old [Citation3]. Diabetes mellitus can be diagnosed if any of the following criteria are met [Citation1]: Fasting plasma glucose greater than 126 mg/dL (7.0 mmol/L). Fasting is defined as not consuming any calories for at least 8 h [Citation2]. two-hour plasma glucose ≥ 200 mg/dL (11.1 mmol/L) after glucose loading [Citation3]. based on doctor’s diagnosis or diabetic medication. The Accuchek Performa device was used for the measurement [Citation19].
The prevalence of CKD was obtained by dividing the entire CKD population over 15 years old with the total population over 15 years old [Citation3]. The doctor's diagnosis of CKD was based on an estimated glomerular filtration rate of less than 60 mL/min/1.73 m2, as defined by Kidney Disease Outcomes Quality Initiative (KDOQI) guidelines. Blood/plasma samples was collected for assessing serum creatinine levels to calculate the estimated glomerular filtration rate using modification of diet in renal disease equation [Citation20].
Interviews were used to determine the prevalence of cigarette smoking by dividing the entire population over 15 years old who smoked at least in the last month with the total population over 15 years old [Citation3].
Ethical statement
The Institutional Ethics Committee of Dr. Soetomo General Hospital approved our study protocol (approval number: 31/EC/KEPK/FKUA/2022). All data that could reveal the identity of the subjects have been omitted.
Statistical analysis
This quantitative, analytical observational study is based on secondary data with a cross-sectional design. The prevalence of hypertension, the prevalence of depression, and the prevalence of central obesity were the dependent, independent and intermediate variables, respectively. While the prevalence of DM, CKD and cigarette smoking were the confounding variable. The analysis we used in this study was path analysis. This analysis was chosen because there is a mediating variable that functions as an intermediary for the relationship between the independent variable and the dependent variable. Path analysis was used to investigate the direct effect and the Sobel test was used to evaluate the indirect effect. The analysis we used for confounding factors was multiple linear regression analysis.
The Sobel test is a statistical approach for determining the significance of a mediation effect. The test is an application of the delta technique based on the work of Michael E. Sobel, a professor of statistics at Columbia University, New York. In mediation, it is theorised that the link between the independent variable and the dependent variable is an indirect effect caused by the impact of a third variable (the mediator). When the mediator is included in a regression model with the independent variable, the influence of the independent variable is diminished but the effect of the mediator remains substantial. The Sobel test is essentially a customised t-test that gives a means for determining if the reduction in the influence of the independent variable caused by the inclusion of the mediator is statistically significant, and consequently whether the mediation effect is statistically significant [Citation21,Citation22].
The IBM AMOS (Analysis of Moment Structure) version 23 application is used to organise data. Data from the independent, mediating, confounding and dependent variables in the form of ratio data will be processed descriptively by looking at the mean and standard deviation. The 0.05 p value was used in this study.
Results
The results of the prevalence of central obesity, depression, hypertension, and confounding factors from all provinces in Indonesia can be seen in . The province of east Nusa Tenggara had the lowest percentage of central obesity at 19.30%, while the province of Gorontalo had the highest percentage of central obesity at 42.50%. The average percentage of obesity from all provinces is 31.26% ± 4.80%. The lowest percentage of depressed people in Indonesia is 1.80% in Jambi province, while the highest is 12.30% in Central Sulawesi province. The average percentage of the population with depression from all provinces is 6.05% ± 2.30%. The lowest percentage of people with hypertension in an Indonesian province is 22.22%, in the province of Papua, and the highest is 44.13% in the province of Central Sulawesi. The average percentage of the population with hypertension is 31.07% ± 29.83% across all provinces. Then for the confounding variables, the results showed that the highest DM percentage was in DKI Jakarta province (2.60%), the lowest was in NTT province (0.60%), the highest percentage of CKD was in North Kalimantan province (0.64%), and the lowest was in West Sulawesi province (0.18%). The highest percentage of cigarette consumption is in the province of Lampung (28.10%), the lowest is in the province of Papua (18.8%). The average value reflects the standard to determine whether the percentage in each province is above the average or below the average.
Table 1. Description of research variables.
and demonstrate the result from path analysis. The effect of depression on obesity was shown to have a coefficient of 0.413. This coefficient was positive, implying positive association between the prevalence of depression and obesity. (p = 0.009). The effect of depression on hypertension obtained a coefficient value of 0.116 which also implied positive association, however this relationship was not significant (p = 0.459). Obesity's effect on hypertension was found to have a coefficient of 0.514, indicating a positive relationship (p = 0.001). There is a significant indirect effect of depression on hypertension through obesity with a coefficient value of 0.212 (p = 0.041). Depression and obesity have a combined effect of 32.7% on hypertension.
Figure 2. Path model with estimate values.
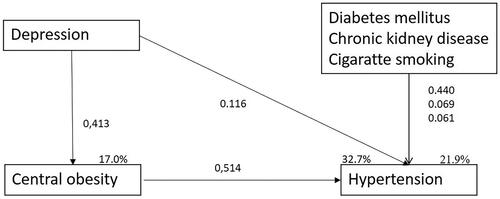
Table 2. Path analysis test, direct and indirect effect.
In terms of confounding factors, the findings of the multiple linear regression analysis show that DM, when compared to CKD and smoking, had the greatest effect on hypertension, with a significant coefficient value of 0.440 (p = 0.013). The positive coefficient indicates that the larger the percentage of the population with diabetes mellitus (DM), the greater the percentage of the population with hypertension. All confounding variables had a combined influence of 21.9% ().
Table 3. The effect of confounding variables on hypertension, results from multiple linear regression analysis.
Discussion
This study used path analysis to determine the direct and indirect relationships of the independent variable depression, the intermediate variable of central obesity, and the dependent variable of hypertension. Unlike single equation regression analysis, which can only assess the independent-dependent variables' direct effect, this method can correct errors caused by using the dependent variable (obesity) as the independent (intermediate) variable for the other dependent variable (hypertension), when the independent (intermediate) variable (obesity) is also influenced by other independent variables (depression). Using a dependent variable as a predictor in a single equation regression analysis would produce coefficients (regression estimates) that are not only biased but also inconsistent. Therefore, this study has the potential to help researchers better understand the relationships between depression, obesity, and hypertension [Citation23].
This study showed a significant positive indirect relationship between depression and hypertension through central obesity (path coefficient: 0.212; p = 0.041). Depression had an insignificant direct relationship to hypertension but a significant direct relationship with central obesity (path coefficient 0.116; p = 0.459 and path coefficient 0.413; p = 0.009). These findings suggest that depressive prevalence is associated with hypertension mainly through the high prevalence of obesity. Overall, the total effect of depression and central obesity on hypertension was 32.7%.
An earlier study, the Bogalusa Heart Study in 2006, found identical results regarding the relationships of the similar three variables. According to their primary data, an increase in depressive symptom scores was related to a 14% (OR = 1.14; p = 0.02) increase in the chance of hypertension in whites and African Americans due to high BMI levels. Furthermore, the direct influence of depressive symptoms was found to have an insignificant positive relationship with hypertension in the white race (OR = 1.05; p = 0.22) and a significant negative relationship with hypertension in the African American race (OR 0.81; p = 0.004) [Citation12]. Another pathway analysis study also showed similar results that depression and anxiety have an indirect relationship to hypertension through pulse rate variability which was influenced by autonomic nervous system abnormalities [Citation13]. However, the prospective multicentre CARDIA study in 2000 showed that depressive symptoms increased the risk of hypertension even after adjusting for other hypertension risk factors in the logistic regression analysis model (OR = 1.78; 95% CI 1.06–2.98). This relationship was significant among black people, but not in white people [Citation10]. On the other hand, there are other prospective study (r = 0.003-0.005; p = 0.93) and meta-analysis (OR = 0.89; 95% CI = 0.62–1.28) which concluded that depression and hypertension had no direct relationship [Citation24,Citation25]. The disparity in these studies' findings could be attributed to the dominant indirect effect of depression. It is possible that the presence of a dominant indirect effect of depression may be significant in one race but not in another, which can be confirmed by using path analysis research methodologies. Another factor that could have contributed to the disparity in study results was the length of patient follow-up. Meng et al. explain the time-dependent relationship between depression and hypertension. There was a small influence of depression to the risk of hypertension in the cohort with a short follow-up duration, but there was a positive association between hypertension and depression in the cohort with a sufficiently long follow-up duration (at least 3 years) [Citation26]. Furthermore, confounding factors such as baseline systolic blood pressure, baseline BMI, baseline depression prevalence, age, gender, race and ethnicity, and comorbidities can influence the variability of the relationship between depression and hypertension [Citation26,Citation27].
The relationship between depression, central obesity, and hypertension is complex. Depression is known to be associated with obesity through unhealthy life style, dysregulation of the hypothalamic-pituitary-adrenal (HPA) axis, dysregulation of neuroendocrine energy and metabolism mediators such as leptin, microbiome alteration, and low grade inflammation state [Citation28]. Obesity may also be linked to hypertension through the HPA axis dysregulation, mechanical kidney compression by increased retroperitoneal and visceral fat, low grade inflammation through the secretion of cytokines and adipokines and increased sympathetic nervous system and renin-angiotensin-aldosterone system (RAAS) activation [Citation8,Citation29,Citation30]. Obesity is also linked to obstructive sleep apnoea which is also a known cause of secondary hypertension [Citation31]. Studies that mention relationship between depression and hypertension also noted unhealthy life-style, HPA axis dysregulation, autonomic nervous system dysregulation, and low grade inflammation as possible the possible mechanism of the association [Citation26]. The overlapping and shared mechanism of these three health entities might imply indirect association between depression and hypertension through central obesity.
We performed multiple linear regression analysis for DM, CKD, and cigarette smoking to determine the magnitude of confounding variables' influence on hypertension. DM had a significant positive effect on hypertension (coefficient= 0.440; p = 0.013), while chronic kidney failure and cigarette smoking had an insignificant positive effect (coefficient= 0.069; p = 0.687 and coefficient= 0.061; p = 0.713). Confounding variables had a smaller influence than independent and intermediate variables hence independent and mediating variables were more associated with hypertension than confounding variables (32.7% vs. 21.9%). This study could not explain the insignificant relationship of CKD and smoking history to hypertension. The insignificant relationship could be attributed to the study's limitation of using secondary data as a research data source. Research using primary data is needed to confirm this study.
Limitation
The limitation of this study was the use of aggregated data taken from the 2018 Indonesian Baseline Health Research. Because it may be impractical to survey the whole population of interest, cross-sectional investigations sometimes use secondary analysis of data obtained for another purpose. In this case, the researchers have no access to individual records and must rely on group-level data. However, the accuracy of this secondary data can be trusted. The Indonesian Health Research Association (APKESI) is an external validator institution that validates this research data to monitor the reliability of participant recruitment, allocation, measurement, or data collection. The normality test of the data using the multivariate normality test was 2.438 (CR < 2.58), meaning that the distribution of all data variables was normal. Moreover, our path analysis test results were in line with the results of the previous path analysis test, which used primary data with similar variables [Citation12, Citation13]. Due to the population-based design in this study, the causal relationship between depression, central obesity, and hypertension cannot be determined conclusively; therefore, a longitudinal study employing primary data is still necessary.
Conclusion
Our study showed that, the prevalence of depression is directly related to the prevalence of central obesity and the prevalence of central obesity is directly related to hypertension. Depression was associated with hypertension mainly through its association with central obesity. It should be noted, however, that exact causality between depression, central obesity, and hypertension cannot be confirmed by this study. It is critical to consider depression during the prevention and treatment of hypertension.
Disclosure statement
No potential conflict of interest was reported by the author(s).
References
- Arima H, Barzi F, Chalmers J. Mortality patterns in hypertension. J Hypertens. 2011;29(Suppl 1):S3–S7.
- KEMENKES RI. Riset kesehatan dasar (RISKESDAS) 2013. Badan Penelitian Dan Pengembangan Kesehatan Kementrian Kesehatan RI. 2013;1:1–384.
- KEMENKES RI. Riset Kesehatan Dasar (RISKESDAS) 2018. [Internet]. Badan Penelitian dan Pengembangan Kesehatan Kementrian Kesehatan RI. 2018 [cited 2022 Feb 7]. Available from: https://www.litbang.kemkes.go.id/laporan-riset-kesehatan-dasar-riskesdas/.
- Beaney T, Burrell LM, Castillo RR, the MMM Investigators, et al. Measurement month 2018: a pragmatic global screening campaign to raise awareness of blood pressure by the international society of hypertension. Eur Heart J. 2019;40(25):2006–2017.
- Turana Y, Widyantoro B, Situmorang TD, et al. May measurement month 2018: an analysis of blood pressure screening results from Indonesia. Eur Heart J Suppl. 2020;22(Suppl H):H66–9.
- Piepoli MF, Hoes AW, Agewall S, ESC Scientific Document Group, et al. 2016 European guidelines on cardiovascular disease prevention in clinical practice: the sixth joint task force of the european society of cardiology and other societies on cardiovascular disease prevention in clinical practice (constituted by representat. Eur Heart J. 2016; 37(29):2315–2381.
- Akesson A, Larsson SC, Discacciati A, et al. Low-risk diet and lifestyle habits in the primary prevention of myocardial infarction in men: a population-based prospective cohort study. J Am Coll Cardiol. 2014;64(13):1299–1306.
- Zhao Y, Zhang M, Luo X, et al. Association of 6-year waist circumference gain and incident hypertension. Heart. 2017;103(17):1347–1352.
- Luppino FS, de Wit LM, Bouvy PF, et al. Overweight, obesity, and depression: a systematic review and Meta-analysis of longitudinal studies. Arch Gen Psychiatry. 2010;67(3):220–229.
- Davidson K, Jonas BS, Dixon KE, et al. Do depression symptoms predict early hypertension incidence in young adults in the CARDIA study? Coronary artery risk development in young adults. Arch Intern Med. 2000;160(10):1495–1500.
- Jonas BS, Franks P, Ingram DD. Are symptoms of anxiety and depression risk factors for hypertension? Longitudinal evidence from the national health and nutrition examination survey I epidemiologic follow-up study. Arch Fam Med. 1997;6(1):43–49.
- Kabir AA, Whelton PK, Khan MM, et al. Association of symptoms of depression and obesity with hypertension: the bogalusa heart study. Am J Hypertens. 2006;19(6):639–645.
- Chen TY, Kao CW. Effect of psychosocial factors and heart ate variability on blood pressure control in patient with primary hypertension: a path analysis. Eur Heart J. 2020;41(Supplement_2):3410.
- Pettersson A, Modin S, Wahlström R, et al. The Mini-International neuropsychiatric interview is useful and well accepted as part of the clinical assessment for depression and anxiety in primary care: a mixed-methods study. BMC Fam Pract. 2018;19(1):19.
- Idaiani S. Validity and reliability of depression, anxiety and psychosis questionnaire of mini international neuropsychiatric interview (MINI) in Indonesia. ASEAN J Psychiatry. 2020;20(1). Available from: https://www.aseanjournalofpsychiatry.org/archive/ajopy-volume-21-issue-1-year-2020.html
- WHO. Waist Circumference and Waist-Hip Ratio Report of a WHO Expert Consultation [Internet]. 2008. p. 8–11. Available from: https://www.who.int/publications/i/item/9789241501491.
- Janssen I, Katzmarzyk PT, Ross R. Waist circumference and not body mass index explains obesity-related health risk. Am J Clin Nutr. 2004;79(3):379–384.
- Unger T, Borghi C, Charchar F, et al. 2020 International society of hypertension global hypertension practice guidelines. Hypertension. 2020;75(6):1334–1357.
- Association AD. 2. Classification and diagnosis of diabetes: Standards of medical care in diabetes—2021. Diabetes Care. 2020; 44(Supplement_1):S15–S33.
- Stevens PE, Levin A, Kidney Disease: Improving Global Outcomes Chronic Kidney Disease Guideline Development Work Group Members Evaluation and management of chronic kidney disease: Synopsis of the kidney disease: Improving global outcomes 2012 clinical practice guideline. Ann Intern Med. 2013;158(11):825–830.
- Sobel ME. Asymptotic confidence intervals for indirect effects in structural equation models. Sociol Methodol. 1982;13:290–312.
- Sobel ME. Some new results on indirect effects and their standard errors in covariance structure models. Sociol Methodol. 1986;16:159–186.
- Ahn J. Beyond single equation regression analysis: Path analysis and MultiStage regression analysis. Am J Pharm Educ. 2002;66:37–42.
- Goldberg EL, Comstock GW, Graves CG. Psychosocial factors and blood pressure. Psychol Med. 1980; 10(2):243–255.
- Vancampfort D, Correll CU, Wampers M, et al. Metabolic syndrome and metabolic abnormalities in patients with major depressive disorder: a meta-analysis of prevalences and moderating variables. Psychol Med. 2014;44(10):2017–2028.
- Meng L, Chen D, Yang Y, et al. Depression increases the risk of hypertension incidence: a Meta-analysis of prospective cohort studies. J Hypertens. 2012;30(5):842–851.
- Shinn EH, Poston WSC, Kimball KT, et al. Blood pressure and symptoms of depression and anxiety: a prospective study. *Am J Hypertens. 2001;14(7 Pt 1):660–664.
- Milaneschi Y, Simmons WK, van Rossum EFC, et al. Depression and obesity: evidence of shared biological mechanisms. Mol Psychiatry. 2019;24(1):18–33.
- Gadde KM, Martin CK, Berthoud H-R, et al. Obesity: Pathophysiology and management. J Am Coll Cardiol. 2018;71(1):69–84.
- Wilson PWF, D'Agostino RB, Sullivan L, et al. Overweight and obesity as determinants of cardiovascular risk: the framingham experience. Arch Intern Med. 2002;162(16):1867–1872.
- Dopp JM, Reichmuth KJ, Morgan BJ. Obstructive sleep apnea and hypertension: Mechanisms, evaluation, and management. Curr Hypertens Rep. 2007;9(6):529–534.