
Abstract
Purpose
We investigated whether blood pressure (BP) control measures, visit-to-visit BP variability, and time in therapeutic range (TTR) are associated with future cardiovascular outcomes in hypertensive patients.
Materials and Methods
Among 1,408 hypertensive patients without cardiovascular disease, we prospectively evaluated the incident major cardiovascular events over 6 years. In newly diagnosed patients, antihypertensive drug treatment was initiated. We estimated two markers of on-treatment BP control, (1) visit-to-visit BPV as the coefficient of variation of office systolic BP (BP-CV), and (2) TTR calculated as the percentage of office systolic BP measurements within 120–140mmHg across visits.
Results
The hypertensive cohort (672 males, mean age 60 years, 31% newly diagnosed) had a mean systolic/diastolic BP of 142/87 mmHg. The mean number of visits was 4.9 ± 2.6, while the mean attained systolic/diastolic BP during follow-up was 137/79 mmHg using 2.7 ± 1.1 antihypertensive drugs. The BP-CV and TTR were 9.1 ± 4.1% and 45 ± 29%, respectively, and the incidence of the composite outcome was 8.3% (n = 117). After adjustment for relevant confounders and standardization to z-scores, BP-CV and TTR were associated with a 43% (95% CI, 27–62%) increase and a 33% (95% CI, 15–47%) reduction in the outcome. However, the joint evaluation of TTR and BP-CV in a common multivariable model indicated that a standardized change of TTR was associated with the outcome to a greater extent than BP-CV (mean hazard ratios of 30% vs. 24%, respectively). When combined with the higher BP standardized-CV quartile, the lower TTR quartile predicted the outcome by 2.3 times (95% CI, 1.1–5.4) compared to the inverse TTR and BP-CV quartile pattern.
Conclusion
High BP-CV or low TTR was associated with future cardiovascular events in a cohort of treated hypertensive patients. As a determinant, the extent of TTR value appears greater than BP-CV when these measures are considered in the same multivariable model.
Introduction
Although different randomised trials and meta-analyses have constantly demonstrated the beneficial outcome effects of blood pressure (BP)-lowering [Citation1,Citation2], one of the major challenges of hypertension management remains the achievement and maintenance of BP within the target over time [Citation3]. Hence, selecting the most accurate methodology with enough future event prognostic value might be important to monitor BP control.
As a continuous biological measure, BP is rather unstable due to significant fluctuations, over time, because of the interaction between environmental factors, metabolic demands, and other hemodynamic changes [Citation4,Citation5]. These changes can be described either as short-term (i.e. over 24 h) or long-term (visit-to-visit) BP variability (BPV). Although long-term BPV seems better related to end-organ damage than short-term BPV, the association of visit-to-visit BPV with cardiovascular prognosis in different populations is controversial [Citation5,Citation6]. Moreover, assessing BPV in the usual clinical practice as the coefficient of variation of office BP across visits may be difficult because mathematical equations have to be applied. On the other hand, BP time in therapeutic range (TTR), expressed as a percentage of BP measurements within a certain window of BP levels (i.e. systolic BP 120–140 mmHg) recorded over a fixed period, might be considered an alternative or complementary measure to BPV for the clinical assessment of BP control. At variance with BPV, TTR, also related to future cardiovascular events [Citation7], is easier to implement in the usual clinical practice because the physicians are asked to register how many times the recorded BP is within the individual-patient BP target during follow-up. At present, whether BPV or TTR demonstrate the same extent of association with future cardiovascular outcomes within the same cohort of patients remains unsettled.
We separately evaluated the prognostic role of BPV and TTR on future cardiovascular events in a prospective cohort of treated hypertensive patients. We also examined the potential additive or synergistic outcome effect of both measures. Our study hypothesis was that combining these two measures may better define future cardiovascular risk.
Materials and methods
Study population and study design
We screened 1,748 consecutive patients, either referred or self-referred to our outpatient Hypertension Unit for BP evaluation and management, from October 2009 until October 2014. In addition, patients were prospectively followed in the context of a larger ongoing single-centre, clinic-based, observational cohort study [Citation8]. The patients eligible to participate were men and non-pregnant women at least 18 years old with a new diagnosis of hypertension or under antihypertensive treatment.
We excluded patients with (1) a history of cardiovascular or end-stage renal disease (n = 82), (2) other significant systemic or terminal illness (n = 20), and (3) secondary hypertension (n = 55). Moreover, among the excluded patients were those with less than three visits during the first 24 months (including the baseline visit), those treated exclusively with lifestyle measures, and those unable to attend the predetermined follow-up visits or lost to follow-up (n = 97). Finally, 86 patients refused to sign a consent for participation. After implementing the above, the population eligible to participate consisted of 1,408 individuals under antihypertensive treatment. The local ethics committee approved the study protocol, complied with the Declaration of Helsinki, and all participants provided written informed consent.
Baseline visit
Medical history was recorded, including demographic data, cardiovascular risk factors, clinic BP measurements, and routine biochemical tests. Diagnosis of diabetes mellitus was based on fasting serum glucose concentration of at least 126 mg/dL in at least two instances or a positive oral glucose tolerance test or treatment with antidiabetic drugs. Dyslipidaemia was defined as low-density lipoprotein cholesterol >160 mg/dL or treatment with lipid-lowering drugs. In addition, the type and number of antihypertensive medications and the duration of hypertension were recorded. The standard protocol included a 12-lead electrocardiogram and routine blood and urine testing.
Follow-up
The follow-up period was set until January 2022. During this time, participants had at least three visits to the Hypertension Unit, with a minimum of one visit per year. After an invitation to attend their scheduled visits, all patients underwent BP evaluation, antihypertensive, and lifestyle treatment optimisation during these visits, while additional cardiovascular risk factors were also treated.
BP measurements
Clinic BP was measured at baseline in three weekly visits and follow-up visits. First, participants were asked to rest for at least five minutes in a quiet room with a comfortable temperature. Then, participants were placed in a sitting position. Next, a physician performed three BP measurements at one-minute intervals using validated upper-arm cuff electronic devices Omron 705IT (Omron Healthcare Europe, Hoofddorp, the Netherlands) with suitable cuff size. Talking was not allowed during and between the measurements. In addition, the average BP and heart rate of the last two recordings were recorded.
Biochemical testing
Following established methods, a venous blood sampling was taken in each participant after overnight fasting to determine plasma glucose, serum creatinine, and lipid profile. Furthermore, the estimated glomerular filtration rate (eGFR) was calculated with the Modification of Diet in Renal Disease equation [Citation9].
Outcomes
Hospital records or any additional formal medical documents provided by the patients during the follow-up period were reviewed and included in the final evaluation. The outcome of interest was the composite of major fatal or non-fatal cardiovascular events. At the cardiac level, the outcome was composed of new-onset coronary artery disease defined as myocardial infarction or coronary revascularization procedure (i.e. coronary artery bypass or percutaneous coronary intervention) or >50% coronary artery stenosis revealed by angiography. In addition, stroke was defined as the onset of a new neurological deficit persisting for at least 24 h and then confirmed by computed tomography or other imaging techniques. The outcome did not include ambiguous diagnoses such as unproved myocardial infarction, angina pectoris, and transient cerebral ischaemia. Finally, only the first event was considered in the analysis regarding patients who experienced more than one non-fatal outcome event.
Determinants and statistical analysis
We estimated two measures of BP control. First, BPV as the coefficient of variation of office systolic BP across visits [(BP-CV) = (systolic BP standard deviation/mean systolic BP) x 100%] weighted for the time interval between all available visits (e.g. baseline and first visit, first visit and second visit and so on divided for the follow-up period until the end of the study or outcome occurrence. Second, TTR was calculated as the percentage of systolic BP measurements within 120–140mmHg during follow-up [(number of visits in therapeutic range/total number of visits) x 100%] weighted by the between-visit time interval and computed with the same methodology of BP-CV (see above).
We imputed the z-scores of these variables to compare the predictive value of the standardised measures separately evaluated or placed together in a common model with their interaction term BPV*TTR z-score. Next, we computed the average follow-up systolic BP weighted for the between-visit time interval and then standardised it to z-scores to test the association between achieved systolic BP with the outcome. Finally, TTR and BP-CV were categorised into quartiles to assess whether more increased BP control by either or both measures was associated with differential outcome prediction.
All categorical variables are presented as absolute frequencies and percentages, whereas continuous variables are shown as mean value ± standard deviation. Where appropriate, significant differences between study subgroups were identified using Student’s independent-samples t-test or the chi-squared test. Cox regression proportional hazard analysis examined the association between BP control measures and the cumulative incidence of cardiovascular events in terms of hazard ratios (HRs) and 95% confidence intervals (CIs). After considering collinearity issues based on the variance inflation factor, unadjusted and adjusted risk estimates for relevant confounders were calculated. A p-value <0.05 indicated statistical significance for all binary comparisons in each analysis, while a Bonferroni correction reset statistical significance to <0.016 for comparisons among three groups. IBM SPSS Statistics, Version 23.0. (Armonk, NY: IBM Corp.) was used for all analyses.
Results
The study sample consisted of 1,408 hypertensive patients (mean age 60 years; 672 males; office systolic/diastolic BP, 142/87 mmHg) followed for 6 ± 3.3 years. Baseline characteristics of the entire cohort are presented in Supplementary Table S1. The incidence of the composite outcome in the total population was 8.3% (n = 117). Coronary heart disease events were 65% (n = 76; 36 myocardial infarctions, 31 percutaneous coronary interventions, and 9 cases of coronary artery bypass), while strokes were 35% (n = 41). More increased age, male sex, lower diastolic BP, and diabetes mellitus were more frequently observed in patients with than without cardiovascular events. The duration of hypertension and baseline antihypertensive treatment characteristics were not different between groups (Supplementary Table S1). During follow-up, the achieved systolic BP was relatively lower by 3 mmHg in those without cardiovascular events despite the greater number of follow-up antihypertensive agents used in patients with outcomes (Supplementary Table S2). In addition, BP control employing TTR or BP-CV was better in patients without than those with incident cardiovascular disease.
The stratification of the total population in quartiles of TTR and BP-CV is presented in , along with the comparison of the baseline and follow-up clinical characteristics between groups. For example, patients with TTR >67% compared to those with TTR ≤25% were younger, had a lower baseline, attained systolic and diastolic BP, had lower diabetes mellitus prevalence, had a shorter duration from the initial hypertension diagnosis, and a lower number of baseline and follow-up antihypertensive treatment. Although there were differences between groups in some antihypertensive drug classes, no difference in the proportion of RAS blockers was noticed across TTR groups at baseline and during follow-up.
Table 1. Baseline and follow-up clinical and BP data according to TTR and systolic BP coefficient of variation groups.
As presented in , in multivariate Cox regression models, (1) one unit (i.e. 1%) of TTR increase was associated with 2% (95% CI, 1–4%) lower outcome incidence, (2) one unit of BP-CV increase was associated with 8% (95% CI, 5–10%) higher outcome incidence, (3) a standardised change of TTR or BP-CV were associated with differential outcome incidence (33% [95% CI, 15–47%] or 43% [95% CI, 27–62%], respectively), and (4) the standardised interaction term of both BP control measures demonstrated a trend of outcome prediction (p = 0.053), though with no additive or synergistic predictive value compared to each of the measures. Of note that when TTR and BP-CV are considered in the same multivariable model, the association of TTR with the outcome for a standardised change was higher by 6%, favouring TTR (). Complete multivariable models used are presented in Data Supplement, Table S3. In , we also provide the association of the average achieved systolic BP with the outcome before and after adjustment for the same confounders used in the previous models of BP variability measures. One mmHg systolic BP increase was associated with a 3% higher outcome incidence, while a standardised increase of systolic BP was associated with a 32% (95% CI, 9–59%) outcome increase.
Table 2. Cox regression models for major cardiovascular events setting as predictor variables time to therapeutic range or blood pressure coefficient of variation before and after adjustment for confounders.
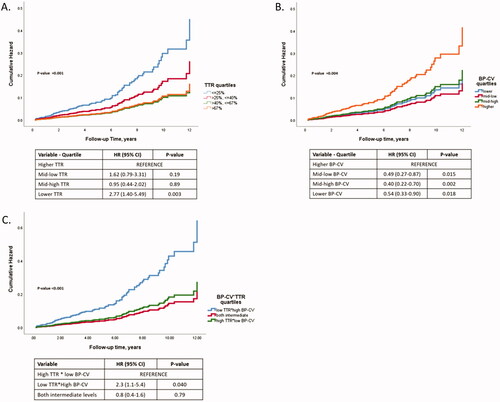
Different TTR quantiles after adjustment for confounders were associated with a differential outcome prediction, with the lower quartile being associated with 2.77 times increased outcome risk compared to the higher quartile (). Along the same lines, the lower BP-CV quartile was associated with 1.84 times decreased outcome risk compared to the higher quartile (). Finally, as depicted in , the optimal BP control (i.e. higher TTR combined with lower BP-CV quartile) was associated with 2.3 times decreased outcome risk than poor BP control (i.e. lower TTR combined with higher BP-CV quartile).
Figure 1. Prediction of the composite outcomes in Cox regression models of BP control measures stratified quartiles after adjustment for confounders. (A), quartiles of TTR; (B), quartiles of BP-CV; (C), combined quartiles of both measures.
Discussion
In a longitudinal analysis of a prospective cohort of patients with hypertension without a history of cardiovascular disease, we found that TTR and BP-CV were associated with future cardiovascular events during a follow-up period of almost six years. Furthermore, when BP control measures were considered concomitantly, BP-CV compared to TTR was associated with a 6% lower outcome prediction for a standardised change of both BP control measures.
A potential association of BPV and TTR with an increased risk of cardiovascular outcomes has been reported in post-hoc analyses of large randomised trials [Citation10–12]. In the International Verapamil SR-Trandolapril Study (INVEST), which included patients at high cardiovascular risk [Citation12], 22,576 subjects with hypertension and coronary artery disease were divided into 4 groups according to the proportion of visits with a controlled BP. A steep reduction in cardiovascular risk was observed with the increasing number of visits with optimal BP control, independent of baseline characteristics and attained BP levels [Citation12]. More recently, in the Systolic Blood Pressure Intervention Trial (SPRINT), a greater time with a systolic BP within a target range predicted a decreased risk of major cardiovascular events after adjustment for systolic BP levels and BPV [Citation13]. This finding suggests that time in the BP target range may represent an integrated measure of systolic BP levels and BPV. Although the achievement of BP targets in clinical trials is associated with less pronounced long-term BPV and TTR changes over time because patients are closely monitored, in a real-life setting, hypertensive patients may have a more increased BPV and a variable BP control rate because (1) medical visits are not always physician-scheduled, (2) adherence remains by and large, unknown, (3) side effects are remotely reported, and discontinuations are more frequent than in trials and (4) treatment optimisation may be limited by a variable degree of physician inertia. Our results refer to a more extended follow-up period than SPRINT. However, our study population had a lower baseline cardiovascular risk because we included only primary prevention patients.
Moreover, in the case of SPRINT, the unattended environment of BP measurement generates lower BP values than the conventional attended office BP measurements due to the absence of the alerting reaction and sympathetic activation normally triggered by the presence of medical personnel [Citation14]. Thus, BP control was more likely achieved in the SPRINT than in the real-life clinical setting of our investigation. However, our study produced similar results to the SPRINT. Further, it extended the previous findings to the notion that BP-CV predicts future cardiovascular events independently of baseline BP levels and TTR.
Physicians who manage hypertension should first emphasise BP-lowering within the target and maintain BP control over a long period to reduce cardiovascular risk [Citation3,Citation15]. By comparing two different measures of BP control, our study suggests that BP-CV is associated with marginally lower outcome prediction than TTR. However, in the usual clinical practice, clinicians can rely upon either measure separately in each patient because (1) both are associated with the prediction of cardiovascular events and (2) considering both measures together, no incremental predictive value was obtained. In addition, BP control evaluation using absolute BP values in the office or in-home may be more feasible than assessing long-term BPV using a mathematical equation. The clinical importance of the consistency of BP control over time expressed as the percentage of BP control measurements has also been proven in a large Veteran cohort of 689,051 individuals [Citation6]. Veterans were followed for 10 years, and an inverse stepwise association between TTR and all-cause mortality has been observed [Citation6]. According to this study, TTR describes the entire BP control longitudinally and may refine the prediction of future cardiovascular risk than single follow-up BP values or BPV measures retrieved at any specific time. However, it cannot be excluded that patients with a greater TTR were more adherent to treatment than their lower TTR counterparts.
A limitation of our study was the absence of information about adherence to the implemented antihypertensive treatment. Another drawback is that TTR and BP-CV evaluations were based on office BP measurements. Indeed, there is a possibility that home or ambulatory BP recordings may have refined our results; however, in usual practice, the achievement of BP targets is by and large based on office BP levels. In addition, our study has a long-term longitudinal design. Therefore, the effect of unknown or unmeasured confounding cannot be ruled out definitively. Finally, patients with a higher propensity to develop a cardiovascular event, such as those with hypertension-mediated organ damage, were not excluded at baseline.
In conclusion, TTR and BP-CV have been independently associated with cardiovascular outcomes in a cohort of treated hypertensive patients.
Supplemental Material
Download Zip (64.7 KB)Disclosure statement
No potential conflict of interest was reported by the author(s).
References
- Ettehad D, Emdin CA, Kiran A, et al. Blood pressure lowering for prevention of cardiovascular disease and death: a systematic review and meta-analysis. Lancet. 2016;387(10022):957–967.
- Thomopoulos C, Parati G, Zanchetti A. Effects of blood pressure lowering on outcome incidence in hypertension: 7. Effects of more vs. less intensive blood pressure lowering and different achieved blood pressure levels – updated overview and meta-analyses of randomized trials. J Hypertens. 2016;34(4):613–622.
- Benetos A, Thomas F, Bean KE, et al. Why cardiovascular mortality is higher in treated hypertensives versus subjects of the same age, in the general population. J Hypertens. 2003;21(9):1635–1640.
- Parati G, Ochoa JE, Lombardi C, et al. Blood pressure variability: assessment, predictive value, and potential as a therapeutic target. Curr Hypertens Rep. 2015;17(4):537.
- Rosei EA, Chiarini G, Rizzoni D. How important is blood pressure variability? Eur Heart J Suppl. 2020;22(Supplement_E):E1–E6.
- Tsioufis C. Blood pressure variability and cardiovascular prognosis. Many expectations but limited data. Hellenic J Cardiol. 2017;58(6):465–467.
- Doumas M, Tsioufis C, Fletcher R, et al. Time in therapeutic range, as a determinant of all-cause mortality in patients with hypertension. J Am Heart Assoc. 2017;6:e007131.
- Andrikou I, Dimitriadis K, Konstantinidis D, et al. Left ventricular mass versus pulse wave velocity as predictors of coronary artery disease in hypertensive patients: data from a 6-year-follow-up study. J Hum Hypertens. 2022;36(7):617–621.
- Clase CM, Kiberd BA, Garg AX. Relationship between glomerular filtration rate and the prevalence of metabolic abnormalities: results from the third national health and nutrition examination survey (NHANES III). Nephron Clin Pract. 2007;105(4):c178–c184.
- Mehlum MH, Liestøl K, Kjeldsen SE, et al. Blood pressure variability and risk of cardiovascular events and death in patients with hypertension and different baseline risks. Eur Heart J. 2018;39(24):2243–2251.
- Chang TI, Reboussin DM, Chertow GM, et al. SPRINT research group. visit-to-visit office blood pressure variability and cardiovascular outcomes in SPRINT (systolic blood pressure intervention trial). Hypertension. 2017;70(4):751–758.
- Mancia G, Messerli F, Bakris G, et al. Blood pressure control and improved cardiovascular outcomes in the international verapamil SR-Trandolapril study. Hypertension. 2007;50(2):299–305.
- Fatani N, Dixon DL, Van Tassell BW, et al. Systolic blood pressure time in target range and cardiovascular outcomes in patients with hypertension. J Am Coll Cardiol. 2021;77(10):1290–1299.
- Grassi G, Quarti-Trevano F, Seravalle G, et al. Sympathetic neural mechanisms underlying attended and unattended blood pressure measurement. Hypertension. 2021;78(4):1126–1133.
- Bakris G, Sternlicht H. Time in therapeutic range: redefining “optimal” blood pressure control. J Am Coll Cardiol. 2021;77(10):1300–1301.