
Abstract
Purpose: Subclinical chronic kidney disease is known to exacerbate hypertension and progression of kidney damage. In order to initiate timely interventions, early biomarkers for this vicious circle are needed. Our aim was to describe the cross-sectional associations of urinary orosomucoid and urinary N-acetyl-β-D-glucosaminidase (NAG) with blood pressure and the longitudinal associations of urinary orosomucoid and NAG to hypertension after 7 years, and to compare the strength of these associations to the urinary albumin excretion (UAE).
Material and methods: The Tromsø Study is a population-based, prospective study of inhabitants of the municipality of Tromsø, Northern Norway. Morning spot urine samples were collected on three consecutive days in the Tromsø 6 survey (2007–2008). We assessed the cross-sectional associations of urinary orosomucoid, NAG and UAE with blood pressure in Tromsø 6. In a cohort of participants attending Tromsø 6 and Tromsø 7 (2015–2016), we studied whether urinary biomarkers were longitudinally associated with hypertension.
Results: A total of 7197 participants with a mean age of 63.5 years (SD 9.2), and a mean blood pressure of 141/78 mmHg (SD 23.0/10.6), were included in the study. Orosomucoid and UAE, but not NAG, was significantly associated with systolic and diastolic blood pressure in all the crude and multivariable cross-sectional analyses. Orosomucoid had consistently, although marginally, stronger associations with blood pressure. Incident hypertension at follow-up (Tromsø 7) was consistently significantly associated with urinary orosomucoid, but not urinary NAG or UAE. However, the standardized regression coefficients for orosomucoid were only marginally stronger than the standardized regression coefficients for ACR.
Conclusion: In a cohort from the general population urine orosomucoid had a stronger cross-sectional association with blood pressure than UAE. After 7 years, urine orosomucoid showed the strongest association with incident hypertension. There were varying and weak associations between U-NAG, blood pressure and hypertension.
PLAIN LANGUAGE SUMMARY
What is the context? There is a relationship between high blood pressure and cardiovascular and kidney disease. Hypertension is defined as the level of blood pressure at which the benefits of treatment outweigh the risks of treatment. Hypertension is a risk factor for developing kidney disease, and kidney disease is a risk factor for developing hypertension. Today, kidney function is assessed by blood and urine samples (estimated glomerular filtration rate and urinary albumin excretion). However, today's blood and urine samples are not sensitive enough to capture kidney damage due to hypertension at a stage when prevention may be most effective.
What is new? In this study, we assessed if urine orosomucoid and N-acetyl-β-D-glucosaminidase (NAG) are more strongly associated with blood pressure and hypertension than urinary albumin excretion. In the population-based study of residents in Tromsø, Northern Norway, we assessed the relationship between the urine biomarkers and blood pressure, and the development of hypertension after 7 years. In the general population urine orosomucoid had a stronger relationship with blood pressure than urinary albumin excretion. After 7 years, urine orosomucoid had the strongest relationship with the development of hypertension. There were only varying and weak relationships between NAG, blood pressure and hypertension.
What is the impact? Orosomucoid showed a stronger relationship with blood pressure and the development of hypertension than urinary albumin excretion. Urine orosomucoid may aid targeted prevention and treatment in hypertension, but further prospective clinical studies are needed to assess if orosomucoid is a clinically useful biomarker in hypertension.
Introduction
According to the World Health Organization, hypertension is the most significant single contributor to overall morbidity and mortality [Citation1]. An estimated 1.4 billion people worldwide have high blood pressure [Citation2]. Subclinical kidney disease is associated with developing hypertension in the general population [Citation3,Citation4]. Therefore, the development of subclinical kidney damage can initiate a vicious circle with exacerbated hypertension and further progression of kidney damage. The underlying mechanism leading to kidney damage in hypertension is not settled, but endothelial dysfunction, afferent arteriolopathy, damage to the glomerular filtration barrier and tubular ischemia/dysfunction may be important and early steps [Citation4].
Many observational studies have shown that a reduced GFR and albuminuria are independently and multiplicatively associated with an increased risk of cardiovascular events [Citation5]. However, since a significant reduction in kidney function is needed to detect a decrease in estimated GFR (eGFR) [Citation6], it is considered an insensitive marker of kidney damage. Futhermore, only a minority of patients with hypertension have elevated UAE to a level detected by most assays [Citation7–10]. Overall, both eGFR and UAE are insensitive biomarkers of early renal damage in hypertension, at a stage when prevention may be most effective [Citation4,Citation11,Citation12]. Further, lowering of UAE per se in hypertensive patients has not been shown to reduce cardiovascular disease (CVD) risk [Citation13], making UAE a deficient surrogate therapeutic target in hypertension [Citation14]. Finding a panel of biomarkers related to hypertension and hypertension-mediated organ damage at an early stage, that varies with modifiable risk factors, may aid targeted prevention and treatment [Citation12,Citation15].
Similar to UAE, urinary orosomucoid (α-1-acid glycoprotein) is considered a marker of general endothelial dysfunction and a damaged glomerular filtration barrier [Citation16–18]. Orosomucoid is a constituent of the endothelial surface layer and maintains permselectivity [Citation18,Citation19]. Damage to this layer is considered a cause for atherosclerosis [Citation20]. As tubular dysfunction and damage may increase UAE [Citation21], urinary orosomucoid may be a more specific marker of endothelial dysfunction and glomerular damage in hypertension [Citation18,Citation19,Citation22,Citation23].
N-acetyl-β-D-glucosaminidase (NAG) is a lysosomal enzyme that, in the kidney, is found predominantly in lysosomes of proximal tubular cells [Citation11]. The NAG present in the urine is secreted from proximal tubular cells by exocytosis [Citation24]. NAG is thus exclusively a marker of tubular cell function [Citation25]. Myocardial infarction, ischemic stroke, and mortality in the general population have been associated with NAG levels [Citation26]. A small study of patients with newly diagnosed hypertension without microalbuminuria found a significantly higher NAG activity in hypertensive subjects compared to healthy controls [Citation27]. Whereas UAE is dependent on alterations in the glomerular filtration barrier and impaired proximal tubular function [Citation21], NAG may be an earlier and more specific marker of proximal tubular dysfunction in hypertension [Citation27,Citation28].
In this study, we aimed to assess if urinary orosomucoid and NAG have stronger associations cross-sectionally to blood pressure and longitudinally to hypertension than UAE.
Study population
The Tromsø Study is a population-based, prospective study of residents of the municipality of Tromsø, Northern Norway. Since 1974, seven surveys (Tromsø 1–7) have been conducted. The participants in Tromsø 6 (2007–2008) were recruited from four invited groups: Those who took part in the special study in the Tromsø 4, a random 10% sample of residents aged 30–39, everyone aged 40–42 or 60–87 and a random 40% sample of residents aged 43–59 years. A total of 12,984 attended (65.7% of the invited population) [Citation29]. Common CVD risk factors were mapped in the first visit.
Further, 7955 of the participants were invited to undergo an extensive examination. The population eligible for the second visit included first visit participants aged 50–62 and 75–84 years, a 20% random sample aged 63–74, and finally all subjects who had also attended the second visit of Tromsø 4 (1994–1995). The attendance rate for this second visit was 91.8% (n = 7306). Morning spot urine samples from 7197 participants on three consecutive days were collected. UAE was available in 7195 participants (3090 men and 4105 women), urinary orosomucoid was available in 7181 participants (3086 men and 4095 women), and urinary NAG measurements were available in 7170 participants (3082 men and 4088 women).
The invited population in Tromsø 7 (2015–2016) consisted of all individuals aged 40 and older. A total of 21,083 attended (64.7% of the invited population) [Citation30].
A total of 5114 attended both the second visit of the Tromsø 6 and the Tromsø 7 surveys (). UAE was available in 5046 participants, urinary orosomucoid was available in 5033 participants and urinary NAG measurements were available in 5025 participants of the Tromsø 7.
Figure 1. Selection of study participants from the Tromsø Study, 6th and 7th wave. Figure 1 depicts a range of change in predicted probabilities. A standardized coefficient of 0.01 represents 1% of the maximum change possible in predicted probability of incident hypertension. NAG: (Log urinary N-acetyl-β-D-glucosaminidase to creatinine ratio per SD unit): standardized beta coefficients at different probability reference value; ACR: (Log urinary albumin to creatinine ratio per SD unit): standardized beta coefficients at different probability reference value; OCR: (Log urinary orosomucoid to creatinine ratio per SD unit): standardized beta coefficients at different probability reference value. Fully Adjusted Model: Adjusted for CVD risk factors and NAG and ACR and OCR. CVD risk factors: Sex, Age, BMI, Current smoker, Diabetes, Prior cardiovascular event (stroke or heart attack).
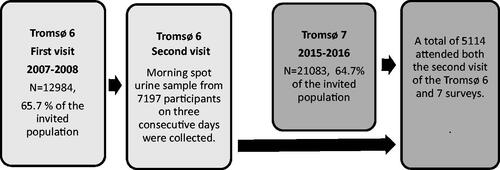
Figure 2. Fully adjusted model without eGFR. Range of change in predicted probabilities in incident hypertension. Figure 2 depicts a range of change in predicted probabilities. A standardized coefficient of 0.01 represents 1% of the maximum change possible in predicted probability of incident hypertension. NAG: (Log urinary N-acetyl-β-D-glucosaminidase to creatinine ratio per SD unit): standardized beta coefficients at different probability reference value; ACR: (Log urinary albumin to creatinine ratio per SD unit): standardized beta coefficients at different probability reference value; OCR: (Log urinary orosomucoid to creatinine ratio per SD unit): standardized beta coefficients at different probability reference value. Fully Adjusted Model: Adjusted for CVD risk factors and NAG and ACR and OCR. CVD risk factors: Sex, Age, BMI, Current smoker, Diabetes, Prior cardiovascular event (stroke or heart attack).
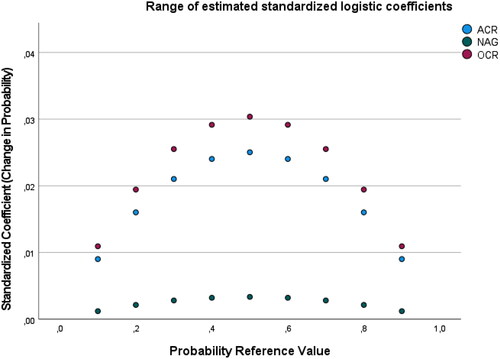
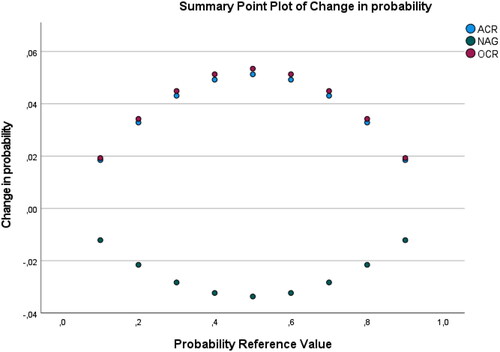
Figure 3. Fully adjusted modell with eGFR. Range of change in predicted probabilities in progressive hypertension. Figure 3 depicts a range of change in predicted probabilities. A standardized coefficient of 0.01 represents 1% of the maximum change possible in predicted probability of progressive hypertension. NAG: (Log urinary N-acetyl-β-D-glucosaminidase to creatinine ratio per SD unit): standardized beta coefficients at different probability reference value; ACR: (Log urinary albumin to creatinine ratio per SD unit): standardized beta coefficients at different probability reference value; OCR: (Log urinary orosomucoid to creatinine ratio per SD unit): standardized beta coefficients at different probability reference value. Fully Adjusted Model: Adjusted for CVD risk factors and NAG and ACR and OCR. CVD risk factors: Sex, Age, BMI, Current smoker, Diabetes, Prior cardiovascular event (stroke or heart attack), eGFR calculated using the creatinine-Cystain C based CKD-EPI equation.
The UiT, The Arctic University of Norway conducted the survey in cooperation with The National Health Screening Service. The Regional Committee for Medical and Health Research Ethics approved the study, and all participants gave their written consent [Citation29,Citation30].
Methods
In both Tromsø 6 and 7, the participants returned a self-administered questionnaire, including information about current medication, diabetes, CVD, and smoking habits. Tobacco use was dichotomized into current smokers or not (all others). Blood samples and time since the last meal were obtained. We defined fasting as time since the previous meal of at least eight hours. We defined the presence of diabetes as self-reported diabetes, self-reported use of glucose-lowering drugs, HbA1c ≥6.5%, non-fasting glucose ≥11 mmol/L, or a fasting blood glucose >7.0 mmol/L. We calculated the body mass index (BMI; kg/m2) from height and weight measured by study personnel.
Blood pressure was recorded in triplet by trained personnel, using an automatic device (the Dinamap Pro care 300 Monitor (GE Healthcare). The cuff was chosen after the circumference of the upper arm was measured. After a 2-min rest, three attended readings on the upper right arm were taken in a sitting position, separated by a 1-min interval. We used the mean of the second and third readings in the analyses [Citation31]. Several antihypertensive agents may affect the levels of urinary biomarkers independently from their blood pressure lowering effect [Citation32], and in the cross-sectional design the cohort was dichotomized into those with and without treated hypertension. We defined treated hypertension as using one or more blood pressure-lowering drugs. In the longitudinal analyses, we defined incident hypertension as being normotensive in Tromsø 6 and having started with one or more blood pressure-lowering drugs or an increase in blood pressure ≥140/90 mmHg at follow-up (Tromsø 7). In the longitudinal analysis, we further defined controlled hypertension at baseline (Tromsø 6) as blood pressure <140/90 mmHg while using one or more blood pressure-lowering drugs. Among those with controlled hypertension at baseline, we defined progressive hypertension as an increase in the number of blood pressure-lowering drugs or blood pressure ≥140/90 mmHg while on the same blood pressure-lowering drugs at follow-up (Tromsø 7).
We used morning urine samples collected on three consecutive days at baseline (Tromsø 6). We measured creatinine, albumin, and NAG in fresh urine samples at the time of collection. Urine creatinine was measured using colorimetric methods (Jaffes reaction) and an autoanalyser (ABX PENTRA, Horiba ABX, Montpellier, France). We measured the urine albumin concentration by an immunoturbidimetric method with the ABX Pentra Micro-albumin CP (Horiba ABX, Montpelier, France). A colorimetric method (with 3-cresolsulfonphthaleinyl-N-acetyl-β-d-glucosaminide; Boehringer Mannheim, Germany) was applied for the NAG measurements. Urine samples were frozen at −20 °C, shipped to the Department of Quality and Research, Regional Hospital of Randers, University of Aarhus, Denmark and analyzed for orosomucoid by a highly sensitive EU-labelled fluorometric immunoassay (DELFIA) [Citation33]. We added Tween 20, stored the urine samples at −20 °C and analyzed thawed samples at 37 °C based on a self-developed application in the AutoDELFIA system [Citation33,Citation34]. For each urine sample, we calculated the ratios of albumin, NAG, and orosomucoid concentrations with the urine creatinine concentration (NAG-creatinine ratio [NAG-Cr], albumin-creatinine ratio [ACR], orosomucoid-creatinine ratio [OCR]), respectively). The median values of these biomarkers assessed on days 1,2 and 3 were used in the analyses.
Serum creatinine was measured with an enzymatic method (Modular P; Roche Diagnostics). Cystatin C was measured with a particle-enhanced turbidimetric immunoassay using reagents from Gentian on a Modular P800 analyzer (Roche Diagnostics). We calculated creatinine-cystatin C based eGFR by applying the Chronic Kidney Disease Epidemiology Collaboration (CKD-EPI) equation [Citation35,Citation36]. Serum glucose, triglycerides, and cholesterol were measured on a Modular P800 (Roche Diagnostics). HbA1c was measured with a liquid chromatographic method (Variant II in-strument, Bio-Rad Laboratories, Hercules, CA).
Statistical analyses
Baseline characteristics were summarized for the entire cohort and subgroups with or without treated hypertension and men and women with a mean (SD) for normally distributed variables, median for skewed variables, and n (percentage) for categorical variables. Student’s t-test, Mann-Whitney tests, Wilcoxon-signed-rank test and chi-square test were used for comparison, as appropriate.
In the cohort of participants with morning spot urine samples from Tromsø 6, second visit, we used univariable and multivariable linear regression analyses to assess the associations between the urinary biomarkers and the dependent variables systolic and diastolic blood pressure in the whole cohort and subgroups with and without treated hypertension. The creatinine adjusted urinary biomarkers were non-normally distributed and were log-transformed. As standardized regression coefficients are context dependent, we did the crude analysis to address which biomarker explains the most variance, ignoring the effect of the other independent variables. We did multivariable and fully adjusted models to address which biomarker had the most unique variance (i.e. the largest beta weight) when the other independent variables were included in the regression models. In crude linear models, we added one urinary biomarker ([NAG-Cr] or [ACR] or [OCR]). In multivariable models, we added CVD risk factors (sex, age, BMI, current smoker, diabetes and prior cardiovascular event (stroke or heart attack)) and one urinary biomarker ([NAG-Cr] or [ACR] or [OCR]). In fully adjusted models, we added CVD risk factors and all urinary biomarkers ([NAG-Cr] and [ACR] and [OCR]). We included eGFR in all multivariable models but excluded this variable from the models if it had no impact on the standardized regression coefficients. In the same crude and multivariable linear models, we also used the log-transformed median concentration of the urinary biomarkers without the urine creatinine concentration ratio. The strengths of the associations were compared and presented as standardized b-coefficients (std beta) in the whole cohort and in those with and without treated hypertension.
In a cohort of participants who delivered urine samples in Tromsø 6 and later participated in Tromsø 7, we assessed the association between the biomarkers and the dependent variable incident hypertension in the normotension cohort in Tromsø 6. We further evaluated the association between the biomarkers and the dependet variable progressive hypertension in the cohort with controlled hypertension in Tromsø 6. We used univariable and multivariable logistic regression analyses and the same regression models described in the cross-sectional analyses. The logistic regression analysis reports unstandardized regression coefficients, p values, the odds ratio with corresponding 95% confidence intervals and the semi-standardized regression coefficients using the Kaufman formula to compare the strength of the associations [Citation37,Citation38]. The semi-standardized coefficient given by the Kaufman formula measures the change in predicted probability associated with a one standard deviation change in the predictor and is restricted to the interval −1 to 1 [Citation38]. The semi-standardized regression coefficients were calculated at the mean predicted probability for the outcome in the population for the two longitudinal analyses (mean predicted probability 0.32 for incident hypertension and mean predicted probability 0.55 for progressive hypertension). The range of estimated semi-standardized regression coefficients for different probability reference values was calculated for the urine biomarkers and displayed graphically for the fully adjusted models.
Participants with missing data were excluded only for analyses for which the case had missing data.
The urine albumin assay’s limit of detection in Tromsø 6 is given at 4 mg/L, but the PENTRA instrument reports albumin concentrations as low as 1 mg/L. These results were published in previous publications from the Tromsø Study [Citation39–41] and in the main analyses of the present study. The limit of detection for the albumin concentration almost corresponds to the median albumin concentration in Tromsø 6. Given a large number of observations below the limit, we further treated all observations of albumin concentration lower than 4 mg/L as left-censored and repeated the linear and logistic regressions for the association with blood pressure and incident hypertension using the deletion method [Citation7,Citation42].
We explored interaction effects between the urinary biomarkers, age, and sex. We present the most pronounced interaction effects in a supplementary table and display the mean associations with standardized beta coefficients in the main tables. Significant interactions with sex are presented as standardized beta coefficients for men and women. Significant interactions with age are presented as centered scores expressed as SD (i.e. standardized regression coefficients) corresponding to the mean age ± 1 SD.
Statistical significance was defined as two-sided p < 0.05 in all analyses. We used SPSS Statistics for Windows, Version 27.0 (IBM SPSS Statistics for Windows, Version 27 .0. Armonk, NY: IBM Corp).
Results
Baseline characteristics
A total of 7197 participants with a mean age of 63.5 years (SD 9.2), a mean blood pressure of 141/78 mmHg (SD 23.0/10.6), and a mean BMI of 27.3 kg/m2 (SD 4.2) were included in the cross-sectional study ().
Of the 7197 participants, 2326 (32%) used one or more blood pressure-lowering drugs. Subjects using blood pressure-lowering drugs were older and had higher blood pressure, BMI, and more frequently diabetes and CVD compared to participants without antihypertensive treatment. On the other hand, current smoking was observed more frequently among those not using blood pressure-lowering drugs (). The participants using blood pressure-lowering drugs had lower eGFR and higher OCR, NAG-Cr, and ACR (). The average number of blood pressure-lowering drugs in the treated cohort was 2.
Table 1. Characteristics. Individuals with and without treated HT in the Tromsø 6–2 study.
Table 2. Markers of kidney damage.
Women had lower eGFR and OCR but higher NAG-Cr. Women not using blood pressure-lowering drugs had higher ACR compared to men (Supplementary Table S1).
The correlation coefficient between the log-transformed median ACR and OCR was 0.55. The correlation coefficient between the log-transformed median ACR and NAG-Cr was 0.13. The corresponding correlations between the urinary biomarker concentrations (not adjusted for the urine creatinine concentration) were essentially the same (p < 0.001 for all correlations).
The cohort of participants who delivered urine samples in Tromsø 6 and later participated in Tromsø 7 consisted of 5114 participants (). During this time period mean serum creatinine increased from 69.2 µmol/L (SD 15.1) to 76.2 µmol/L (SD 24.0) and accordingly eGFR decreased from 93.8 mL/min/1.73m2 (SD 14.6) to 80.1 mL/min/1.73 m2 (SD 18.9) (Supplementary Table S2).
Cross-sectional associations
OCR and ACR, but not NAG-Cr, was significantly associated with systolic and diastolic blood pressure in all the crude and multivariable cross-sectional analyses. OCR had a consistently, although marginally, stronger association with blood pressure than ACR in crude and multivariable models. In fully adjusted models with cardiovascular risk factors and all urinary biomarkers included, OCR was the only urine biomarker significantly associated with blood pressure in all groups (i.e. the groups with and without treated hypertension and the entire cohort) (). Adjustment for eGFR did not affect the standardized regression coefficients in the multivariable models and was therefore excluded from the analyses. OCR exhibited the most pronounced significant interactions with sex and age. The age interaction was most prominent for OCR in men, and OCR showed a stronger association with blood pressure in the youngest category (men ≤60 years) (Supplementary Table S3).
Table 3. Urine biomarkers as ratios with urine creatinine concentration cross sectional analysis of the Tromsø 6–2 Study.
The associations of urinary albumin and orosomucoid concentrations with blood pressure did not differ substantially from the corresponding associations with ACR and OCR, respectively (Supplementary Table S4). Orosomucoid had the highest unique variance with blood pressure in the cohort with treated hypertension. Although NAG concentration showed a stronger association with blood pressure than NAG-Cr, urinary NAG concentration was not significantly associated with blood pressure in fully adjusted models and explained the least variance in crude and multivariable models. (Supplementary Table S4).
Incident hypertension in longitudinal analysis
The number of participants with normotension in Tromsø 6 was 2744, among these, 681 participants were classified with incident hypertension in Tromsø 7. OCR and ACR, but not NAG-Cr, were significantly associated with incident hypertension after seven years in crude and multivariable models. The semi-standardized regression coefficients showed that OCR had the marginally strongest association with incident hypertension. In fully adjusted models, OCR was the only urine biomarker with a significant association with incident hypertension. In these models, the difference between the semi-standardized regression coefficients for ACR and OCR increased due to the correlation between these biomarkers and displaying a higher unique variance between OCR and incident hypertension ( and ). Adjustment for baseline eGFR did not affect the semi-standardized regression coefficients, and there were no interactions between the biomarker-creatinine ratios and age or sex.
Table 4. Urine biomarkers as ratios with urine creatinine concentration.
The associations with incident hypertension did not change for albumin or orosomucoid in analysis without adjustment for the urine creatinine concentration, but NAG showed a stronger association with incident hypertension than NAG-Cr. Orosomucoid was the only significant urine biomarker in the fully adjusted model. The difference between the semi-standardized regression coefficients in the fully adjusted model increased, displaying a higher unique variance between orosomucoid and incident hypertension (Supplementary Table S5). Inclusion of baseline eGFR in these models did not alter the standardized regression coefficients.
Progressive hypertension in longitudinal analysis
The number of participants with controlled hypertension in Tromsø 6 was 353, and 193 were classified as having progressive hypertension in Tromsø 7. In the longitudinal analyses of progressive hypertension, only OCR and ACR, but not the NAG-Cr, yielded significant or borderline significant results in crude and multivariable models. OCR and ACR showed equally strong associations with progressive hypertension in the multivariable models. However, none of the biomarkers were significantly associated with progressive hypertension in the fully adjusted model (, ). Adjustment for baseline eGFR affected the standardized regression coefficients, and eGFR was included in these multivariable models (Supplementary Table S6). There were no interactions between the biomarkers-creatinine ratios and age or sex.
Table 5. Urine biomarkers as ratios with urine creatinine concentration.
The analyses with progressive hypertension and biomarkers without the urine creatinine ratios yielded no significant associations.
Left censored analysis for ACR
The analyses with ACR left-censored, including participants with urine albumin concentration ≥4 mg/L only, comprised 2553 participants in the cross-sectional analysis with blood pressure, and 752 participants in the longitudinal analysis with incident hypertension, which affected the regression coefficients for ACR in the univariable and multivariable models. The analysis reinforced the previously described pattern with the strongest associations between OCR, blood pressure and incident hypertension (Supplementary Table S7, S8).
Discussion
The present population-based, cross-sectional and prospective observational study is, according to our knowledge, the first study that aims to compare UAE, urinary orosomucoid and NAG in relation to blood pressure and the development and progression of hypertension. Associations between urinary orosomucoid and urinary NAG with kidney function decline, CKD, and CVD have been described [Citation26,Citation43–48]. Mechanisms for these associations are unclear, and correlation coefficients between UAE and these biomarkers are small to moderate, between 0.1 and 0.5 [Citation26,Citation49,Citation50], and traditional cardiovascular risk factors such as hypertension may modify the associations. In our study, urine orosomucoid excretion had a marginally stronger association than UAE with blood pressure in the cross-sectional analysis and with incident hypertension in the longitudinal analysis. These findings may be of clinical implication because both eGFR and ACR are insensitive biomarkers of early kidney and endothelial damage in hypertension at a stage when prevention may be most effective [Citation4,Citation11,Citation12].
Orosomucoid is a 41–43 kDa acute phase glycoprotein, synthesized mainly by hepatocytes [Citation51], but also produced in endothelial cells [Citation16]. Similar to albumin, it is negatively charged due to the presence of sialic acids [Citation51]. In addition to functioning as a serum transport protein [Citation52,Citation53], it modulates immune and inflammatory responses [Citation54,Citation55], and it is a constituent of the endothelial surface layer and maintains permselectivity [Citation18,Citation19]. A study of plasma orosomucoid, and other inflammation-sensitive plasma proteins, showed a cross-sectional association with blood pressure and a longitudinal association with increased stroke risk [Citation45]. In patients with type 2 diabetes and normal UAE, increased urinary orosomucoid independently predicted cardiovascular mortality [Citation50,Citation56,Citation57]. This relationship is proposed to be caused by inflammation and early endothelial dysfunction [Citation58]. Sun et al found an association between established markers of kidney dysfunction, orosomucoid and hypertension in a prospective study on people with prediabetes [Citation48]. Urine, but not serum orosomucoid, may also be an early and predictive marker for lupus nephritis [Citation22,Citation59], indicating that urine orosomucoid may reflect a pathophysological process in the kidneys, and not just systemic inflammation. Levels of urinary orosomucoid was significantly higher with active compared to inactive lupus nephritis, both for absolute levels and levels standardized by urine creatinine. Urine orosomucid was however not significantly different between lupus nephritis groups when corrected for nonselective proteinuria [Citation22]. Due to its smaller molecular weight and possibly less efficient tubular reabsorption [Citation60,Citation61], urinary orosomucoid excretion may be a more specific marker of endothelial dysfunction and glomerular damage than UAE [Citation18,Citation19,Citation22]. The pathophysiological mechanisms of orosomucoid in hypertension has not been clarified and we cannot make inferences about causality from observational studies. A cross sectional study of participants in Tromsø 6 second visit showed an association between urinary orosomucoid and diastolic dysfunction and carotid arteriopathy [Citation62]. UAE was not significantly associated with diastolic dysfunction, but the associations with carotid arteriopathy were comparable to UOCR. In our study, urine orosomucoid showed a stronger relationship with blood pressure and the development of hypertension than UAE, but further prospective clinical studies are neede to assess if orosomucoid is a clinically useful biomarker in hypertension.
The proximal tubules are responsible for reabsorbing approximately 65% of filtered load and most low molecular weight proteins [Citation63]. It is hypothesized that subclinical kidney injury, with the development of afferent arteriolopathy and tubulointerstitial disease, especially in the outer medulla, leads to kidney ischemia, inflammation and oxidative stress, which is associated with a decrease in sodium filtration and an increase in blood pressure [Citation4]. Urinary NAG is a marker of proximal tubular cell function and is considered a sensitive marker related to inflammation and oxidative stress [Citation25]. Earlier studies of urinary NAG in blood pressure and hypertension are limited in sample size or in the urine collection method [Citation12,Citation64–67]. A small study of patients with newly diagnosed hypertension without microalbuminuria found a significantly higher NAG activity in hypertensives compared to healthy controls [Citation28]. Further, NAG, but not ACR, was significantly associated with incident hypertension among the HIV-uninfected women in the Women′s Interagency HIV Study [Citation64]. In this general population cohort, consisting of participants with overall normal kidney function, urinary NAG yielded only weak or non-significant associations with blood pressure and hypertension in our multivariable models with CVD risk factors.
Further, the limit of detection for the albumin concentration assay corresponded almost to the population′s median albumin concentration, similarly to other studies [Citation8–11]. Orosomucoid was analyzed by a highly sensitive immunoassay with a limit of detection below the lowest measured value in our population [Citation35]. Additional recommended analyses with ACR left-censored [Citation8,Citation35] reinforced the described pattern of associations between biomarkers, blood pressure and incident hypertension. In the left-censored analyses, OCR had the strongest association with blood pressure in treated and untreated subjects. Further, only OCR had significant associations with incident hypertension in the additional analysis.
The best measure of biomarker excretions in urine is likely to vary for glomerular and tubular biomarkers [Citation26,Citation68]. We used morning urine samples collected on three consecutive days. We reduced the impact of a day-to-day variation using the median values of the three specimens. There is a high correlation between 24-h urine albumin excretion and ACR [Citation69,Citation70]. Whether this correlation also applies to OCR is unknown. Timed urine collections may be problematic due to imprecision in timing and volume of the collections, especially in outpatients settings. But tubular biomarker excretion in urine may be more accurately estimated with timed collections than in spot urine samples. The excretion of a tubular biomarker may not correlate with the amount of filtered creatinine. The timed collections may further be expressed with ratios of urine creatinine to adjust for varying urine concentration and dilution [Citation71]. To study the effect of the urine creatinine concentration, we analyzed the relationship between the biomarkers, blood pressure and hypertension both with and without adjustment for urine creatinine. The associations of urinary albumin and orosomucoid concentrations with blood pressure and incident hypertension did not differ substantially from the corresponding associations with ACR and OCR. NAG showed a stronger association with blood pressure and incident hypertension than NAG-Cr. The analysis without adjustment for urine creatinine did not affect the assessment of the strength of these associations compared to urinary albumin excretion (UAE). The functioning nephron mass may be another factor altering the urine biomarker excretion [Citation72]. However, in our study, adjusting for eGFR did not change associations with blood pressure and hypertension for most analyses. The relatively healthy study population with a narrow distribution of eGFR may explain this.
Participants with the highest blood pressure at baseline, or the largest increase in blood pressure during follow-up, would be most likely to increase their antihypertensive treatment. To take this into account, we dichotomized blood pressure into incident hypertension and progressive hypertension in the longitudinal analysis, which led to a loss of statistical power.
The strengths of the present study includes the combination of a cross-sectional and prospective design, the inclusion of a large, well described cohort with a high attendance rate, and an extended follow-up. Moreover, using three urinary samples per participants made the estimation of the biomarkers more robust. However, there are several limitations. The population included in the Tromsø Study consists almost exclusively of North-European middle-aged and elderly persons, limiting broad generalizations. Information about drug dosing or adherence to prescribed hypertension treatment was lacking, which may bias the results, particularly in the analysis assessing progressive hypertension. We were unable to obtain information regarding detection limits for the NAG measurements. Finally, this study did not address the associations between the urine biomarkers and clinically relevant endpoints in hypertension.
Conclusions
In a cohort from the general population, urine orosomucoid excretion showed a stronger cross-sectional association with blood pressure in treated and untreated individuals and a stronger association with incident hypertension after 7 years than UAE. Urine orosomucoid excretion may be an earlier biomarker than UAE for kidney and endothelial damage in hypertension. However, further studies are needed to determine the pathophysiological mechanisms and the clinical value of orosomucoid as a biomarker in hypertension. The tubulointerstitial function is essential in blood pressure regulation, and tubulointerstitial damage appears early in CKD. However, we found only varying and weak associations between U-NAG, blood pressure and hypertension. The observational design limits suggestions about cause and effect and further prospective studies should be undertaken.
Supplemental Material
Download MS Excel (35.9 KB)Disclosure statement
No potential conflict of interest was reported by the author(s).
Additional information
Funding
References
- GBD 2013 Risk Factors Collaborators, Forouzanfar MH, Alexander L, et al. Global, regional, and national comparative risk assessment of 79 behavioural, environmental and occupational, and metabolic risks or clusters of risks in 188 countries, 1990–2013: a systematic analysis for the Global Burden of Disease Study 2013. Lancet. 2015;386(10010):2287–2323.
- Al-Makki A, DiPette D, Whelton PK, et al. Hypertension pharmacological treatment in adults: a World Health Organization guideline executive summary. Hypertension. 2022;79(1):293–301.
- Zheng W, Mu J, Chu C, et al. Association of blood pressure trajectories in early life with subclinical renal damage in middle age. J Am Soc Nephrol. 2018;29(12):2835–2846.
- Johnson RJ, Herrera-Acosta J, Schreiner GF, et al. Subtle acquired renal injury as a mechanism of salt-sensitive hypertension. N Engl J Med. 2002;346(12):913–923.
- Chronic Kidney Disease Prognosis Consortium, Matsushita K, van der Velde M, et al. Association of estimated glomerular filtration rate and albuminuria with all-cause and cardiovascular mortality in general population cohorts: a collaborative meta-analysis. Lancet. 2010;375(9731):2073–2081.
- Williams B, Mancia G, Spiering W, et al. 2018 Practice guidelines for the management of arterial hypertension of the European Society of Hypertension and the European Society of Cardiology: ESH/ESC Task Force for the Management of Arterial Hypertension. J Hypertens. 2018;36(12):2284–2309.
- Dyer AR, Greenland P, Elliott P, et al. Estimating laboratory precision of urinary albumin excretion and other urinary measures in the International Study on Macronutrients and Blood Pressure. Am J Epidemiol. 2004;160(3):287–294.
- Chang AR, Kramer H, Wei G, et al. Effects of intensive blood pressure control in patients with and without albuminuria: post hoc analyses from SPRINT. Clin J Am Soc Nephrol. 2020;15(8):1121–1128.
- Alharf AA, Cleland S, Webster J, et al. Microalbuminuria in subjects with hypertension attending specialist blood pressure clinics. J Hum Hypertens. 2016;30(9):527–533.
- Gerstein HC, Mann JF, Yi Q, et al. Albuminuria and risk of cardiovascular events, death, and heart failure in diabetic and nondiabetic individuals. JAMA. 2001;286(4):421–426.
- Fassett RG, Venuthurupalli SK, Gobe GC, et al. Biomarkers in chronic kidney disease: a review. Kidney Int. 2011;80(8):806–821.
- Lousa I, Reis F, Beirao I, et al. New potential biomarkers for chronic kidney disease management-a review of the literature. Int J Mol Sci. 2020;22(1):43.
- Fried LF, Lewis J. Albuminuria is not an appropriate therapeutic target in patients with CKD: the con view. Clin J Am Soc Nephrol. 2015;10(6):1089–1093.
- Shlomai G, Grassi G, Grossman E, et al. Assessment of target organ damage in the evaluation and follow-up of hypertensive patients: where do we stand? J Clin Hypertens (Greenwich). 2013;15(10):742–742.
- Taal MW. Progress in risk prediction for people with chronic kidney disease. Curr Opin Nephrol Hypertens. 2014;23(6):519–524.
- Sorensson J, Matejka GL, Ohlson M, et al. Human endothelial cells produce orosomucoid, an important component of the capillary barrier. Am J Physiol. 1999;276(2):H530–H534.
- Clausen P, Jensen JS, Jensen G, et al. Elevated urinary albumin excretion is associated with impaired arterial dilatory capacity in clinically healthy subjects. Circulation. 2001;103(14):1869–1874.
- Haraldsson BS, Johnsson EK, Rippe B. Glomerular permselectivity is dependent on adequate serum concentrations of orosomucoid. Kidney Int. 1992;41(2):310–316.
- Haraldsson B, Rippe B. Orosomucoid as one of the serum components contributing to normal capillary permselectivity in rat skeletal muscle. Acta Physiol Scand. 1987;129(1):127–135.
- Gimbrone MA Jr, Garcia-Cardena G. Endothelial cell dysfunction and the pathobiology of atherosclerosis. Circ Res. 2016;118(4):620–636.
- Dickson LE, Wagner MC, Sandoval RM, et al. The proximal tubule and albuminuria: really! J Am Soc Nephrol. 2014;25(3):443–453.
- Suzuki M, Wiers K, Brooks EB, et al. Initial validation of a novel protein biomarker panel for active pediatric lupus nephritis. Pediatr Res. 2009;65(5):530–536.
- Jiang H, Guan G, Zhang R, et al. Increased urinary excretion of orosomucoid is a risk predictor of diabetic nephropathy. Nephrology (Carlton). 2009;14(3):332–337.
- Hultberg B, Ravnskov U. The excretion of N-acetyl-beta-glucosaminidase in glomerulonephritis. Clin Nephrol. 1981;15(1):33–38.
- Bosomworth MP, Aparicio SR, Hay AW. Urine N-acetyl-beta-D-glucosaminidase–a marker of tubular damage? Nephrol Dial Transplant. 1999;14(3):620–626.
- Solbu MD, Toft I, Lochen ML, et al. N-acetyl-beta-D-glucosaminidase does not enhance prediction of cardiovascular or all-cause mortality by albuminuria in a low-risk population. J Am Soc Nephrol. 2016;27(2):533–542.
- Tylicki L, Manitius J, Lysiak-Szydlowska W, et al. Tubular injury: the first symptom of hypertensive kidney involvement? Med Sci Monit. 2003;9(4):CR135–CR141.
- Lee E, Lee YK, Kang HJ. Association between the urinary N-acetyl-beta-D-glucosaminidase/creatinine ratio and factors of the metabolic syndrome. Ann Clin Lab Sci. 2018;48(5):627–633.
- Eggen AE, Mathiesen EB, Wilsgaard T, et al. The sixth survey of the Tromso Study (Tromso 6) in 2007–08: collaborative research in the interface between clinical medicine and epidemiology: study objectives, design, data collection procedures, and attendance in a multipurpose population-based health survey. Scand J Public Health. 2013;41(1):65–80.
- https://uit.no/research/tromsostudy. The seventh survey of the Tromsø Study. Available from: https://uit.no/research/tromsostudy/project?pid=708909
- European Society of Hypertension-European Society of Cardiology Guidelines Commitee. 2003 European Society of Hypertension-European Society of Cardiology guidelines for the management of arterial hypertension. J Hypertens. 2003;21(6):1011–1053.
- Ptinopoulou AG, Pikilidou MI, Lasaridis AN. The effect of antihypertensive drugs on chronic kidney disease: a comprehensive review. Hypertens Res. 2013;36(2):91–101.
- Vittinghus E. Preanalytical handling of stored urine samples, and measurement of beta 2-microglobulin, orosomucoid, albumin, transferrin and immunoglobulin G in urine by enzyme-linked immunosorbent assays (ELISA). Scand J Clin Lab Invest. 1990;50(8):843–849.
- Tencer J, Thysell H, Andersson K, et al. Long-term stability of albumin, protein HC, immunoglobulin G, kappa- and lambda-chain-immunoreactivity, orosomucoid and alpha 1-antitrypsin in urine stored at −20 degrees C. Scand J Urol Nephrol. 1997;31(1):67–71.
- Stevens LA, Coresh J, Schmid CH, et al. Estimating GFR using serum cystatin C alone and in combination with serum creatinine: a pooled analysis of 3,418 individuals with CKD. Am J Kidney Dis. 2008;51(3):395–406.
- Eriksen BO, Mathisen UD, Melsom T, et al. The role of cystatin C in improving GFR estimation in the general population. Am J Kidney Dis. 2012;59(1):32–40.
- Kaufman RL. Comparing effects in dichotomous logistic regression: a variety of standardized coefficients. Soc Sci Q. 1996;77:90–109.
- King JE. Standardized coefficients in logistic regression. Paper presented at: Annual meeting of the Southwest Educational Research Association; 2007 Feb 7–10; San Antonio, TX.
- Melsom T, Solbu MD, Schei J, et al. Mild albuminuria is a risk factor for faster GFR decline in the nondiabetic population. Kidney Int Rep. 2018;3(4):817–824.
- Storhaug HM, Toft I, Norvik JV, et al. Uric acid is associated with microalbuminuria and decreased glomerular filtration rate in the general population during 7 and 13 years of follow-up: the Tromso study. BMC Nephrol. 2015;16:210.
- Melsom T, Schei J, Stefansson VT, et al. Prediabetes and risk of glomerular hyperfiltration and albuminuria in the general nondiabetic population: a prospective cohort study. Am J Kidney Dis. 2016;67(6):841–850.
- Nie L, Chu H, Liu C, et al. Linear regression with an independent variable subject to a detection limit. Epidemiology. 2010;21 Suppl 4:S17–S24.
- Kim SR, Lee YH, Lee SG, et al. The renal tubular damage marker urinary N-acetyl-beta-D-glucosaminidase may be more closely associated with early detection of atherosclerosis than the glomerular damage marker albuminuria in patients with type 2 diabetes. Cardiovasc Diabetol. 2017;16(1):16.
- Engstrom G, Stavenow L, Hedblad B, et al. Inflammation-sensitive plasma proteins and incidence of myocardial infarction in men with low cardiovascular risk. Arterioscler Thromb Vasc Biol. 2003;23(12):2247–2251.
- Engstrom G, Lind P, Hedblad B, et al. Long-term effects of inflammation-sensitive plasma proteins and systolic blood pressure on incidence of stroke. Stroke. 2002;33(12):2744–2749.
- Berntsson J, Ostling G, Persson M, et al. Orosomucoid, carotid plaque, and incidence of stroke. Stroke. 2016;47(7):1858–1863.
- Jungbauer CG, Uecer E, Stadler S, et al. N-acteyl-ss-D-glucosaminidase and kidney injury molecule-1: New predictors for long-term progression of chronic kidney disease in patients with heart failure. Nephrology (Carlton). 2016;21(6):490–498.
- Sun ZJ, Wang JW, Chang DY, et al. Unstably controlled systolic blood pressure trajectories are associated with markers for kidney damage in prediabetic population: results from the INDEED cohort study. J Transl Med. 2020;18(1):194.
- Solbu MD, Norvik JV, Storhaug HM, et al. The association between adiponectin, serum uric acid and urinary markers of renal damage in the general population: cross-sectional data from the Tromso study. Kidney Blood Press Res. 2016;41(5):623–634.
- Christiansen MS, Hommel E, Magid E, et al. Orosomucoid in urine is a powerful predictor of cardiovascular mortality in normoalbuminuric patients with type 2 diabetes at five years of follow-up. Diabetologia. 2005;48(2):386–393.
- Fournier T, Medjoubi NN, Porquet D. Alpha-1-acid glycoprotein. Biochim Biophys Acta. 2000;1482(1–2):157–171.
- Kremer JM, Wilting J, Janssen LH. Drug binding to human alpha-1-acid glycoprotein in health and disease. Pharmacol Rev. 1988;40(1):1–47.
- Israili ZH, Dayton PG. Human alpha-1-glycoprotein and its interactions with drugs. Drug Metab Rev. 2001;33(2):161–235.
- Logdberg L, Wester L. Immunocalins: a lipocalin subfamily that modulates immune and inflammatory responses. Biochim Biophys Acta. 2000;1482(1–2):284–297.
- Hochepied T, Berger FG, Baumann H, et al. Alpha(1)-acid glycoprotein: an acute phase protein with inflammatory and immunomodulating properties. Cytokine Growth Factor Rev. 2003;14(1):25–34.
- Svendstrup M, Christiansen MS, Magid E, et al. Increased orosomucoid in urine is an independent predictor of cardiovascular and all-cause mortality in patients with type 2 diabetes at 10 years of follow-up. J Diabetes Complications. 2013;27(6):570–575.
- Christiansen MS, Hommel E, Magid E, et al. Orosomucoid in urine predicts cardiovascular and over-all mortality in patients with Type II diabetes. Diabetologia. 2002;45(1):115–120.
- Christiansen MS, Iversen K, Larsen CT, et al. Increased urinary orosomucoid excretion: a proposed marker for inflammation and endothelial dysfunction in patients with type 2 diabetes. Scand J Clin Lab Invest. 2009;69(2):272–281.
- Suzuki M, Ross GF, Wiers K, et al. Identification of a urinary proteomic signature for lupus nephritis in children. Pediatr Nephrol. 2007;22(12):2047–2057.
- Sand KM, Bern M, Nilsen J, et al. Unraveling the interaction between FcRn and albumin: opportunities for design of albumin-based therapeutics. Front Immunol. 2014;5:682.
- Comper WD, Russo LM, Vuchkova J. Are filtered plasma proteins processed in the same way by the kidney? J Theor Biol. 2016;410:18–24.
- Andreassen RM, Kronborg JB, Schirmer H, et al. Urinary orosomucoid is associated with diastolic dysfunction and carotid arteriopathy in the general population. Cross-sectional data from the Tromso study. Scand Cardiovasc J. 2022;56(1):148–156.
- Zhuo JL, Li XC. Proximal nephron. Compr Physiol. 2013;3(3):1079–1123.
- Ascher SB, Scherzer R, Peralta CA, et al. Association of kidney function and early kidney injury with incident hypertension in HIV-infected women. Hypertension. 2017;69(2):304–313.
- Agirbasli M, Radhakrishnamurthy B, Jiang X, et al. Urinary N-acetyl-beta-D-glucosaminidase changes in relation to age, sex, race, and diastolic and systolic blood pressure in a young adult biracial population. The Bogalusa Heart Study. Am J Hypertens. 1996;9(2):157–161.
- Alderman MH, Melcher L, Drayer DE, et al. Increased excretion of urinary N-acetyl-beta-glucosaminidase in essential hypertension and its decline with antihypertensive therapy. N Engl J Med. 1983;309(20):1213–1217.
- Opsahl JA, Abraham PA, Halstenson CE, et al. Correlation of office and ambulatory blood pressure measurements with urinary albumin and N-acetyl-beta-D-glucosaminidase excretions in essential hypertension. Am J Hypertens. 1988;1(3 Pt 3):117S–120S.
- Nauta FL, Scheven L, Meijer E, et al. Glomerular and tubular damage markers in individuals with progressive albuminuria. Clin J Am Soc Nephrol. 2013;8(7):1106–1114.
- Dyer AR, Greenland P, Elliott P, et al. Evaluation of measures of urinary albumin excretion in epidemiologic studies. Am J Epidemiol. 2004;160(11):1122–1131.
- Vart P, Scheven L, Lambers Heerspink HJ, et al. Urine albumin-creatinine ratio versus albumin excretion for albuminuria staging: a prospective longitudinal cohort study. Am J Kidney Dis. 2016;67(1):70–78.
- Tassi C, Mancuso F, Feligioni L, et al. Expression modes of urinary N-acetyl-beta-D-glucosaminidase in patients with chronic renal insufficiency. Clin Chim Acta. 2004;346(2):129–133.
- Ellam TJ, El Nahas M. Proteinuria thresholds are irrational: a call for proteinuria indexing. Nephron Clin Pract. 2011;118(3):c217–c224.