
Abstract
Purpose: A limited number of studies have suggested a nonlinear association between spot urine (SU) sodium concentration and office blood pressure (BP). We examined how SU sodium concentration and dietary salt obtained from a food frequency questionnaire are associated with more accurately measured home BP in a large, nationwide population sample.
Materials and methods: We included 1398 participants in cross-sectional and 851 participants in 11-year longitudinal analyses. We investigated associations between baseline salt/sodium variables and (i) baseline and follow-up home BP; and (ii) prevalent and incident hypertension with linear and logistic regression models.
Results: We observed positive associations (β ± standard error) between salt/sodium variables and BP in unadjusted models. SU sodium concentration associated with baseline systolic (0.04 ± 0.01, p < 0.001) and diastolic (0.02 ± 0.01, p < 0.001) BP and follow-up systolic (0.03 ± 0.01, p = 0.003) and diastolic (0.02 ± 0.01, p < 0.001) BP. Dietary salt intake was associated with baseline (0.52 ± 0.19, p = 0.008) and follow-up (0.57 ± 0.20, p = 0.006) systolic BP. Compared to the lowest quintile of SU sodium concentration, the highest quintile had greater odds of prevalent hypertension (odds ratio [OR] 1.57, 95% confidence interval [CI] 1.12–2.19) and the second highest quintile with incident hypertension (OR 1.86, 95% CI 1.05–3.34). Unadjusted odds of incident hypertension were higher in the highest as compared to the lowest quintile of dietary salt intake (OR 1.83, 95% CI 1.01–3.35). After adjustments for sex, age, plasma creatinine concentration and alcohol intake, none of the aforementioned associations remained statistically significant. We found no evidence of a J-shaped association between the salt/sodium variables and BP or hypertension.
Conclusion: SU sodium concentration and dietary salt intake are associated with home BP and hypertension only in some of the unadjusted models. Our results underscore that feasible estimation of sodium intake remains challenging in epidemiology.
PLAIN LANGUAGE SUMMARY
Some studies have suggested a non-linear association between spot urine sodium and blood pressure
24-hour urinary sodium sampling is the gold standard method for assessing sodium intake
What is known about the topic
Multiple fractional polynomials did not reveal evidence of a J-shaped association between spot urine sodium or dietary salt intake (measured by a questionnaire) and home blood pressure
Precise and yet feasible estimation of sodium intake remains challenging in epidemiology.
What this study adds
Introduction
Several guidelines emphasise the role of excess sodium intake as a modifiable risk factor for hypertension [Citation1]. The causal relationship between sodium intake with blood pressure (BP) and cardiovascular disease has been further established by a recent intervention study [Citation2]. In 2010, global mean salt (sodium chloride) intake was ∼10 grams per day [Citation3], far exceeding WHO’s recommendation by which adults are to consume less than 5 grams of salt (<2 grams sodium) per day [Citation4].
The INTERSALT was one of the earlier studies to show a positive linear association between 24-hour urinary sodium excretion and BP [Citation5]. However, contrary to expectations, two large cohort studies from the PURE investigators have thereafter shown a J-curve association between salt intake and the risk of cardiovascular diseases (CVD), suggesting that excessive reduction of salt intake could be disadvantageous. In those studies, when estimated sodium excretions of 4–5.99 grams [Citation6] and 4–4.99 grams [Citation7] per day (the reference groups) were compared with estimated sodium excretion of <3 grams (lower intake group) and >7 grams (higher intake group), both lower and higher salt intake groups were positively associated with the risks of CVD events and stroke. The PURE investigators have also suggested that even the relationship between spot urine (SU) sodium concentration and BP could be nonlinear [Citation8]. These studies have two main key weaknesses. First, the studies used SU samples for estimating salt intake with a mathematical formula rather than 24-hour urinary sodium sampling, which is considered the gold standard method. Second, office readings were used to assess BP instead of more accurate out-of-office measurements, such as home or ambulatory BP.
Sodium intake can also be estimated with dietary methods, such as the 24-hour dietary recall and the food frequency questionnaire (FFQ) [Citation9]. However, some authors have argued that by comparison with 24-hour urinary sodium excretion, reported sodium intake may be prone to underreporting [Citation9]. Data on the association between salt intake measured with FFQ and BP are very scarce. In a Chinese study that used FFQ, high-salt diet pattern was associated with an increased risk of developing hypertension among a middle-aged Chinese population [Citation10].
SU sampling or food frequency questionnaires (FFQ) are more feasible methods for assessing salt intake than the 24-hour urinary sodium sampling or the 24-hour dietary recall method in many research and clinical settings [Citation11]. However, it remains unclear as to whether SU sodium concentrations or FFQ-based salt intake estimates are appropriate surrogate markers of salt intake in BP studies. The associations between SU sodium concentration and FFQ-based salt intake with BP have remained elusive to demonstrate, possibly in part due to the use of inaccurate BP measurement methods [Citation8].
The open questions in the relationship between sodium intake and CVD risk warrant further study on the surrogates of sodium intake and their associations with BP. The goal of this study was to further investigate the association of sodium intake estimates obtained from an FFQ and SU sampling with BP in a large representative sample of a nationwide adult population. Specifically, we sought to assess for the first time how these biomarkers associate with home BP, a stronger predictor of cardiovascular risk than office BP [Citation12].
Methods
Participants
The present study is based on the multidisciplinary epidemiological Health 2000 Survey, carried out in Finland in 2000–2001, and its follow-up, the Health 2011 Survey, conducted in 2011–2012. The study population was a stratified two-stage cluster sample of 8028 individuals drawn randomly from the population register to represent Finnish adults aged 30 years or over. The stratification and sampling procedures have been described elsewhere [Citation13,Citation14]. At baseline, 6354 adults (79%) participated in a health interview and a health examination. A total of 3857 (61%) of these were re-examined in the follow-up survey.
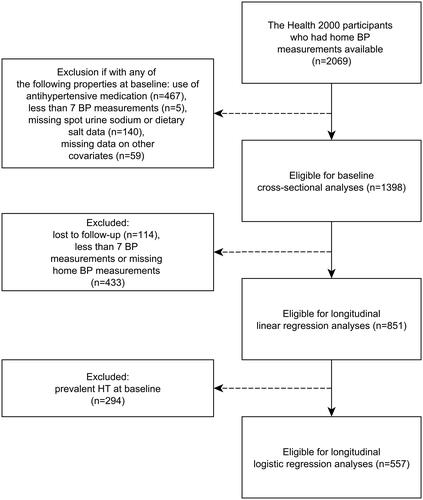
We used data from a home BP monitoring substudy (the Finn-Home Study) of the Health 2000 and 2011 surveys to analyse the associations of SU sodium concentration and dietary salt with home BP [Citation13,Citation14]. A total of 2120 participants aged 45–74 years at the baseline survey were randomly selected to this subcohort based on availability of BP monitors. Home BP measurements were available from a total of 2069 participants. In this paper, to minimise confounding effects, we excluded participants with antihypertensive medication (n = 467) at baseline. Since the first BP measurements are often higher than the subsequent measurements, we decided to include only the second BP measurements. In addition, we excluded participants according to the following baseline measurement criteria: less than 7 BP measurements (n = 5), missing urinary sodium or dietary salt data (n = 140) or missing data on any other covariates of this paper (n = 59). After exclusions, 1398 participants were included in the cross-sectional baseline analyses involving the associations between SU sodium concentration and dietary salt with home BP. Of these, 114 participants who were lost to follow-up and 433 participants with less than 7 follow-up home BP measurements were excluded from the longitudinal analyses. A total of 851 participants were eligible for the longitudinal analyses (61% of the baseline sample). In analyses with incident hypertension as the outcome variable, those with baseline prevalent hypertension (n = 294), defined as either having a mean home systolic BP ≥135 mmHg or diastolic BP ≥85 mmHg or use of antihypertensive medication at baseline, were excluded, resulting in a total of 557 included participants in these analyses ().
Figure 1. Flow-chart of inclusion-exclusion of participants in the present study.
Blood pressure measurements
Home BP was self-measured using an automatic oscillometric device (baseline: Omron model HEM-722C; follow-up: Omron HEM-7211-E; Omron Matsusaka Co., Kyoto, Japan) [Citation13,Citation15,Citation16]. Written instructions and individual guidance on how to measure BP correctly were provided for the participants. They were asked to measure their BP on seven consecutive days, twice in the mornings and twice in the evenings, at 1-min intervals. The participants were instructed to avoid eating, heavy physical exercise and smoking for an hour before the measurements. The home BP in this study was defined as the mean of all available home BP measurements (mean: 27.0 measurements at baseline and 27.6 at follow-up per patient). Selection of the correct cuff size, arm position and posture have been described in more detail in the methodology reports [Citation13,Citation14].
Urine sample collection
An SU sample was obtained from all participants at baseline. Urinary sodium was measured using ion-selective electrode in an Abbott Architect Analyser (Abbott Laboratories, Abbott Park, IL, USA). According to an External Quality Assessment Program organised by Labquality (Helsinki, Finland) the bias of the sodium method was −0.7% (n = 1). The inter-assay coefficient of variation (CV) was 1.1%. The samples were divided into labelled tubes. The procedures of sampling, sample processing and laboratory analyses have been described in more detail in a methodology report [Citation13].
Dietary questionnaires
The self-reported dietary intake of salt was estimated from a validated 128-item semi-quantitative FFQ covering the whole diet [Citation17]. The participants were asked to estimate their consumption of different foods over the previous 12 months on a nine-point scale ranging from never or seldom to six or more times per day. In addition to a fixed list of common foods, the questionnaire included a blank space for unlisted items. The portion size for each FFQ-item was fixed and appeared on the questionnaire as natural units (e.g. slice) or household measures (e.g. glass). The questionnaire was given to the participant at the health examination or home health examination, and the filling instructions were reviewed together with the participant. Participants were asked to complete the questionnaire later at home and mail it to the study centre. Trained nutritionists entered the data. The average daily intakes of food, energy and nutrients (including salt) could be calculated for 5998 participants (88.6% of the examined participants of the baseline survey) utilising the Finnish National Food Composition Database (FINELI) and the FINESSI software of the Finnish Institute for Health and Welfare [Citation18].
Statistical analyses
Statistical analyses were performed using R, version 4.0.3 (R Core Team, Vienna, Austria). p < 0.05 was considered significant. Simple and multivariable linear regression models were used to examine the associations of baseline FFQ-estimated salt intake and SU sodium concentration with baseline and follow-up BP. Same analyses were reiterated using crude fractional polynomial (FP) models to graph possible nonlinear associations between sodium/salt and BP variables. More complex FP models were tested against simpler ones in a backward elimination fashion to determine the best-fitting one. If none of the FP models fitted the data significantly better than the one with an untransformed sodium or salt variable, the chosen model was a straight line. Simple and multivariable cross-sectional and longitudinal logistic regression models were used to assess the associations between the salt/sodium variables and prevalent and incident hypertension. For these analyses, participants were divided into five even quantiles in relation to the rank order of SU sodium concentration and dietary salt values in corresponding regression models. Visual comparisons of BP values across these quantiles were explored with crude least square means of BP by quantiles. All adjusted models had baseline age, sex, plasma creatinine concentration and alcohol intake as covariates. Hypertension was defined as mean home systolic BP of 135 mmHg or more, diastolic BP of 85 mmHg or more or intake of antihypertensive medication. As a sensitivity analysis, we reiterated all fully-adjusted models adding (i) total energy intake and (ii) body mass index (BMI) as an additional covariate. As an additional sensitivity analysis, we also reiterated all analyses separately for women and men. Since salt intake is positively associated with BMI [Citation19], we decided not to include BMI as a covariate in the main analyses due to a likely risk of overadjustment.
Ethics
The Health 2000 study protocol was approved by the Epidemiology Ethics Committee of the Helsinki and Uusimaa hospital region, and all participants signed informed consent according to the Declaration of Helsinki [Citation13].
Results
The baseline and follow-up characteristics of the participants are listed in .
Table 1. Characteristics of the study population.
Cross-sectional analyses
Baseline home systolic and diastolic BP values are depicted as a function of baseline SU sodium concentration and FFQ-estimated salt intake in .
Figure 2. Baseline home systolic and diastolic blood pressure as a function of baseline spot urine sodium concentration and dietary salt intake. Each little graph illustrates two separate regression models: (1) the regression lines (dashed lines) emanate from crude fractional polynomial models having all individual sodium/salt variable observations as the regressor; if a curvilinear model does not fit the data significantly better than a model without a regressor transformation, the chosen model is a straight line; (2) error bars represent crude least square means of blood pressure by quintiles of sodium/salt variables. Q1-Q5, quintiles of a sodium/salt variable.
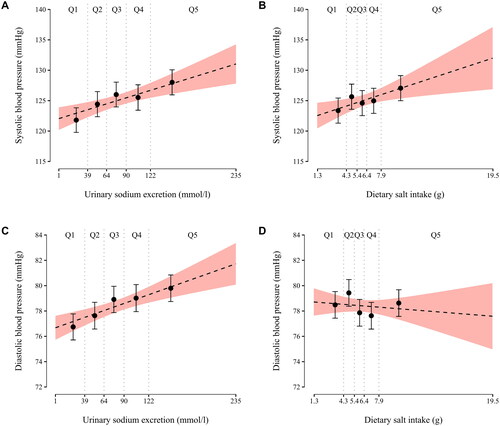
Unadjusted linear regression models showed that baseline FFQ-estimated salt intake was significantly associated with baseline systolic BP (β = 0.52, p = 0.008), but not with baseline diastolic BP (β = −0.06, p = 0.53). Baseline SU sodium concentration was significantly associated with both baseline systolic BP (β = 0.04, p < 0.001) and diastolic BP (β = 0.02, p < 0.001). When these models were adjusted for baseline age, sex, plasma creatinine concentration and alcohol intake, no statistically significant associations remained (p ≥ 0.11 for all) ().
Table 2. Associations of baseline dietary salt intakea (g/day) and SU sodium concentration (mmol/L) with baseline and 11-year follow-up BP (mmHg).
In an unadjusted logistic regression model, the odds of prevalent hypertension were higher in the highest quintile as compared to the lowest quintile of SU sodium concentration (odds ratio (OR) 1.57, 95% confidence interval (CI) 1.12–2.19, p = 0.008). The association was no longer significant when the model was adjusted for baseline age, sex, plasma creatinine concentration and alcohol intake (OR 1.27, 95% CI 0.88–1.81, p = 0.20). No other significant associations of baseline SU sodium concentration or FFQ-estimated salt intake with prevalent hypertension were observed (p ≥ 0.09 for all) ().
Table 3. Odds ratios of prevalent and incident hypertension according to quintiles of baseline spot urine sodium concentration and dietary salt intakea.
Longitudinal analyses
Follow-up home systolic and diastolic BP values are depicted as a function of baseline SU sodium concentration and FFQ-estimated salt intake in .
Figure 3. Follow-up mean home systolic and diastolic blood pressure as a function of baseline spot urine sodium concentration and dietary salt intake. Each little graph illustrates two separate regression models: (1) the regression lines (dashed lines) emanate from crude fractional polynomial models having all individual sodium/salt variable observations as the regressor; if a curvilinear model does not fit the data significantly better than a model without a regressor transformation, the chosen model is a straight line; (2) error bars represent crude least square means of blood pressure by quintiles of sodium/salt variables. Q1-Q5, quintiles of a sodium/salt variable.
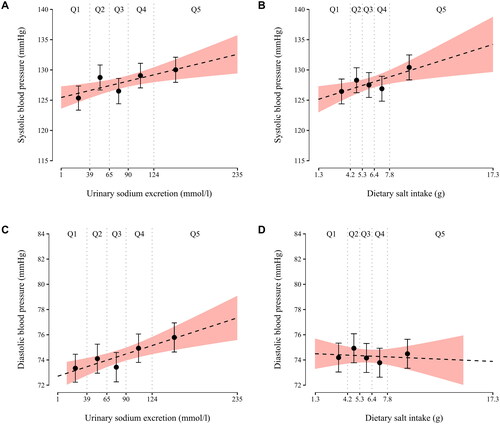
In unadjusted linear regression models, FFQ-estimated salt intake was significantly associated with follow-up systolic BP (β = 0.57, p = 0.006), but not with follow-up diastolic BP (β = −0.04, p = 0.74). Baseline SU sodium concentration was significantly associated with both follow-up systolic BP (β = 0.03, p = 0.003) and diastolic BP (β = 0.02, p < 0.001). No statistically significant associations were observed in the adjusted models (p ≥ 0.11 for all) ().
Unadjusted odds of incident hypertension were higher in the highest as compared to the lowest quintile of FFQ-estimated dietary salt intake (OR 1.83, 95% CI 1.01–3.35, p = 0.046), and unadjusted odds of incident hypertension were higher in the second highest quintile as compared to the lowest quintile of SU sodium concentration (OR 1.86, 95% CI 1.05–3.34, p = 0.033). Adjustment for baseline age, sex, plasma creatinine concentration and alcohol intake rendered these associations insignificant (p ≥ 0.22 for both). No other significant associations of baseline SU sodium concentration or FFQ-estimated salt intake with incident hypertension were observed (p ≥ 0.072 for all) ().
Sensitivity analyses
We reiterated the adjusted models with an additional adjustment for (i) total energy intake (mean 9485.1 kJ ± 3299.4 kJ) and (ii) body mass index, but that did not materially alter the results (data not shown). We also reiterated all the analyses separately for women and men. There was only one new finding: in men, FFQ-estimated salt intake was negatively associated with baseline diastolic BP (β = −0.41, p = 0.002), which remained significant also in the adjusted analysis (β = −0.38, p = 0.006). Otherwise, the results remained essentially unchanged (data not shown).
Discussion
The aim of this study was to elucidate whether SU sodium concentration and dietary salt intake obtained from an FFQ are associated with home BP and hypertension. Our unadjusted analyses showed that higher baseline SU sodium concentration was both cross-sectionally and longitudinally associated with higher BP. Baseline FFQ-estimated salt intake had similar associations only with systolic BP but not with diastolic BP. In addition, the unadjusted odds of prevalent hypertension were higher in those having baseline SU sodium concentration in the highest quintile, and the unadjusted odds of incident hypertension were higher in those having baseline SU sodium concentration in the second highest quintile, when compared with the lowest quintile. Furthermore, the unadjusted odds of incident but not prevalent hypertension were higher in those having baseline FFQ-estimated dietary salt intake in the highest quintile when compared with the lowest quintile. Adjustments with baseline age, sex, plasma creatinine concentration and alcohol intake rendered all of the aforementioned associations insignificant.
The INTERSALT study was among the earlier studies to show a positive linear association between 24-hour urinary sodium excretion and BP5. Since then, several studies have corroborated this association [Citation20–22]. However, the association between a single SU sodium concentration and BP has remained more elusive to establish. The CIRCS investigators in Japan reported an association between SU sodium and BP only in a subgroup of overweight individuals [Citation23]. The workgroup reported solely longitudinal results, and the mean follow-up time was only 5.8 years. Another Asian study was able to show an association between higher sodium concentrations in repeated SU samples used as an estimate of 24-hour urinary sodium excretion and BP [Citation24]. In the PURE study, the authors detected what they suggested was a nonlinear relationship between SU sodium concentration and BP8: the regression slope was steepest in the higher sodium group (sodium excretion of >5 grams per day), and no association was found in the lower group (sodium excretion of <3 grams per day). In contrast to the PURE study, the graphs of our study suggested a materially linear relationship between the studied salt/sodium biomarkers and BP. The reason for the difference between our results and theirs may lie in their use of an SU formula to estimate the 24-hour urinary sodium excretion (i.e. the Kawasaki formula) in the PURE study [Citation25]. In fact, Naser et al. who studied the Kawasaki, Tanaka and INTERSALT SU formulas, demonstrated that intrinsic problems in these formulas lead to a seemingly J-shaped relationship between sodium excretion and BP. Naser et al. found J-shaped relationships between sodium excretion and systolic BP only in models with SU formulas, whereas the relationship was linear when 24-hour urinary sodium excretion was used. The authors concluded that SU formulas should not be used to examine the association between sodium excretion and BP [Citation25].
We observed that salt intake measured with an FFQ associated both cross-sectionally and longitudinally with systolic BP but only in the unadjusted models. It did not associate with prevalent hypertension. Earlier literature on how salt intake measured with an FFQ associates with BP is very limited. Another population-based study showed that a high-salt diet pattern as measured by an FFQ was associated with an increased risk of prevalent hypertension among a middle-aged Chinese population [Citation10]. It has to be stressed that the strong relationship between dietary salt intake and BP per se has been firmly established in experimental dose-relationship studies [Citation26,Citation27]. A recent random-effects dose-response meta-analysis, which utilised restricted cubic splines of sodium intake, identified a linear relationship between sodium intake reduction and reduction in systolic BP and diastolic BP across the entire range of dietary sodium exposure, with no evidence for a threshold in benefit [Citation27]. Importantly, the reduction was detected, albeit to a lesser extent, also in those without hypertension.
According to the FINDIET survey, the salt intake of the Finnish population has slowly decreased over the previous decades [Citation28]. Due to the link between higher age and prior exposure to a higher salt consumption in Finland, the age covariate in our models depicts also an expected history of a greater salt consumption and certainly a cumulative exposure to the effects of salt. For that, we argue that it is hard to prevent overadjustment by age in multivariable models that aim to disentangle the link between salt intake and BP in industrialised countries. Given the complexity of the pathogenesis of hypertension and salt consumption’s role in it [Citation29], our findings underscore again the ambiguity of the relevance of a mere SU sodium as a surrogate covariate of salt intake in hypertension studies.
We also, as a sensitivity analysis, reiterated all the analyses separately for women and men, which yielded one new finding in men: FFQ-estimated salt intake was negatively associated with baseline diastolic BP, and the association remained significant after adjustments. We consider this finding to be spurious and to be likely due to the multiple testing involved in the gender-specific sensitivity analyses. Also, it has to be stressed that this finding was only present in the cross-sectional analyses, but not in the longitudinal analyses. Furthermore, this finding may arise from the differences in dietary reporting between the sexes – a phenomenon requiring attention in further studies. Regardless, this topic is out of the scope of this manuscript.
The strengths of our study include the large nationwide stratified random sample, which serves better for population-level generalisations than more selected study populations. In addition, BP was measured using home, instead of office, measurements, resulting in significant increases in measurement precision. As far as we know, this is the first study to report of the associations of urine sodium concentrations and FFQ-estimated salt intake with home BP.
The FFQ used in this study has been repeatedly validated against food records in the Finnish adult population and deemed to have reasonably good relative validity for epidemiological research purposes [Citation17,Citation30,Citation31]. Regarding sodium intake, the energy-adjusted Pearson correlation coefficient between FFQ and 14-day food records was 0.42 and 64% of subjects were classified in the same or adjacent quintile based on the two methods [Citation30], thus showing a performance level similar to renowned FFQs [Citation32,Citation33]. Moreover, calculating sodium intake from food records and dietary recalls has been validated against 24-hour urinary sodium excretion in the Finnish adult population [Citation28], which can be regarded as a strength of the reference method of the FFQ validation studies.
A potential limitation of this study are the putative dietary changes during the study period. However, based on information on dietary trends in the Finnish adult population, it is unlikely that dietary changes would have changed our results materially. In general, dietary habits in the Finnish adult population have improved throughout the past decades, yet these changes have been rather moderate between years 2000 and 2011 [Citation34]. For example, low consumption of fruits and vegetables and high intake of saturated fat continue to be nutritional challenges for the majority of the population.
A notable limitation of our study is the availability of only single SU sample data. Several population-based studies have suggested that a single SU sodium measurement is not optimal for assessing sodium intake [Citation35]. Sodium concentrations measured from a single SU sample are susceptible to many sources of error, such as fluid consumption and time of the day. Spot urine samples collected in the morning may underestimate the 24-hour sodium excretion, and samples collected in the evening may predict the 24-hour sodium excretion more accurately [Citation36]. In the present study, the exact times of the urine sample collections were unavailable; since urinary sodium excretion varies with food intake, the lack of exact collection times is a notable limitation of our study. 24-hour urinary sodium sampling is the gold standard, and it has been shown that repeated 24-hour urinary sodium samples are even more accurate in assessing sodium intake than a single 24-hour urinary sodium sample [Citation37]. However, 24-hour urinary sodium sampling remains to be an impractical method for large population studies and also in many clinical settings. A more practical option for future studies might be a collection of multiple SU samples during a longer period of time because the body tends to store and excrete sodium independently from bodyweight and BP by a rhythmic hormonal regulation [Citation38].
In conclusion, our nationwide study demonstrates an association of baseline SU sodium concentration with BP and prevalent and incident hypertension only in the unadjusted analyses. In addition, we found an unadjusted association of baseline FFQ-estimated salt intake with incident hypertension and systolic BP in cross-sectional and longitudinal models. However, none of the associations remained statistically significant after adjusting for baseline age, sex, plasma creatinine concentration and alcohol intake. We found no evidence of a J- or U-shaped association between the sodium or salt variables and BP in our graphs.
We emphasise that the negative results of our study do not undermine the role of cutting salt intake in the combat against hypertension but rather highlight the challenges in the methodology of urinary and dietary sodium measurements and statistical modelling. The availability of home BP measurements was an obvious benefit but not a remedy for these limitations in the present study. Future studies could focus on finding a method that has a fine-tuned balance between practicality and precision in the estimation of sodium intake.
Author contributions
HW, VLL and TN contributed to the study design. HW and VLL carried out the statistical analyses and drafted the manuscript. NEK advised on the analyses and helped in drafting the manuscript. All authors read and approved the final version of the manuscript.
Supplemental Material
Download TIFF Image (3.3 MB)Acknowledgements
The authors wish to thank Dr. Joonatan Palmu and Dr. Matti Vuori for helpful comments.
Disclosure statement
No potential conflict of interest was reported by the author(s).
Data availability
Health 2000 and 2011 data are available from the THL biobank based on a research application, as explained on the website of the THL biobank (https://thl.fi/en/web/thl-biobank/for-researchers).
Additional information
Funding
References
- Williams B, Mancia G, Spiering W, et al. 2018 ESC/ESH guidelines for the management of arterial hypertension. Eur Heart J. 2018;39(33):1–11.
- Neal B, Wu Y, Feng X, et al. Effect of salt substitution on cardiovascular events and death. N Engl J Med. 2021;385(12):1067–1077.
- Powles J, Fahimi S, Micha R, et al. Global, regional and national sodium intakes in 1990 and 2010: a systematic analysis of 24 h urinary sodium excretion and dietary surveys worldwide. BMJ Open. 2013;3(12):e003733.
- World Health Organization. Guideline: Sodium intake for adults and children. Geneva: World Health Organization. 2012.
- Intersalt Cooperative Research Group. Intersalt: an international study of electrolyte excretion and blood pressure. Results for 24 hour urinary sodium and potassium excretion. Br Med J. 1988;297:319–328.
- O’Donnell M, et al. Urinary sodium and potassium excretion, mortality, and cardiovascular events. N Engl J Med. 2014;371:612–623.
- O’Donnell M, et al. Joint association of urinary sodium and potassium excretion with cardiovascular events and mortality: prospective cohort study. BMJ. 2019;364:l772.
- Mente A, O’Donnell MJ, Rangarajan S, et al. Association of urinary sodium and potassium excretion with blood pressure. N Engl J Med. 2014;371(7):601–611.
- Yuan C, Spiegelman D, Rimm EB, et al. Relative validity of nutrient intakes assessed by questionnaire, 24-hour recalls, and diet records as compared with urinary recovery and plasma concentration biomarkers: findings for women. Am J Epidemiol. 2018;187(5):1051–1063.
- Zheng P-F, Shu L, Zhang X-Y, et al. Association between dietary patterns and the risk of hypertension among Chinese: a cross-sectional study. Nutrients. 2016;8(4):239.
- Huang L, Crino M, Wu JHY, et al. Mean population salt intake estimated from 24-h urine samples and spot urine samples: a systematic review and meta-analysis™. Int J Epidemiol. 2016;45(1):239–250.
- Niiranen TJ, Hänninen MR, Johansson J, et al. Home-measured blood pressure is a stronger predictor of cardiovascular risk than office blood pressure: the finn-home study. Hypertension. 2010;55(6):1346–1351.
- Heistaro S. Methodology report: Health 2000 Survey. Helsinki: Publications of the National Public Health Institute; 2008. Available from: https://www.julkari.fi/handle/10024/78185
- Lundqvist A, Mäki-Opas T Health 2011 Survey – Methods. Helsinki: The National Institute for Health and Welfare; 2016. Available from: https://www.julkari.fi/handle/10024/130780
- Bortolotto LA, Henry O, Hanon O, et al. Validation of two devices for self-measurement of blood pressure by elderly patients according to the revised British hypertension society protocol: the omron HEM-722C and HEM-735C. Blood Press Monit. 1999;4(1):21–25.
- Topouchian J, et al. Validation of four automatic devices for self-measurement of blood pressure according to the international protocol of the European society of hypertension. Vasc. Health Risk Manag. 2011;7:709–717.
- Paalanen L, Männistö S, Virtanen MJ, et al. Validity of a food frequency questionnaire varied by age and body mass index. J Clin Epidemiol. 2006;59(9):994–1001.
- Reinivuo H, Hirvonen T, Ovaskainen ML, et al. Dietary survey methodology of FINDIET 2007 with a risk assessment perspective. Public Health Nutr. 2010;13(6A):915–919.
- Zhou L, Stamler J, Chan Q, et al. Salt intake and prevalence of overweight/obesity in Japan, China, the United Kingdom, and the United States: the INTERMAP study. Am J Clin Nutr. 2019;110(1):34–40.
- Jackson SL, Cogswell ME, Zhao L, et al. Association between urinary sodium and potassium excretion and blood pressure among adults in the United States national health and nutrition examination survey, 2014. Circulation. 2018;137(3):237–246.
- Li Y, Zhang P, Wu J, et al. Twenty-four-hour urinary sodium and potassium excretion and their associations with blood pressure among adults in China: baseline survey of action on salt China. Hypertension. 2020;76(5):1580–1588.
- Du X, et al. Association between 24-h urinary sodium and potassium excretion and blood pressure among Chinese adults aged 18–69 years. Sci. Reports. 2021;111 11:1–11. 2021).
- Umesawa M, et al. The relationship between sodium concentrations in spot urine and blood pressure increases: a prospective study of Japanese general population: the circulatory risk in communities study (CIRCS). BMC Cardiovasc. Disord. 2016;16:55.
- Thi Minh Nguyen T, Miura K, Tanaka-Mizuno S, et al. Association of blood pressure with estimates of 24-h urinary sodium and potassium excretion from repeated single-spot urine samples. Hypertens Res. 2019;42(3):411–418.
- Naser AM, He FJ, Rahman M, et al. Spot urine formulas to estimate 24-hour urinary sodium excretion alter the dietary sodium and blood pressure relationship. Hypertension. 2021;77(6):2127–2137.
- Sacks FM, Svetkey LP, Vollmer WM, et al. Effects on blood pressure of reduced dietary sodium and the dietary approaches to stop hypertension (DASH) diet. DASH-sodium collaborative research group. N Engl J Med. 2001;344(1):3–10. J. Med.
- Filippini T, Malavolti M, Whelton PK, et al. Blood pressure effects of sodium reduction: dose-response meta-analysis of experimental studies. Circulation. 2021;143(16):1542–1567.
- Reinivuo H, Valsta LM, Laatikainen T, et al. Sodium in the Finnish diet: II trends in dietary sodium intake and comparison between intake and 24-h excretion of sodium. Eur J Clin Nutr. 2006;60(10):1160–1167.
- Mattson DL. Immune mechanisms of salt-sensitive hypertension and renal end-organ damage. Nat Rev Nephrol. 2019;15(5):290–300.
- Männistö S, Virtanen M, Mikkonen T, et al. Reproducibility and validity of a food frequency questionnaire in a case-control study on breast cancer. J Clin Epidemiol. 1996;49(4):401–409.
- Kaartinen NE, Tapanainen H, Valsta LM, et al. Relative validity of a FFQ in measuring carbohydrate fractions, dietary glycaemic index and load: exploring the effects of subject characteristics. Br J Nutr. 2012;107(9):1367–1375.
- Pietinen P, Hartman AM, Haapa E, et al. Reproducibility and validity of dietary assessment instruments. I. A self-administered food use questionnaire with a portion size picture booklet. Am J Epidemiol. 1988;128(3):655–666.
- Willett WC, Sampson L, Stampfer MJ, et al. Reproducibility and validity of a semiquantitative food frequency questionnaire. Am J Epidemiol. 1985;122(1):51–65.
- Kaartinen NE, et al. Changes in food consumption and nutrient intake in Finnish adults 1997–2017: the national FinDiet survey (In Finnish; Abstract in English). Finnish Med. J. 2021;76:273–280.
- He FJ, MacGregor GA. Role of salt intake in prevention of cardiovascular disease: controversies and challenges. Nat Rev Cardiol. 2018;15(6):371–377.
- Heeney ND, Lee RH, Hockin BCD, et al. At-home determination of 24-h urine sodium excretion: validation of chloride test strips and multiple spot samples. Auton Neurosci. 2021;233:102797.
- Lerchl K, Rakova N, Dahlmann A, et al. Agreement between 24-hour salt ingestion and sodium excretion in a controlled environment. Hypertension. 2015;66(4):850–857.
- Rakova N, Jüttner K, Dahlmann A, et al. Long-term space flight simulation reveals infradian rhythmicity in human Na(+) balance. Cell Metab. 2013;17(1):125–131.