
 ?Mathematical formulae have been encoded as MathML and are displayed in this HTML version using MathJax in order to improve their display. Uncheck the box to turn MathJax off. This feature requires Javascript. Click on a formula to zoom.
Abstract
Purpose
The Major Depression Inventory (MDI) is a widely used self-rating depression scale commonly in primary care in Denmark. It has not been subject to robust psychometric validation in a general population setting. The aim of this study was to evaluate the psychometric measurement properties of the MDI when applied in the general population.
Methods
We evaluated statistical psychometric validity using modern test theory (confirmatory factor analysis, item response theory models and Rasch measurement theory) testing local independence and differential item function across groups defined by gender, age, education, and chronic disease status. Separate analyses across different strata and across different statistical models were employed.
Results
Regarding structural validity we consistently identified local dependence for the item two pairs (MDI2,MDI3) and (MDI4,MDI5) across strata. This result was confirmed by bifactor CFA models and item screening. We further identified substantial differential item functioning with respect to age group and with respect to chronic disease. We identified quantified the magnitude of this lack of measurement invariance.
Conclusion
The MDI is psychometrically valid in homogenous sub populations, but the disclosed evidence of local dependence means that published estimates of its reliability cannot be trusted. The lack of measurement invariance means that the instrument cannot be used to compare individuals or groups unless they are similar in terms of age group and chronic disease status.
1 Introduction
During the past two to three decades, Patient Reported Outcome Measures (PROMs) have been widely accepted as important patient-relevant outcomes in the field of health research. In some medical specialties, PROMs are even essential outcomes, e.g. orthopaedics, psychiatry, general practice and public health [Citation1–3]. In these specialties death of specific causes or death of all causes are seldom sufficient to cover all relevant outcomes in intervention studies, prognostic studies or cross sectional studies. This is because outcomes like patients’ somatic and mental health are maybe a more relevant target for an intervention or just as important as death. Patients’ somatic and mental health are often measured as e.g. level of daily activity, functionality, impairment, illness, mental status and quality of life. However, such constructs are not always easily measured compared to for example numbers of diagnoses and mortality. This means that the question about the validity of PROMs must be addressed: does the PROM actually measure what it claims to measure?
To answer questions about a PROM’s measurement adequacy several measurement properties can be explored with validity as the first and most important area of exploration. Validity is the extent to which the MDI measures depression. Our focus is on statistical validity, operationalized as evaluation of fit of psychometric models, but theoretically several types of validity that address different aspects exist. These include: (i) content validity: the extent to which the content of the MDI represents the entire domain it purports to measure, (ii) criterion validity: the extent to which the MDI is associated with or predicts external criterion variable, (iii) construct validity: the degree to which the MDI measures an abstract trait or construct (e.g. intelligence, motivation) that cannot be directly observed. For a more thorough discussion see [Citation4]. Content validity is the most important measurement property because items need to be relevant, and comprehensible with respect to the construct of interest in the target population. The statistical validity tested here, does not test if the items, but rather study if the scoring algorithm is reasonable. If the MDI is construct valid, but the score does not adequately reflect the state of respondents [Citation5] this will be manifested as misfit or the disclosure of statistical anomalies in the validation.
Most PROM’s encompass one or more scales or domains that are operationalized using scalar-valued scores corresponding to implicit assumptions of unidimensionality. These should be tested using modern test theory (MTT) models like confirmatory factor analysis (CFA; [Citation6]), item response theory (IRT; [Citation7]), or Rasch measurement theory (RMT; [Citation8]). A related concept is the absence of local dependence (LD; [Citation9]). This is the assumption that observed items are conditionally independent given the value of the underlying latent variable, and is an underlying assumption in all MTT models. It means that the latent variable explains why the observed items are related to one another. However, this assumption is not always met in PROM data and for this reason it must be tested as part of a psychometric validation. Finally, items in a scale might possess differential item function (DIF; [Citation10]) if they do not function equally in different groups (e.g. across gender, age group, disease status etc.). It is a necessary part of psychometric validation to test measurement invariance across, e.g. gender groups or age groups.
The Major Depression Inventory (MDI) is a self-rating depression scale commonly used in primary care in Denmark. It was developed in the late 1990s to detect major depression [Citation11]. It has been used in a clinical setting as a diagnostic tool and as an outcomes measure in research projects [Citation12] and has been validated against other instruments [Citation13–16] and in different patient groups [Citation11,Citation17,Citation18] by item response theory analyses on a variety of patients [Citation16,Citation19–21]. Studies of general population data using the MDI exist [Citation22–27], but only the two most recent of these ([Citation26, Citation27]) address psychometric validation using state-of-the-art methodology.
The MDI encompasses 12 items with six response categories scored 0–1–2–3–4–5 (cf. ), using an ordinal response format based on adjectives.
Figure 1. The items in the MDI.
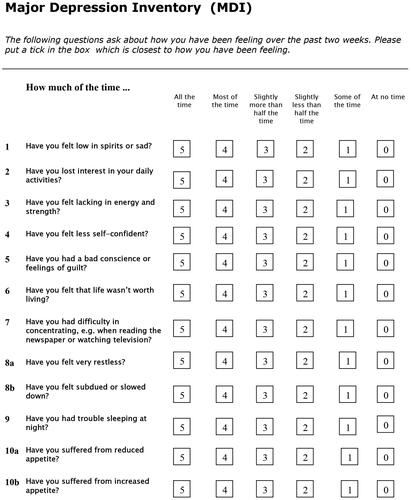
For the item pair 8a (Have you felt very restless?) and 8b (Have you felt subdued or slowed down?) only the highest response is used. The same is true for the item pair 10a and 10b where items address reduced and increased appetite, respectively. The items are based on the ICD-10 diagnostic criteria for depressive disorder [Citation28]. This guarantees content validity. The scoring is a straightforward procedure where, after exclusion of the lowest score on the item pair addressing increased/decreased restlessness and on the item pair addressing increased/decreased appetite, the total sum score ranges from zero to 50. Values below 20 is interpreted as though depression does not exist or that its existence is doubtful, values from 21–25 indicate mild depression symptoms, 26–30 moderate symptoms of depression, and 31–50 indicates severe symptoms of depression [Citation14]. The instrument is designed in such a way that it can also be applied diagnostically by assessing the number of core and accompanying symptoms present. This is according to ICD-10 and DSM-IV. Diagnosis of depression cannot be made from a sum score of MDI (or any other PROM).
Two language versions of the instrument have been psychometrically validated in small patient samples [Citation29,Citation30], and one in a population with participants aged 13–24 years in rural Kenya [Citation25]. An analysis using RMT in 263 females diagnosed with chronic widespread pain and referred for rehabilitation revealed problems with the rating scale properties of the MDI [Citation20]. In a general practice setting the MDI was appropriate, but problems with misfit (items 9 (sleep) and 10 (appetite)) were disclosed [Citation16,Citation21], and a need for changing the item scoring identified [Citation21,Citation27]. Beyond validation of psychometric validity this may also be important in capturing atypical depression [Citation12]. Authors did not recommend using the MDI scores for screenings purposes, but recommended a diagnostic approach counting core and accompanying symptoms. An earlier study in population data used Mokken analysis to evaluate the MDI [Citation24]. The reported Mokken analysis did not evaluate DIF and local response dependence.
The Danish version of the MDI has not been subject to robust psychometric validation in a general population setting. Therefore, the aim of this study was to evaluate the psychometric measurement properties of the MDI when applied in the general population.
Methods
The Lolland-Falster Health Study (LOFUS) is a population survey conducted in a socioeconomically deprived area of Denmark, 1-2 h drive south of the capital Copenhagen, in the municipalities of Lolland and Guldborgsund [Citation31]. In the national ranking of all 98 municipalities these two were ranked the most deprived and the 6th most deprived municipalities in 2020 [Citation32]. In the LOFUS questionnaire all participants aged 18 or older were asked to complete the MDI.
Educational attainment was measured and classified as the following: no post-secondary education if the respondent did not complete any post-secondary education; 1–3 years post-secondary education for vocational or academy/professional graduates of 1–3 years; 3+ post-secondary education for baccalaureate matriculants who completed 3–4 years; and academic for those who completed graduate study of 5 years. Regarding self-reported chronic disease status we classified respondents based their response to the item ‘Do you have any prolonged illness, prolonged aftereffect after injury, handicap or other long-term health-related problem? Long-term means at least six months.’
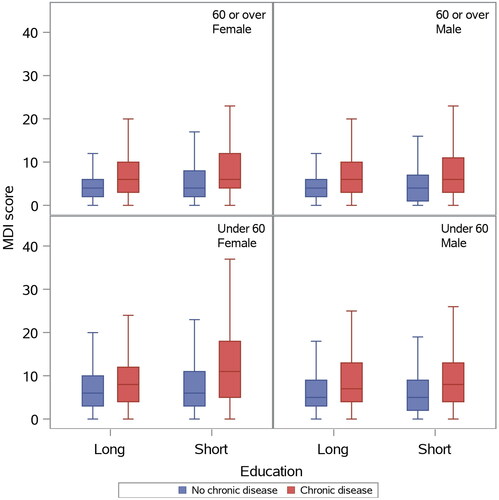
We stratified the respondents according to the four variables gender, age group (below 60; 60 or over), education group (short education; long education), and chronic disease (yes; no) yielding a total of strata. From each of these strata we sampled 200 respondents using simple random sampling.
We evaluated structural validity in each of these 16 homogeneous sub samples we performed a psychometric evaluation using MTT (CFA, IRT and RMT) following the recommendations in [Citation33–36]. Model fit was evaluated for CFA models without LD and for bifactor CFA model incorporating LD. Bifactor models were based on modification indices (MI). The derived models were confirmed using IRT (using bifactor graded response models) and RMT (applying graphical Rasch models [Citation37,Citation38]). The latter of these models incorporate local dependence. For this item screening [Citation39] was used.
In the instances where a suitable measurement model could be identified measurement invariance was assessed using multiple groups CFA. We used the approach described by Svetina et al. [Citation40] and evaluated model fit for bifactor CFA models with configural, metric, and scalar invariance. Invariance across gender groups was assessed in the eight strata defined by age group, education group and chronic disease status. Invariance across age groups was assessed in the eight strata defined by gender, education group and chronic disease status. Invariance across education groups was assessed in the eight strata defined by gender, age group and chronic disease status. Invariance across chronic disease status was assessed in the eight strata defined by gender, age group and education.
In a final step graphical Rasch models [Citation37,Citation38] incorporating LD were used to test for DIF and to derive translation tables where evidence of DIF was found. The test for DIF was performed by combining evidence from all the strata. This resulted in a total of 40 statistical tests (10 items and four DIF variables) and P-values were adjusted using the Benjamini-Hochberg [Citation41] correction to keep the false discovery rate at 5%. Furthermore, in interpreting the evidence of DIF we go beyond evaluation of statistical difference and interpret the magnitude of change on the total score resulting from the DIF. This quantifies the total impact on DIF on MDI scores. For reporting we focus on values of the latent variable corresponding to scores 20, 25, and 30, respectively in a reference group.
Results
A total of 44,209 adults (18+) were invited to LOFUS and 16084 of these participated (response rate 36.4%). Additionally, 53 persons invited before they were 18 are included in the final adult sample. Thus 16,137 respondents were eligible and we included 12701 respondents with no missing values in the data relevant to this study. Among men 90.3% had no missing data, while for women 91.6% had no missing data. This constituted a statistically significant difference of 1.4 (95% CI: 0.5 to 2.2) percentage points. The median age for those with no missing data was 59 (IQR: 48 to 68) years, while the median for those with missing data was 58 (IQR: 36 to 72) years (Kruskal-Wallis P-value < 0.0001). The distribution of the MDI score in the 16 strata is illustrated in .
Figure 2. The distribution of the MDI score in the 16 strata.
(i) structural validity
We evaluated fit of a CFA model (, panel (a)) and found that model fit was rejected in 15 of the 16 strata (Supplementary Table 1). In nearly all strata modification indices were high and they consistently identified the item pairs (MDI2, MDI3) (highest MI value in six strata) and (MDI4, MDI5) (highest MI value in three strata). Adding these yielded bifactor CFA models (, panel (b)) with better fit (Supplementary Table 2).
Figure 3. The factor structure of the MDI: (a) CFA model, (b) CFA bifactor model with two bifactors B1 and B2.
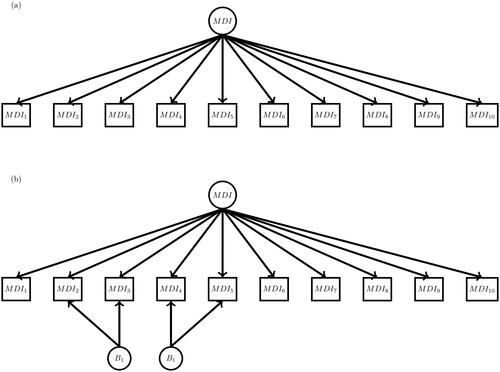
This result was confirmed by item screening where evidence of LD for the item pair (MDI2, MDI3) was found in five strata and evidence of LD for the item pair (MDI4, MDI5) was found in four strata.
(ii) measurement invariance
Measurement invariance across gender groups
was evaluated using multiple groups bifactor CFA models in the eight strata defined by age group, education and chronic disease status. Substantial evidence of lack of measurement invariance was seen (Supplementary Table 3). There was significant evidence of DIF with respect to gender for the items MDI5, MDI8, and MDI9 (). The impact of this DIF was unsubstantial (results not shown).
Table 1. Evidence of differential item functioning. Boldface indicate p-values that are significant after Benjamini-Hochberg correction.
Measurement invariance across age groups
in the eight strata defined by gender, education and chronic disease is reported in Supplementary Table 4. Again evidence of lack of measurement invariance was seen. There was significant evidence of DIF with respect to age group for four items (MDI2, MDI5, MDI6, and MDI9; ). The impact of this DIF was substantial. illustrates that respondents with the same value of depression are assigned quite different MDI scores. For those in the reference group (males with short education, and without chronic disease) the three vertical dashed lines in each of the eight panels indicate latent trait values corresponding to scores of 20, 25, and 30, respectively. In those with values corresponding to a score of 20 those over 60 on average have scores that are 1.1 points lower.
Figure 4. The impact of the differential item functioning with respect to age groups. Dashed horizontal lines indicate expected scores for respondents with the same value of depression.
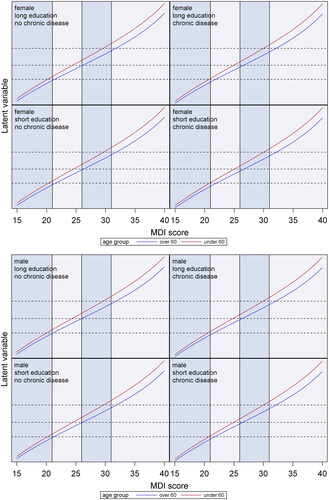
The impact of DIF was larger for values of the latent trait corresponding to a score of 25 in the reference group where those over 60 on average have scores that are 1.7 points lower, while for values of the latent trait corresponding to a score of 30 in the reference group the average difference was 2.1 points.
Measurement invariance across education groups
used strata defined by gender, age group, and chronic disease status. Again evaluation of fit of different multiple groups CFA models indicated lack of measurement invariance (Supplementary Table 5). A single item, MDI9, had DIF with respect to the education group (). The impact of this DIF was unsubstantial (results not shown).
Measurement invariance across chronic disease groups
evaluated the fit different multiple groups bifactor CFA models in the eight strata defined by gender, age group, and education group. Substantial evidence of lack of measurement invariance was seen (Supplementary Table 6). There was significant evidence of DIF with respect to chronic disease group for the items MDI3, MDI5, and MDI9 (). The impact of this DIF was also noticeable. illustrates that respondents with the same value of depression are assigned different MDI scores.
Figure 5. The impact of the differential item functioning with respect to chronic disease groups. Dashed horizontal lines indicate expected scores for respondents with the same value of depression.
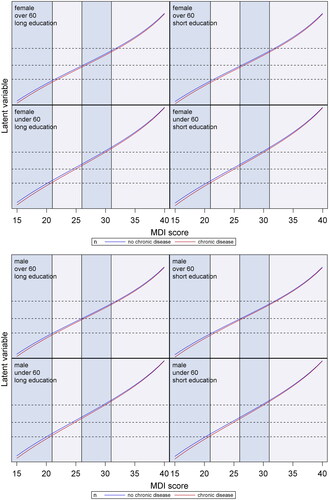
The impact is smaller than for the age group DIF and manifests itself at lower levels of the depression continuum. Here the reference group consists of males with short education under 60) and for values of the latent trait corresponding to scores of 20, 25, and 30, respectively those with chronic disease score 0.6, 0.5 and 0.4 points lower.
Discussion
We evaluated the measurement properties of the MDI using state-of-the-art psychometric validation. Three distinct, but related statistical models (CFA models, IRT models, Rasch models) were applied and yielded very similar results. The statistical psychometric validation showed that the structural validity is sound and this in combination with the fact that the MDI is based on diagnostic criteria for depressive disorder shows that it is a valid measurement instrument. In all 16 strata bifactor CFA models and graphical Rasch models showed good fit after LD was taken into account. The LD disclosed was also found in a recent Danish study using data from general practice [Citation27] and matches items that DSM-IV combine in their criteria and an item that was declassified to accompanying item in ICD-11. Thus, our findings do not necessarily identify problematic items, rather they illustrate difficulties capturing the latent phenomena. However, a consequence of LD is that estimates of reliability cannot be trusted, and thus published estimates of reliability in population studies using the MDI should be interpreted with caution.
As pointed out by Fried and Nesse [Citation5][p. 5] the assumption in psychometric models that there is no LD, i.e. that underlying latent variables fully explain all correlation between manifest indicators is rarely met and ignoring this can substantially bias inferences. The evidence of LD disclosed here confirms this, and the CFA and IRT models that take LD into account illustrate that a (statistically) valid MDI score can still be derived due to the content validity provided that the scoring makes sense. However, the evidence can also be taken to indicate that network analysis, that go beyond the assumption that symptoms are manifestations of a common underlying factor, is more reasonable [Citation42].
An earlier study in population data used Mokken analysis and recommended the use of the MDI in population studies [Citation24]. The reported Mokken analysis completely disregarded the concepts of DIF and local response dependence. Here we disclosed strong evidence of DIF and must conclude that MDI score comparison across age groups should be interpreted with caution. This does not invalidate the use of the MDI per se. MDI scores still yield a valid ranking of people with similar age, and change scores still have an interpretation as change within a person. Furthermore MDI scores for people without chronic disease should not be uncritically be compared to MDI scores for people with one or more chronic diseases. It makes sense that the latter group responds differently to some items, but this does not invalidate the use of MDI scores for within-group ranking or evaluation using change. The impact was noticeable for both variables, but was strongest regarding age group towards the higher end of the depression continuum.
Invariance may occur for a number of reasons. Some items may yield different scores in some groups, e.g. those with chronic disease, for reasons other than depression. Similarly items may be interpreted differently in atypical depression [Citation12]. Thus, when the item content is fixed due to the requirement of content validity some DIF will occur. Here we identified lack of invariance and quantified the magnitude of the total impact on scale scores.
Implication for research
Our results show that MDI is a unidimensional measure in the present LOFUS cohort, where data were collected in a population study. Some will argue that the MDI scoring that generates a single number is inherently invalid, and that single symptoms should be used [Citation5]. Two studies in a Danish working population indicated that single symptoms predict risk of long-term sickness absence among employees who are free of clinical depression, but also that for the MDI score clear dose–response relationship exists with adverse effect of non-clinical depressive symptoms manifesting itself at relatively low scores [Citation43,Citation44]. However, several of the MDI items possess DIF making comparison problematic across different covariates. These non-invariant measurement properties of the MDI must be explored in future studies because DIF can bias comparison between sub-groups especially in non-randomised trials. In future studies using LOFUS MDI data the identified DIF must be taking into account. This can be done by generating translation tables yielding translated scores similar to those reported in and . Researchers using the MDI with other data sources may also want to adjust for this source of bias. It should be noted that, due to the nonlinear nature of the DIF effect, simply adjusting for the effect of age or chronic disease in regression models will not removed the bias.
Implication for practice
Our results reveal that MDI is not invariant across sub-groups and that its reliability might be lower than previous results indicate. Therefore, we encourage to use MDI scores in practice with caution taking into account the measurement problems we have identified.
Methodological limitations
It is a limitation that we did not pursue evaluation of a network method. If single symptoms should be used in place of a scale score [Citation5] cannot be tested, but we have identified strengths and weaknesses associated with using a scale score.
Ethical approval
Region Zealand’s Ethical Committee on Health Research (sJ-421) and the Danish Data protection Agency (REG-24–2015) approved the Lolland-Falster Health Study. All methods were carried out in accordance with relevant guidelines and regulations.
Consent to participate
Informed consent was obtained from all subjects and/or their legal guardian for participation in the LOFUS study.
Consent for publication
Not applicable.
Authors’ contributions
KBC, AP, ES and JBB designed the study. KBC analysed data and drafted the manuscript. AP, ES and JBB contributed to revisions with important intellectual content. All authors take responsibility for the integrity of the data and the accuracy of the data analysis. KBC is guarantor.
Supplemental Material
Download PDF (86.9 KB)Acknowledgements
We thank Randi Jepsen for helpful information about the LOFUS study design.
Disclosure statement
No potential conflict of interest was reported by the author(s).
Code availability
Code available from corresponding author on reasonable request.
Data availability statement
Data are subject to third-party restrictions but is available from corresponding author on reasonable request.
Additional information
Funding
Notes on contributors
Karl Bang Christensen
Karl Bang Christensen, PhD is Professor in Biostatistics at the University of Copenhagen.
Aake Packness
Aake Packness, RN, MPH, MPQM, PhD, is a senior researcher at the Psychiatric Research Unit, Region Zealand. His research focuses on public mental health, mental health services, and common mental disorders, primarily depression.
Erik Simonsen
Erik Simonsen, MD, PhD is Professor of Department of Clinical Medicine, University of Copenhagen, Director of Research Unit, Mental Helath services East, Psychiatry, Region Zealand, Denmark.
John Brodersen
John Brodersen is a GP with over thirty years of clinical experience. He has a PhD in public health and psychometrics and conducts research in prevention, screening, overdiagnosis, overmedicalisation, evidence-based medicine and multi-morbidity at the University of Copenhagen, in Region Zealand, and The Arctic University of Norway in Tromsø.
References
- Smith S, Weldring T. Patient-reported outcomes (pros) and patient-reported outcome measures (proms). Health Serv Insights. 2013;6:61–68. doi: 10.4137/HSI.S11093.
- Krogsgaard MR, Brodersen J, Christensen KB, et al. What is a PROM and why do we need it? Scand J Med Sci Sports. 2021;31(5):967–971. doi: 10.1111/sms.13892.
- Churruca K, Pomare C, Ellis LA, et al. Patient-reported outcome measures (PROMs): a review of generic and condition-specific measures and a discussion of trends and issues. Health Expect. 2021;24(4):1015–1024. doi: 10.1111/hex.13254.
- Newton PE, Shaw SD. Validity in educational & psychological assessment. SAGE Publications Ltd; 2014. doi: 10.4135/9781446288856
- Fried EI, Nesse RM. Depression sum-scores don’t add up: why analyzing specific depression symptoms is essential. BMC Med. 2015;13:72. doi: 10.1186/s12916-015-0325-4.
- Jöreskog KG. A general approach to confirmatory maximum likelihood factor analysis. Psychometrika. 1969;34(2):183–202. doi: 10.1007/BF02289343.
- Linden WJ, Hambleton RK, (eds.). Handbook of modern item response theory. New York: Springer Verlag; 1997. doi: 10.1007/978-1-4757-2691-6.
- Christensen K., Kreiner S, Mesbah M, (eds.). Rasch models in health. Hoboken, NJ: John Wiley & Sons, Inc.; 2012. doi: 10.1002/9781118574454.
- Lazarsfeld P. Latent structure analysis. Houghton, Mifflin: New York; 1968)
- Holland PW, Wainer H, (eds.). Differential item functioning. Hillsdale, New Jersey: Lawrence Erlbaum Associates, Inc.; 1993. doi: 10.4324/9780203357811.
- Bech P, Wermuth L. Applicability and validity of the major depression inventory in patients with parkinson’s disease. Nordic J Psychiatr. 1998;52(4):305–310. doi: 10.1080/08039489850149741.
- Bech P, Christensen EM, Vinberg M, et al. The performance of the revised major depression inventory for self-reported severity of depression - implications for the DSM-5 and ICD-11. Psychother Psychosom. 2013;82(3):187–188. doi: 10.1159/000346456.
- Bech P, Rasmussen N-A, Olsen LR, et al. The sensitivity and specificity of the major depression inventory, using the present state examination as the index of diagnostic validity. J Affect Disord. 2001;66(2–3):159–164. doi: 10.1016/S0165-0327(00)00309-8.
- Bech P, Timmerby N, Martiny K, et al. Psychometric evaluation of the major depression inventory (MDI) as depression severity scale using the LEAD (longitudinal expert assessment of all data) as index of validity. BMC Psychiatry. 2015;15(1):190. doi: 10.1186/s12888-015-0529-3.
- Olsen LR, Jensen DV, Noerholm V, et al. The internal and external validity of the major depression inventory in measuring severity of depressive states. Psychol Med. 2003;33(2):351–356. doi: 10.1017/S0033291702006724.
- Nielsen MG, Ørnbøl E, Vestergaard M, et al. The construct validity of the major depression inventory: a Rasch analysis of a self-rating scale in primary care. J Psychosom Res. 2017;97:70–81. doi: 10.1016/j.jpsychores.2017.04.001.
- Cuijpers P, Dekker J, Noteboom A, et al. Sensitivity and specificity of the major depression inventory in outpatients. BMC Psychiatry. 2007;7:39. doi: 10.1186/1471-244X-7-39.
- Konstantinidis A, Martiny K, Bech P, et al. A comparison of the major depression inventory (MDI) and the beck depression inventory (BDI) in severely depressed patients. Int J Psychiatry Clin Pract. 2010;15(1):56–61. doi: 10.3109/13651501.2010.507870.
- Hovaldt HB, Nielsen T, Dammeyer J. Validity and reliability of the major depression inventory for persons with dual sensory loss. Innov Aging. 2018;2(1):igy010. doi: 10.1093/geroni/igy010.
- Amris K, Omerovic E, Danneskiold-Samsøe B, et al. The validity of self-rating depression scales in patients with chronic widespread pain: a Rasch analysis of the major depression inventory. Scand J Rheumatol. 2016;45(3):236–246. doi: 10.3109/03009742.2015.1067712.
- Christensen KS, Oernboel E, Nielsen MG, et al. Diagnosing depression in primary care: a rasch analysis of the major depression inventory. Scand J Prim Health Care. 2019;37(2):256–263. doi: 10.1080/02813432.2019.1608039.
- Olsen LR, Mortensen EL, Bech P. Prevalence of major depression and stress indicators in the Danish general population. Acta Psychiatr Scand. 2004;109(2):96–103. doi: 10.1046/j.0001-690x.2003.00231.x.
- Thorsen SV, Rugulies R, Hjarsbech PU, et al. The predictive value of mental health for long-term sickness absence: the major depression inventory (MDI) and the mental health inventory (MHI-5) compared. BMC Med Res Methodol. 2013;13, 1-7. doi: 10.1186/1471-2288-13-115.
- Ellervik C, Kvetny J, Christensen KS, et al. Prevalence of depression, quality of life and antidepressant treatment in the Danish general suburban population study. Nord J Psychiatry. 2014;68(7):507–512. doi: 10.3109/08039488.2013.877074.
- Otiende M, Abubakar A, Mochamah G, et al. Psychometric evaluation of the major depression inventory among young people living in coastal Kenya. Wellcome Open Res. 2017;2:113. doi: 10.12688/wellcomeopenres.12620.1.
- Lundin A, Möller J, Forsell Y. The major depression inventory for diagnosing according to DSM-5 and ICD-11: psychometric properties and validity in a Swedish general population. Int J Methods Psychiatr Res. 2023;32(4):e1966. doi: 10.1002/mpr.1966.
- Pedersen HS, Christensen KB, Prior A, et al. A comparison of the original major depression inventory with a modified version: a ¡scp¿danish¡/scp¿ validation study. Acta Psychiatr Scand. 2024;149(3):267–278. doi: 10.1111/acps.13656.
- The ICD-10 Classification of Mental and Behavioural Disorders: Diagnostic Criteria for Research. 1993. Geneva: World Health Organization.
- Fountoulakis K, Iacovides A, Kleanthous S, et al. Reliability, validity and psychometric properties of the Greek translation of the major depression inventory. BMC Psychiatry. 2003;3:2. doi: 10.1186/1471-244X-3-2.
- Fawzi MH, Fawzi MM, Abu-Hindi W. Arabic version of the major depression inventory as a diagnostic tool: reliability and concurrent and discriminant validity. East Mediterr Health J. 2012;18(4):304–310. doi: 10.26719/2012.18.4.304.
- Jepsen R, Egholm CL, Brodersen J, et al. Lolland-falster health study: study protocol for a household-based prospective cohort study. Scand J Public Health. 2018;48(4):382–390. doi: 10.1177/1403494818799613.
- Ministry of Economics- and Interior. Key figures of municipalities [Public Database]. Økonomi- og Indenrigsministeriet. www.noegletal.dk. Accessed: 2018-02-20
- Nilsson L, Tennant A. Past and present issues in Rasch analysis: the functional independence measure (fimTM) revisited. J Rehabil Med. 2011;43(10):884–891. doi: 10.2340/16501977-0871.
- Tennant A, Conaghan PG. The rasch measurement model in rheumatology: what is it and why use it? when should it be applied, and what should one look for in a rasch paper? Arthritis Rheum. 2007;57(8):1358–1362. doi: 10.1002/art.23108.
- Pallant JF, Tennant A. An introduction to the rasch measurement model: an example using the hospital anxiety and depression scale (hads). Br J Clin Psychol. 2007;46(Pt 1):1–18. doi: 10.1348/014466506X96931.
- Christensen K, Comins JD, Krogsgaard MR, et al. Psychometric validation of PROM instruments. Scand J Med Sci Sports. 2021;31(6):1225–1238. doi: 10.1111/sms.13908.
- Kreiner S, Christensen KB. Graphical rasch models. In: Mesbah, M., Cole, F.C., Lee, M.T. editors. Statistical methods for quality of life studies. Boston, MA: Springer; 2002 p 187–203. doi: 10.1007/978-1-4757-3625-0_15.
- Kreiner S, Christensen KB. Validity and objectivity in health-related scales: analysis by graphical loglinear Rasch models. In: von Davier, M., Carstensen, C.H. editors. Multivariate and mixture distribution Rasch models. New York, NY: Springer; 2007. p 329–346. doi: 10.1007/978-0-387-49839-3_21.
- Kreiner S, Christensen KB. Item screening in graphical loglinear Rasch models. Psychometrika. 2011;76(2):228–256. doi: 10.1007/s11336-011-9203-y.
- Svetina D, Rutkowski L, Rutkowski D. Multiple-group invariance with categorical outcomes using updated guidelines: an illustration using M plus and the lavaan/semTools packages. Struct Equ Modeling: A Multidiscip J. 2020;27(1):111–130. doi: 10.1080/10705511.2019.1602776.
- Benjamini Y, Hochberg Y. Controlling the false discovery rate: a practical and powerful approach to multiple testing. J R Stat Soc. Series B Methodol. 1995;57(1):289–300. doi: 10.2307/2346101.
- Borsboom D, Cramer AOJ. Network analysis: an integrative approach to the structure of psychopathology. Annu Rev Clin Psychol. 2013;9(1):91–121. doi: 10.1146/annurev-clinpsy-050212-185608.
- Hjarsbech PU, Andersen RV, Christensen KB, et al. Clinical and non-clinical depressive symptoms and risk of long-term sickness absence among female employees in the Danish eldercare sector. J Affect Disord. 2011;129(1-3):87–93. doi: 10.1016/j.jad.2010.07.033.
- Rugulies R, Hjarsbech PU, Aust B, et al. To what extent do single symptoms from a depression rating scale predict risk of long-term sickness absence among employees who are free of clinical depression? Int Arch Occup Environ Health. 2012;86(7):735–739. doi: 10.1007/s00420-012-0797-x.