
ABSTRACT
Urban liveability is a global priority for creating healthy, sustainable cities. Measurement of policy-relevant spatial indicators of the built and natural environment supports city planning at all levels of government. Analysis of their spatial distribution within cities, and impacts on individuals and communities, is crucial to ensure planning decisions are effective and equitable. This paper outlines challenges and lessons from a 5-year collaborative research program, scaling up a software workflow for calculating a composite indicator of urban liveability for residential address points across Melbourne, to Australia’s 21 largest cities, and further extension to 25 global cities in diverse contexts.
摘要
城市宜居性是创建健康、可持续城市的全球优先事项。对建筑和自然环境的政策相关空间指标的测量支持各级政府的城市规划。分析它们在城市中的空间分布,以及对个人和社区的影响,对于确保规划决策的有效性和公平性至关重要。本文概述了一个为期5年的合作研究项目所面临的挑战和经验教训,该项目将计算墨尔本住宅地址点的城市宜居性综合指标的软件工作流程扩大到澳大利亚21个最大的城市,并进一步扩展到25个不同背景的全球城市。
1. Introduction
Urban liveability is a global priority, underpinning the creation of healthy, sustainable cities (United Nations Citation2016). Considered through the lens of the United Nations Sustainable Development Goals (SDGs; United Nations Citation2015) the concept broadly reflects an aspiration for cities to be “inclusive, safe, resilient and sustainable” (SDG 11) such that they promote “healthy lives and well-being for all at all ages” (SDG 3). Effective city planning relies on measurable policy targets; moreover, measurement of policy-relevant spatial indicators of the built and natural environment supports integrated city planning at local, state and federal levels of government (Giles-Corti et al. Citation2020). Analysis of the spatial distribution of indicators within cities, and their impacts on the health and wellbeing of individuals and communities, can help ensure planning decisions are effective and equitable (Badland and Pearce Citation2019).
Concern for liveability in the context of urban planning is not new (Storer Citation1870). However, its growth in the context of planning and policy through the course of the twentieth century has been well documented (; Woolcock Citation2009, Casey Citation2011, Kaal Citation2011, Lowe et al. Citation2013, Ruth and Franklin Citation2014), and reflects the confluence of two concurrent, global trends: increasing urbanisation, and a shift towards lifestyle factors such as diet and physical activity as the major contributors to burden of disease (Omran Citation1971, Murray and Lopez Citation1997, Mathers et al. Citation2001, de Hollander and Staatsen Citation2003, Stanaway et al. Citation2018, AIHW Citation2019). In the twenty-first century, the need for liveable cities has been underscored by increased awareness of existential ecosystem challenges posed by rapid population growth and climate change (McPhearson et al. Citation2021, Clark et al. Citation2020). Indicators of subjective and objective well-being and quality of living (Pacione Citation1982, Pacione Citation1990, UNDP Citation1990, Davern et al. Citation2008) have long been used to inform policy and legislation through the provision of evidence of health and wellbeing impacts. Spatial indicators of urban liveability aim to measure the impact of and inform planning decisions, and can be used to estimate downstream social, economic and health impacts (Giles-Corti et al. Citation2016). There exist a number of liveability indicator and composite indicator frameworks designed for use in diverse contexts which are essentially non-spatial, calculated as summary statistics for entire cities or other large urban regions (Valcárcel-Aguiar and Murias Citation2019, Economist Intelligence Unit Citation2021, Government of India Citation2016). Other authors have developed spatial liveability or sustainability indicator frameworks in different settings previously (Harrell Citation2017, Martino et al. Citation2021, Chi and Mak Citation2021, Gómez-Varo et al. Citation2022). In general, though, the existing frameworks for policy-relevant spatial urban indicators of liveability have limited scope for reproducibility, replicability and generalisability. This is due to the lack of publication of clear methods or open release of code or software supporting their usage, the reliance on commercially licenced data or data that otherwise may not be generally available in other global contexts, and the over-reliance on standardisation based on cross-sectional observations that impede the core objective of indicators for monitoring progress across time.
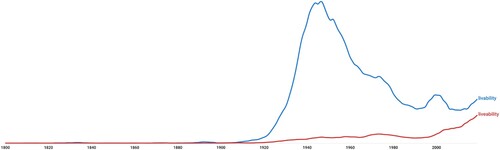
Figure 1. A Google Ngram of known occurrences of “livability” or “liveability” from 1800 to 2019 provides a crude if illustrative sketch of the increase in circulation of the term; as spelt in Australia its frequency of usage appears to have been more or less increasing in the last two decades. https://books.google.com/ngrams/graph?content=livability%2C+liveability&year_start=1800&year_end=2019&corpus=26&smoothing=3
This paper presents the challenges, lessons, and outputs from the scaling up of a 5-year collaborative research program for the calculation of policy-relevant, evidence-based spatial indicators of urban liveability with outputs designed to be used by urban planners, policy makers and researchers in diverse contexts. Lessons learned from these experiences can be used to further strengthen the evidence and tools used by urban planners, policy makers and researchers for creating healthy, sustainable cities.
2. Developing a Composite Indicator of Urban Liveability
The Urban Liveability Index (2016–2021; Higgs et al. Citation2019) was developed as a policy-relevant composite indicator of urban liveability calculated for residential parcels, allowing for flexible aggregation and supporting comparisons both within- and between-cities. Underpinned by a detailed socio-ecological model of associations between the built environment and health and wellbeing, the index was founded on a definition of a liveable community as being:
… safe, attractive, socially cohesive and inclusive, and environmentally sustainable; with affordable and diverse housing linked to employment, education, public open space, local shops, health and community services, and leisure and cultural opportunities; via convenient public transport, walking and cycling infrastructure. [Citation2013]
An initial workflow to calculate address-level liveability measures was developed through a pilot project (Higgs et al. Citation2018, Davern et al. Citation2018, Higgs et al. Citation2019, Higgs et al. Citation2021). Focused on Melbourne, a city on Australia’s south-eastern coast experiencing rapid and sprawling population growth (Foster et al. Citation2013, State of Victoria DELWP Citation2017), this workflow was later extended to capital and regional cities, towns and local government areas around Australia (the Australian National Liveability Study, 2016–2021; Arundel et al. Citation2017, Davern et al. Citation2019a, Davern et al. Citation2019b, Davern et al. Citation2019c, Davern et al. Citation2020, Lowe et al. Citation2020), and to 25 cities located in diverse international contexts across two distinct projects (Bangkok Liveability, 2018–2021, Alderton et al. Citation2020; Global Healthy and Sustainable City-Indicators Collaboration study, 2018–2022, Liu et al. Citation2021, Boeing et al. Citation2022).
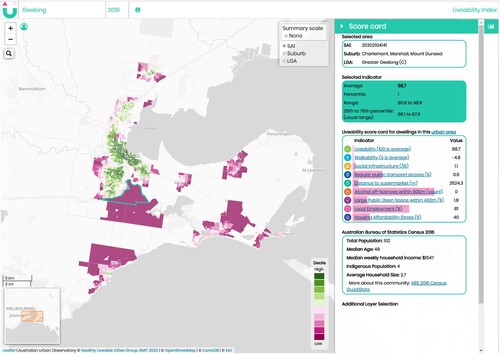
illustrates the generic urban liveability indicator workflow, which enables flexible and reproducible production of liveability indicators for different cities, at different times, given available data, and with outputs tailored for the needs of distinct stakeholders. The results informed scorecard reports of urban liveability (Gunn et al. Citation2020a, Salvo et al. Citation2022), interactive indicator map portals (Alderton et al. Citation2020, Davern et al. Citation2020), analysis of behavioural and health outcomes (Villanueva et al. Citation2022, Fortune et al. Citation2020a, Fortune et al. Citation2020b, Foster et al. Citation2019, VicHealth Citation2020), and amenity provision in new urban developments (Gunn et al. Citation2020b). Open source software was developed to support spatial analysis of urban liveability for cities in diverse contexts using open and custom data (Liu et al. Citation2021, Boeing et al. Citation2022). provides an example of the spatial distribution of liveability for Geelong, and a score card report of indicator estimates for a particular statistical area on the urban fringe.
Figure 2. Process model for a scripted workflow for calculation, validation, analysis, and dissemination of spatial urban indicators. Human icons in the boxes indicate steps requiring researchers to undertake configuration of project and study region parameters including definition of required indicators and measures, sourcing valid data, and data checking in coordination with local and domain experts. This process may be adapted for production of specific indicators or measures across a broad range of contexts given available data.
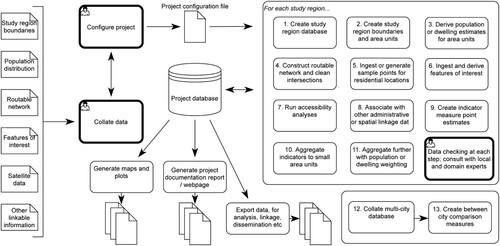
Figure 3. A liveability score card report for a particular Statistical Area 1 region in Geelong sourced from the RMIT Australian Urban Observatory (https://auo.org.au) in 2020.
3. Study Planning: Definitions and Data Sourcing
Measuring and evaluating spatial indicators across cities and over time requires detailed, comparable data, and clear, consistent study region definitions. However, data are more likely to be available, accurate, and complete in higher populated urban areas of high-income countries (Taylor et al. Citation2018). Measuring liveability indicators is particularly challenging in peri-urban areas with dynamic growth, and in lower-income settings, with an increased risk of data being inaccurate, incomplete or unavailable (Johnson et al. Citation2016, Fonte et al. Citation2017). To support comparisons between cities we sourced established urban boundaries; for example, using data from the Australian Bureau of Statistics (ABS Citation2017) or the Global Human Settlements Urban Centres Database (Florczyk et al. Citation2019). We used OpenStreetMap to determine residential access to specific services and amenities for multi-city studies, where sourcing consistent and complete data was otherwise challenging. OpenStreetMap is a community contributed open map database, that provides a valuable longitudinal resource of built and natural environment data with global scope, ostensibly up-to-date, and coded according to consistent and transparent guidelines (OpenStreetMap contributors Citation2021).
OpenStreetMap has some advantages to routinely collected official data, in that new developments and pedestrian paths may be better represented (Barrington-Leigh and Millard-Ball Citation2017, Boeing Citation2017). Collated from user contributions, and with regular archival of the “planet” database back to 2006, OpenStreetMap provides opportunities for longitudinal study of built environment data. OpenStreetMap is also readily accessible, allowing for multiple ways of retrieving and working with the data depending on need: for example, planet archives, regional excerpts, or the Overpass API for retrieval of the current state. Consideration should be given when using OpenStreetMap data in a study to the methods used to retrieve data to ensure reproducibility of the results of a particular analysis; for example, if the Overpass API is used to retrieve OSM features for a particular analysis, the analysis may not be readily reproducible without the sourcing of a matching planet archive, requiring care to be taken to record the exact time and date of the “current state” data retrieval. For this reason, working with archive data from specific fixed time points is recommended. The degree of uptake of OpenStreetMap by mappers in the region of interest for the features of interest being studied should also be verified. For example, by working with local collaborators in the Global Healthy and Sustainable City-Indicators Collaboration study (Boeing et al. Citation2022) we were able to confirm that although street network infrastructure was adequately represented, a range of local amenities and services were not. Hence, we ensured our framework was able to function by using custom prepared data, which we were able to source from our collaborators as an alternative to OpenStreetMap (Liu et al. Citation2021). The sourcing of custom data for such projects may present opportunities for building on identified gaps through contribution back into OpenStreetMap.
With any data source, care must be taken to consider positional, temporal and semantic accuracy of features of interest, as well as, completeness of study region coverage (Guptill et al. Citation1995, Zhang and Pfoser Citation2019). Seeking advice from experts on specific subject matter, local contexts and cultural nuances is essential to ensure the validity of representation (Liu et al. Citation2021).
4. Scale and Units of Analysis
The ability to produce indicators at multiple scales of aggregation for analysis, visualisation and linkage according to the needs of different stakeholders and projects requires high-resolution measurement of built environment exposures. Providing this level of flexibility can guard against issues such as the modifiable areal unit problem, and allow for sensitivity analyses to investigate the influence of choice of scale on estimates modelled using indicator data (Higgs et al. Citation2019, O’Sullivan and Unwin Citation2010). Through the Australian National Liveability Study, we measured local neighbourhood environments using address points in urban residential locations (Arundel et al. Citation2017, Lowe et al. Citation2020). Internationally, where address data were not always available, point locations were identified at regular intervals along a pedestrian accessible street network in populated regions of the city (Alderton et al. Citation2020, Liu et al. Citation2021). These methods served to identify residential locations, for which local neighbourhood environments could be evaluated and aggregated to produce measures for larger geographical areas, in conjunction with additional data on dwelling and population distributions.
The use of small area gridded data, if available and at an appropriate resolution for the analysis being undertaken, is worth considering as an alternative to administrative or statistical area data. The latter can lack a consistent scale and may not well support comparative analysis with different jurisdictions. In contrast, grid cell data, where available, supports aggregation and analysis at a standard, fixed resolution across different study regions. Even within a single study region, using grid cell data ensures consistency of measurement; conversely, using variable scale small statistical area data can disadvantage the representation of areas on the urban fringe. illustrates how aggregation of indicators to the smallest administrative unit for which most census data is publicly realised in Australia (Statistical Area 1) can lack precision for lower population areas outside urban centres.
Various gridded population datasets with global scope across a range of time points are now available, for example, WorldPop (Lloyd et al. Citation2017) or the Global Human Settlements population grids (GHS-POP; Schiavina et al. Citation2019), which we used as a common source of population in our 25 city international study (Liu et al. Citation2021, Boeing et al. Citation2022). Modelled datasets such as these still must be used critically, however, as they depend in part on country specific small area census results and land use analysis of satellite imagery. Modelled results may be more or less accurate for representing specific neighbourhoods at specific points in time. For example, the North Sea port area of Ghent was recorded as having a population, which our local experts advised was misleading; as such, we revised our study region definition to exclude this area to ensure it wasn’t erroneously represented, and therefore, analysed in our study as residential. Notwithstanding such challenges of modelling population levels accurately at high resolution using available data, the increasing availability and release of global high-resolution gridded datasets greatly support large scale comparative analyses, by supporting analysis using consistent spatial units of analysis. Where gridded datasets are available sharing common scales and spatial coordinate references, these further mitigate the risk of spatial misalignment when linking data from different sources.
5. Relative or Absolute Comparisons?
The spatial urban liveability indicator workflow supported large-scale comparative analyses of inequities, within and between cities. The walkability index and urban liveability index composite scores were formulated to yield a performance score – for an address point, or as an area average – relative to the average residential exposure across the study region or regions of interest. There are two important limitations of using relative composite indicators such as these. First, these relative measures cannot be meaningfully calculated for a single, or small clustered collection of address points, as the analyses do not provide a valid average reference value against which to compare. Second, measures subsequently calculated for different study regions and/or time points cannot be meaningfully compared, as they do not share common reference standards. For example, the mapped spatial distribution of a walkability index calculated for residential locations in a regional Australian city – following standardisation of each of the walkability components of dwelling density, street connectivity and walkable access to diverse amenities against the city average – would appear quite different if the standardisation were undertaken relative to locations across Australia 21 largest cities. For the Australian National Liveability Study, walkability and liveability measures were calculated using both methods (relative to the city average, and relative to the national average). However, when the analysis is undertaken for a new time point the average values will have shifted, thus limiting capacity for direct longitudinal comparisons of change for specific locations in 2018. This is an important limitation which future research should seek to address.
Targets for meeting specific aspects related to the SDGs have been published previously, which can provide alternatives to comparison against study region or multi-city averages. For example, The OECD (Citation2019) provide a set of targets which may be used in studies concerned with meeting the SDGs. Dickens et al. (Citation2019) describe a framework for determining benchmarks according to the local contexts and priorities of different countries seeking to meet the SDGs, which could be used to determine benchmarks that are meaningful and may be nuanced to the needs of distinct cities in different contexts globally.
The scoring of composite indicators against established, or location contextualised, policy-relevant targets and evidence-based thresholds would provide an “absolute” assessment that would be comparable across sites and across time. For example, in the Australian National Liveability Study (Arundel et al. Citation2017) indicators of local policies were assessed (e.g. 70% of dwellings should be within 400 m of public transport stop), which allowed local policymakers to assess local policy implementation (Lowe et al. Citation2020). Although presenting challenges for between city comparison, the development of composite indices of walkability or urban liveability based on local policy would provide more objective comparisons across time and within cities, better serving tracking and monitoring (in)equity of policy delivery. However, while the calculation of indicators using locally contextualised policy standards may support tracking of policy implementation for those areas, this does not necessarily mean the policy standard is appropriate and it also does not solve the problem of between area comparisons using objective standards which can highlight important variations in policy ambition across jurisdictions: a policy for a particular topic (for example, the percentage of dwellings with access to public transport) in one particular state’s capital city may be being achieved, but the city may compare poorly against other cities when using a common evidence-supported standard of greater ambition (Arundel et al. Citation2017, Lowe et al. Citation2020).
Notwithstanding the challenges of determining appropriate target thresholds, the use of these instead of sample based averages as a source of comparison would not only better support longitudinal comparisons. Real time queries of walkability and liveability for a single address point would be more feasible and meaningful, as they would not require comparison against the average value across a region or sub-region (i.e. requiring analysis of an arbitrarily large set of locations; comparison against the average value of which, does not indicate “good” or “bad” performance), but instead could be compared directly against an agreed performance criteria to indicate whether goals have been met.
6. Reproducible Scientific Workflows for Urban Analysis
The development of a Python-based reproducible scientific workflow for large scale neighbourhood level built environment analysis – abstracting project and study region specific parameters such as data sources, thresholds, study region definitions from the general code used to perform a series of analyses – meant that methods could readily be extended to distinct study regions and policy locales, given availability of appropriate data. However, while a programmed configurable workflow can in principle allow a user to apply this to new context, exactly “how” the process can be configured is an important consideration to ensure usability in practice. An early awareness of the need to support non-programmers to use the workflow led to the adoption of Excel Workbooks as an accessible medium for defining parameters (annotated, and formatted in tables) in the Australian and Bangkok studies. The global indicators collaborative study extended the Bangkok project’s Excel configuration with parameterisation in JSON text files for its main analysis. Future studies could consider using a human readable, plain text file format supporting annotation like YAML (Greenfield et al. Citation2015, Ben-Kiki et al. Citation2005) to support accessible project configuration, whilst avoiding the use of a proprietary file format.
7. Software Development Practices Supporting Urban Environment Research Cycles
The evolving needs of expansive, multi-output projects can require on-going coding and collaboration between team members with different research background and skills. Agile software development practices can support meeting project deadlines and keeping development on track with project aims (Rodriguez et al. Citation2021, Beck et al. Citation2001). The Australian National Liveability Study analysis team used version control, stand-up meetings and task boards to support timely scaling-up. However, the capacity for code review was limited, and lack of a clearly defined end-point contributed to scope-creep, delaying project documentation to prioritise emerging additional uses and requirements.
For the Global Healthy and Sustainable City-Indicators Collaboration study (Boeing et al. Citation2022), the project team collaborated on a public repository to deliver an open source tool that is now freely accessible to the public (Liu et al. Citation2021). Adopting open source practices such as these supports collaborators and other users to reuse the code and implement the analytical process within a stable computational environment, enhancing the transparency, reproducibility and replicability of the research. The use of a public code repository platform meant that team members and public stakeholders could have open conversations about issues encountered and collaborate to resolve these, with documentation of the history of these interactions recorded for future reference or review.
It may be that the act of developing generalisable software for a project, with a view to supporting flexible re-usage in different contexts and to address different research questions, contributes to scope creep. While Agile software development methods aim to support project management, maintaining shared focus and understanding of project objectives and priorities is crucial to its success (Sithambaram et al. Citation2021).
8. Project Documentation
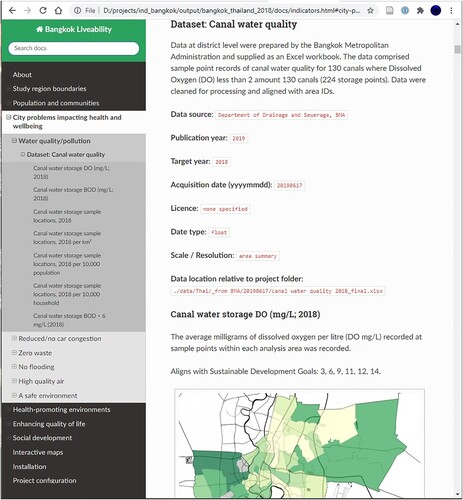
Public-ready documentation is essential for project posterity and for making the data available for use by others, but achieving this after time allocations have passed is challenging. Building on lessons from previous projects, the Bangkok Liveability Project guarded against this potential project risk by incorporating automated documentation of results, technical methods and metadata into the workflow from project commencement to support the project’s “continuous development” approach and was deliberately planned into the project deliverables (Alderton et al. Citation2020). For this project, on-going sharing of project outputs with project partners ensured project expectations were met, despite geographical distance, while also supporting local capacity-building. Further, ongoing sharing of documentation and outputs helped facilitate knowledge exchange and built trust amongst the collaborating organisations, strengthening the partnership. In the Bangkok Liveability project, training materials were provided in multiple formats, including the generated static (PDF) and interactive (HTML; ) project documentation, as well as recorded video webinars detailing usage of the tools.
Figure 4. A screenshot excerpt of generated offline HTML documentation for the Bangkok Liveability project, in which the pre-specification of project parameters to configure analysis allowed for on demand reporting on the current state of the project.
9. Balancing Utility and Parsimony in Urban Analysis Tool Development
Simultaneous output of documentation and data in multiple formats in the Bangkok and Global Indicators projects proved useful, ensuring stakeholders received data, maps, figures and reports in formats tailored to their needs, ahead of the completion of these projects. Software and package management frameworks – for example, Docker (Merkel Citation2014) and Anaconda (Anaconda Citation2020) – streamlined installation procedures, and facilitated the use of open source software as an alternative to the commercial software (ArcPy; ESRI Citation2016) dependent approach of the National Liveability project. However, the large number of underlying software libraries – used to support spatial and network analyses, report generation, database management – meant that the final software size was large, and software dependency management was still complicated. Further simplifying the software requirements would encourage more people to use this workflow for urban liveability analysis.
10. Data Linkage for Analysis with Behavioural and Health Outcomes
To further enhance the use of liveability indicators in a wider range of public health research applications, liveability indicators can be linked to health data. The urban liveability indicator workflow was designed to support linkage or analysis of participant locations to supplement surveys with built environment exposure measures, and this has been undertaken for a number of projects (Alderton et al. Citation2022, Foster et al. Citation2019, Higgs et al. Citation2019, Higgs et al. Citation2021, VicHealth Citation2020). However, the process of working with geolocated and identifiable survey data items such as participant data must be well planned in order to protect the identify of study participants.
For instance, a current ongoing project involves linkage of liveability indicators with a nationally representative population health cohort data, namely the Australian Diabetes, Obesity and Lifestyle (AusDiab; Chandrabose et al. Citation2020), with participants from diverse geographical settings across Australia. It is, therefore, possible to use measures from the Australian National Liveability Study to investigate how variation in environmental attributes supporting urban liveability may influence health outcomes, with generalisation of the findings to the broader Australian context.
However, several challenges needed to be overcome to support data linkage. The health datasets contain highly confidential information (specific health-related conditions), and hence the data custodian does not share the individual-level residential address data of the participants to third parties. Several security procedures were, therefore, adopted to protect the identity of AusDiab study participants: (1) the geocoding of study participant residential addresses was undertaken by the data custodian at their premises, and they undertook “geographic masking” (offsetting the actual coordinates with new coordinates that are some randomly generated distance away from the actual coordinates) and an id-linking variable was created; (2) fake geocodes were added into a file with the masked geocodes and the id-link variable, and these were linked to the national liveability data; (3) the data custodian then re-linked the geospatial data to the survey data; and (4) the analysis was undertaken on a de-identified data set. A similar approach was used for data linkage of indicator measures for the Australian Early Development Census (Alderton et al. Citation2019, Villanueva et al. Citation2022). Similar security protocols will need to be considered when scaling-up and linking liveability indicators for analysis of large scale national and multi-country health datasets to protect the identity of study participants.
11. Future Directions for Spatial Urban Liveability Indicators
The spatial indicators of urban liveability developed through this programme have proved flexible for a broad range of uses: assessing the availability of health supportive environments and policy implementation (Arundel et al. Citation2017, Lowe et al. Citation2020); examining the relationship between environmental attributes and child development (Villanueva et al. Citation2022), transport behaviours (Higgs et al. Citation2019), biomedical risk factors of chronic diseases (Higgs et al. Citation2021), high-density housing residents (Foster et al. Citation2019), and COVID-19 exposure (VicHealth Citation2020); as well as area level analysis (Fortune et al. Citation2020b), mapping and city indicator summaries supporting local, state and federal government planners and policy makers in diverse contexts (Gunn et al. Citation2020a, Liu et al. Citation2021, Horne et al. Citation2020, Alderton et al. Citation2020, Boeing et al. Citation2022), including through the Australian Urban Observatory (Davern et al. Citation2020) and Global Observatory of Healthy and Sustainable Cities (Salvo et al. Citation2022) online indicator observatories.
Through the course of the work, we have developed and made publicly available code and tools to support others to both reproduce our work and extend it to new contexts using popular open data sets with global scope. However, we also confronted a number of challenges, which are not fully resolved: the need for careful validation of data, particularly when community contributed (Guptill et al. Citation1995, Zhang and Pfoser Citation2019, Liu et al. Citation2021); the influence of indicator scale on modelling estimates (Higgs et al. Citation2019, O’Sullivan and Unwin Citation2010); contextualisation of benchmarks and thresholds to according local priorities (Dickens et al. Citation2019); human readable project documentation (Greenfield et al. Citation2015, Ben-Kiki et al. Citation2005); and overall project planning and management (Rodriguez et al. Citation2021, Beck et al. Citation2001, Sithambaram et al. Citation2021). This paper has summarised some approaches to addressing these challenges. Through doing so, future research can advance the accessibility, utility and meaningfulness of spatial indicators of urban liveability to better monitor progress and inform strategies for achieving the SDGs, and building healthier, more sustainable cities.
Acknowledgements
A number of collaborators contributed to conceptualising, measuring and/or using liveability indicators discussed in this paper who are not co-authors. This includes: Jonathan Arundel, Melanie Lowe, Bryan Boruff, Claire Boulange, Iain Butterworth, Stefan Cvetkowski, Melanie Davern, Sarah Foster, Paula Hooper, Luke Knibbs, Chanel Koeleman, Annette Kroen, Angus Macaulay, Maureen Murphy, Kornsupha Nitvimol, Fadhillah Norzahari, Jamie Pearce, Jerome Rachele, Rebecca Roberts, Sebastian Rodriguez, Tayebeh Saghapour, Deborah Salvo, Dhirendra Singh, SV Subramanian, Gavin Turrell, Anne Vernez-Moudon, Karen Villanueva
Disclosure Statement
No potential conflict of interest was reported by the author(s).
Additional information
Funding
References
- ABS. 2017. Australian statistical geography standard (ASGS): Volume 4 – significant urban areas. Urban Centres and Localities, Section of State, July 2016. cat. no. 1270.0.55.004 ed. Canberra, ACT: Australian Bureau of Statistics.
- AIHW. 2019. Australian burden of disease study: impact and causes of illness and death in Australia 2015. Available from: https://www.aihw.gov.au/reports/burden-of-disease/burden-disease-study-illness-death-2015 [Accessed 8 Jul 2020].
- Alderton, A, et al., 2019. The importance of the neighbourhood built environment for Australian children’s development. A report on a data linkage pilot project. Melbourne: Murdoch Children’s Research Institute and RMIT University.
- Alderton, A, et al., 2020. Measuring and monitoring liveability in a low-to-middle income country: a proof-of-concept for Bangkok, Thailand and lessons from an international partnership . Cities & Health, 5 (3), 320–328. doi:10.1080/23748834.2020.1813537.
- Anaconda, 2020. Anaconda software distribution. Anaconda Inc. Available from: https://docs.anaconda.com/ [accessed 16 May 2022].
- Arundel, J, et al., 2017. Creating liveable cities in Australia: Mapping urban policy implementation and evidence-based national liveability indicators. Melbourne: RMIT University. Available from: https://apo.org.au/node/113921 (Accessed 16 May 2022).
- Badland, H, et al., 2016. Conceptualising and Measuring Spatial Indicators of Employment Through a Liveability Lens. Social Indicators Research, 127 (2), 565–576. doi:10.1007/s11205-015-0978-6.
- Badland, H, et al., 2017a. Examining associations between area-level spatial measures of housing with selected health and wellbeing behaviours and outcomes in an urban context. Health & Place, 43, 17–24. doi:10.1016/j.healthplace.2016.11.003.
- Badland, H, et al., 2017b. Creating and applying public transport indicators to test pathways of behaviours and health through an urban transport framework. Journal of Transport & Health, 4, 208–215. doi:10.1016/j.jth.2017.01.007.
- Badland, H and Pearce, J, 2019. Liveable for whom? Prospects of urban liveability to address health inequities. Social Science & Medicine, 232, 94–105. doi:10.1016/j.socscimed.2019.05.001.
- Barrington-Leigh, C., and Millard-Ball, A., 2017. The world’s user-generated road map is more than 80% complete. PLoS One, 12(8), e0180698. doi:10.1371/journal.pone.0180698.
- Beck, K., et al., 2001. Manifesto for agile software development. Available from: https://agilemanifesto.org/ [accessed 16 May 2022].
- Ben-Kiki, O., Evans, C., and Ingerson, B. 2005. Yaml ain’t markup language (yaml) version 1.1. yaml. org, Tech. Rep.
- Boeing, G., 2017. OSMnx: New methods for acquiring, constructing, analyzing, and visualizing complex street networks. Computers environment and urban systems, 65, 126–139. doi:10.1016/j.compenvurbsys.2017.05.004.
- Boeing, G, et al., 2022. Using open data and open-source software to develop spatial indicators of urban design and transport features for achieving healthy and sustainable cities. The Lancet Global Health, 10 (6), e907–e918. doi:10.1016/S2214-109X(22)00072-9.
- Casey, N., 2011. International city comparisons. Melbourne: Melbourne City Research, City of Melbourne.
- Chandrabose, M, et al., 2020. Built environment and cardio-metabolic health: systematic review and meta-analysis of longitudinal studies. Obesity Reviews, 20 (1), 41–54. doi:10.1111/obr.12759.
- Chi, Y.L., and Mak, H.W.L., 2021. From comparative and statistical assessments of liveability and health conditions of districts in Hong Kong towards future city development. Sustainability, 13(16), 8781. doi:10.3390/su13168781.
- Clark, H., et al., 2020. A future for the world's children? A WHO–UNICEF–Lancet commission. The Lancet, 395(10224), 605–658. doi:10.1016/S0140-6736(19)32540-1.
- Davern, M, et al., 2018. Using spatial measures to test a conceptual model of social infrastructure that supports health and wellbeing. Cities & Health, 1 (2), 194–209. doi:10.1080/23748834.2018.1443620.
- Davern, M, et al., 2019a. A Liveability Assessment of the Gannawarra Shire: An investigation of Kerang and Cohuna. Melbourne: RMIT University.
- Davern, M, et al., 2019b. Neighbourhood Liveability Assessment of Benalla: Using Indicators to understand and plan for liveability in the town of Benalla. Melbourne: RMIT University.
- Davern, M, et al., 2019c. A Liveability Assessment of the Neighbourhoods of Manningham: The application of indicators as evidence to plan for a healthy and liveable community. Melbourne: RMIT University.
- Davern, M, et al., 2020. Australian Urban Observatory. RMIT University. Available from: https://auo.org.au.
- Davern, M.T., Gunn, L., and Ghantous, S. 2008. Using the community indicators Victoria survey to assess liveability in victoria: report prepared for the Victorian Competition and Efficiency Commission. Parkville, Vic: University of Melbourne, McCaughey Centre.
- De Hollander, A.E.M., and Staatsen, B.A.M., 2003. Health, environment and quality of life: an epidemiological perspective on urban development. Landscape and urban planning, 65(1-2), 53–62. doi:10.1016/S0169-2046(02)00237-2.
- Dickens, C., et al., 2019. Defining and quantifying national-level targets. Indicators and benchmarks for management of natural resources to achieve the sustainable development goals. Sustainability, 11, 462. doi:10.3390/su11020462.
- Economist Intelligence Unit. 2021. The Global Liveability Index. Available from: http://www.eiu.com/topic/liveability [Accessed 8 Nov 2021].
- ESRI, 2016. ArcGIS desktop: release 10.5. Redlands: Environmental Systems Research Institute.
- Florczyk, A., et al. 2019. GHS Urban Centre Database 2015, multitemporal and multidimensional attributes, R2019A. In: EUROPEAN COMMISSION & JOINT RESEARCH CENTRE (JRC) (eds.).
- Fonte, C., et al., 2017. Assessing VGI data quality. In: G. Foody, etal, ed. Mapping and the citizen sensor. London: Ubiquity Press, 137–163.
- Fortune, N, et al., 2020a. The Disability and Wellbeing Monitoring Framework: data, data gaps, and policy implications. Australian and New Zealand Journal of Public Health, 44 (3), 227–232. doi:10.1111/1753-6405.12983.
- Fortune, N, et al., 2020b. Area-Level Associations between Built Environment Characteristics and Disability Prevalence in Australia: An Ecological Analysis. International Journal of Environmental Research and Public Health, 17 (21), doi:10.3390/ijerph17217844.
- Foster, H., et al. 2013. Peri-urban Melbourne in 2021: changes and implications for the Victorian emergency management sector. Australian Journal of Emergency Management [Online], 28. Available from: http://www.austlii.edu.au/au/journals/AUJlEmMgmt/2013/38.pdf [Accessed 5 Oct 2020].
- Foster, S, et al., 2019. High Life Study protocol: a cross-sectional investigation of the influence of apartment building design policy on resident health and well-being. BMJ Open, 9 (8), e029220. doi:10.1136/bmjopen-2019-029220.
- Frank, L.D., et al., 2010. The development of a walkability index: application to the neighborhood quality of life study. British Journal of sports medicine, 44(13), 924–933.
- Giles-Corti, B., et al., 2016. City planning and population health: a global challenge. Lancet, 388(10062), 2912–2924. doi:10.1016/S0140-6736(16)30066-6.
- Giles-Corti, B, Lowe, M, and Arundel, J, 2020. Achieving the SDGs: Evaluating indicators to be used to benchmark and monitor progress towards creating healthy and sustainable cities. Health Policy, 124 (6), 581–590. doi:10.1016/j.healthpol.2019.03.001.
- Gómez-Varo, I., Delclòs-Alió, X., and Miralles-Guasch, C., 2022. Jane Jacobs reloaded: a contemporary operationalization of urban vitality in a district in Barcelona. Cities, 123, 103565. doi:10.1016/j.cities.2022.103565.
- Government of India. 2016. Liveability standards in cities. Available from: https://smartnet.niua.org/sites/default/files/resources/Liveability%20Standards.pdf.
- Greenfield, P., Droettboom, M., and Bray, E., 2015. ASDF: a new data format for astronomy. Astronomy and computing, 12, 240–251. 10.1016/j.ascom.2015.06.004.
- Gunn, L, et al., 2020a. Measuring liveability for the 21 largest cities in Australia [series of liveability scorecard reports]. Melbourne: RMIT University. Available from: https://auo.org.au/measure/scorecards/ (Accessed 16 May 2022).
- Gunn, L, et al., 2020b. Early delivery of equitable and healthy transport options in new suburbs: Policy, place and people. Journal of Transport and Health, 18, 100870. doi:10.1016/j.jth.2020.100870.
- Guptill, S.C., Morrison, J.L., and Association, I.C., 1995. Elements of spatial data quality. Oxford: Elsevier Science.
- Harrell, R., 2017. AARP’s livability index: a picture of how communities meet the needs of people of all ages. Innovation in aging, 1(Suppl. 1), 959–959. doi:10.1093/geroni/igx004.3454.
- Higgs, C, et al., 2018. Developing a policy-relevant , high resolution, policy relevant index of urban liveability in Australia. International Conference of Health Policy Statistics, 2018, Charleston, South Carolina, United States. doi:10.25439/rmt.15001386.v2.
- Higgs, C, et al., 2019. The Urban Liveability Index: developing a policy-relevant urban liveability composite measure and evaluating associations with transport mode choice. International Journal of Health Geographics, 18 (1), doi:10.1186/s12942-019-0178-8.
- Higgs, C, et al., 2021. Cross-sectional evidence of the cardiometabolic health benefits of urban liveability in Australia. npj Urban Sustainability, 1 (1), doi:10.1038/s42949-021-00039-5.
- Horne, R, et al., 2020. From Ballarat to Bangkok: how can cross-sectoral partnerships around the Sustainable Development Goals accelerate urban liveability?. Cities & Health, 4 (2), 199–205. doi:10.1080/23748834.2019.1698938.
- Johnson, I. L., Lin, Y., Li, T. J.-J., Hall, A., Halfaker, A., Schöning, J. & Hecht, B. 2016. Not at home on the range: peer production and the urban/rural divide. Proceedings of the 2016 CHI conference on human factors in computing systems [online]. Available: doi:10.1145/2858036.2858123.
- Kaal, H., 2011. A conceptual history of livability. City, 15(5), 532–547.
- Liu, S, et al., 2021. A Generalized Framework for Measuring Pedestrian Accessibility around the World Using Open Data. Geographical Analysis, doi:10.1111/gean.12290.
- Lloyd, C.T., Sorichetta, A., and Tatem, A.J., 2017. High resolution global gridded data for use in population studies. Scientific data, 4(1), 170001. doi:10.1038/sdata.2017.1.
- Lowe, M., et al. 2013. Liveable, healthy, sustainable: What are the key indicators for Melbourne neighbourhoods? Research Paper 1 Available from: https://socialequity.unimelb.edu.au/__data/assets/pdf_file/0006/1979574/Liveability-Indicators-report.pdf [Accessed 5 Jan 2018].
- Lowe, M, et al., 2020. Liveability aspirations and realities: Implementation of urban policies designed to create healthy cities in Australia. Social Science & Medicine, 245, doi:10.1016/j.socscimed.2019.112713.
- Martino, N., Girling, C., and Lu, Y., 2021. Urban form and livability: socioeconomic and built environment indicators. Buildings and cities, 2(1), 220–243. doi:10.5334/bc.82.
- Mathers, C.D., et al., 2001. The burden of disease and injury in Australia. Bulletin of the world health organization, 79, 1076–1084.
- Mavoa, S, et al., 2018. Identifying appropriate land-use mix measures for use in a national walkability index. Journal of Transport and Land Use, 11 (1), 681–700. doi:10.5198/jtlu.2018.1132.
- Mcphearson, T., Raymond, C., Gulsrud, N., Albert, C., Coles, N., Fagerholm, N., Nagatsu, M., Olafsson, A. S., Soininen, N. & Vierikko, K., 2021. Radical changes are needed for transformations to a good anthropocene. Npj urban sustainability, 1, 5.
- Merkel, D., 2014. Docker: lightweight Linux containers for consistent development and deployment. Linux j, 2014 (239), 73–91. https://dl.acm.org/doi/10.5555/2600239.2600241.
- Murphy, M, et al., 2017. Indicators of a health-promoting local food environment: a conceptual framework to inform urban planning policy and practice. Health Promotion Journal of Australia, 28 (1), 82–84. doi:10.1071/he15098.
- Murray, C.J., and Lopez, A.D., 1997. Global mortality, disability, and the contribution of risk factors: global burden of disease study. Lancet, 349(9063), 1436–1442.
- OECD. 2019. Measuring distance to the SDG targets 2019.
- Omran, A.R., 1971. The epidemiologic transition: a theory of the epidemiology of population change (2005 reprint). The milbank quarterly, 83(4), 731–757.
- Openstreetmap Contributors. 2021. OpenStreetMap / Planet OSM. Available from: https://www.openstreetmap.org https://planet.osm.org.
- O’sullivan, D. & Unwin, D. 2010. Geographic information analysis, Hoboken: John Wiley & Sons.
- Pacione, M., 1982. The use of objective and subjective measures of life quality in human geography. Progress in Human geography, 6(4), 495–514.
- Pacione, M., 1990. Urban liveability: a review. Urban geography, 11, 1–30.
- Rodriguez, S., Thangarajah, J., and Winikoff, M. 2021. User and system stories: an agile approach for managing requirements in AOSE. 9.
- Ruth, M., and Franklin, R.S., 2014. Livability for all? Conceptual limits and practical implications. Applied geography, 49, 18–23. doi:10.1016/j.apgeog.2013.09.018.
- Salvo, D, et al., 2022. Global observatory for healthy and sustainable cities. Available from: www.healthysustainablecities.org (Accessed 16 May 2022).
- Schiavina, M., Freire, S., and Macmanus, K. 2019. GHS-POP R2019A – GHS population grid multitemporal (1975-1990-2000-2015).
- Sithambaram, J., Nasir, M.H.N.B.M., and Ahmad, R., 2021. Issues and challenges impacting the successful management of agile-hybrid projects: a grounded theory approach. International journal of project management, 39(5), 474–495. doi:10.1016/j.ijproman.2021.03.002.
- Stanaway, J.D., et al., 2018. Global, regional, and national comparative risk assessment of 84 behavioural, environmental and occupational, and metabolic risks or clusters of risks for 195 countries and territories, 1990–2017: a systematic analysis for the Global Burden of Disease Study 2017. The Lancet, 392, 1923–1994. doi:10.1016/S0140-6736(18)32225-6.
- State of Victoria DELWP. 2017. Plan Melbourne 2017–2050: Metropolitan Planning Strategy. Available from: https://www.planmelbourne.vic.gov.au/__data/assets/pdf_file/0007/377206/Plan_Melbourne_2017-2050_Strategy_.pdf [Accessed 8 Jul 2020].
- Storer, J. 1870. Our cities: their present position and requirements. 19th Century British Pamphlets [Online]. Available from: www.jstor.org/stable/60249334 [Accessed 8 Jul 2020].
- Taylor, J., et al., 2018. A comparative analysis of global datasets and initiatives for urban health and sustainability. Sustainability, 10(10), 3636. doi:10.3390/su10103636.
- UNDP. . 1990. Human development report 1990: Concept and measurement of human development. Available from: http://www.hdr.undp.org/en/reports/global/hdr1990 [Accessed 8 Jul 2020].
- United Nations, 2015. Resolution adopted by the General Assembly: transforming our world: the 2030 agenda for sustainable development A/RES/70/1. New York: United Nations.
- United Nations 2016. Resolution adopted by the General Assembly on 23 December 2016: 71/256. New Urban Agenda. New York: United Nations.
- Valcárcel-Aguiar, B., and Murias, P., 2019. Evaluation and management of urban liveability: A Goal programming based composite indicator. Social indicators research, 142(2), 689–712. 10.1007/s11205-018-1861-z.
- VicHealth, 2020. VicHealth Coronavirus Victorian wellbeing impact study: follow-up survey. Melbourne: Victorian Health Promotion Foundation.
- Villanueva, K, et al., 2015. Developing indicators of public open space to promote health and wellbeing in communities. Applied Geography, 57, 112–119. doi:10.1016/j.apgeog.2014.12.003.
- Villanueva, K, et al., 2022. Data to Decisions: Methods to Create Neighbourhood Built Environment Indicators Relevant for Early Childhood Development. Int. J. Environ. Res. Public Health, 19 (9), 5549. doi:10.3390/ijerph19095549.
- Woolcock, G. 2009. Measuring up? Assessing the liveability of Australian Cities. SOAC 4. Perth: State of Australian Cities National Conference.
- Zhang, L., and Pfoser, D., 2019. Using OpenStreetMap point-of-interest data to model urban change – a feasibility study. PLoS One, 14, e0212606. doi:10.1371/journal.pone.0212606.