
ABSTRACT
Recognising the multifaceted challenges of addressing the dominance of cars for children’s transport, this paper introduces and tests a “child-friendliness index” (CFI) to assess the performance of neighbourhoods and school catchments to enable or constrain how children travel to school. The findings demonstrate that car trips both to and from school are negatively associated with child-friendliness. However, counter-intuitively there was no significant association between distance and car use, which remained high for shorter distances (< 4 km). These findings imply school travel decisions are susceptible to many factors. We discuss the policy pathway provided by CFI for school accessibility planning.
摘要
基于对解决儿童交通中汽车占主导地位一事之多方面挑战的认识,本文引入并测试了一个“儿童友好指数”(CFI),以评估社区和学校招生地区的表现,从而使儿童能够采用或限制儿童上学的方式。研究结果表明,往返学校的汽车行程与儿童友好性呈负相关。然而,距离和汽车使用之间反直观地没有显著的关联,在较短的距离(<4公里)内,这一关联仍然很高。这些发现表明,上学交通方式的选择容易受许多因素影响。我们探讨了CFI为学校无障碍规划提供的政策途径。
1. Introduction
The increased number of car trips taken by children and young people as passengers globally has been well documented (Behrens et al. Citation2017, Malone and Rudner Citation2017, SRTS Citation2023) The associated decline in walking, cycling and public transport trips to school is most pronounced for the younger age groups living in developed countries (McMillan Citation2013, Garrard Citation2016, Jacob et al. Citation2021), with car use noticeably greater in households with young children compared to other household types (Fyhri et al. Citation2011, Oakil et al. Citation2016, Bayart et al. Citation2020).
In the Australian context, the heavy reliance on cars to transport children to their daily destinations, including school has been normalised as part of contemporary lifestyles. In terms of honouring children’s needs and rights to access non-car transport modes as part of their daily lives for their physical, psychological, emotional and social development (Freeman Citation2010, Schoeppe Citation2013, Ramanathan Citation2014, Waygood Citation2017, Gilliland et al. Citation2019, Keall et al. Citation2020, Aliyas et al. Citation2022, Gilbert and te Brömmelstroet Citation2023), planning and transport policies continue to fail substantively.
Although there are no nationwide datasets regarding the scale of private car usage to transport children to their daily destinations, individual studies and household surveys consistently report that the majority of children’s trips to and from school occur via car. Figures suggest that car usage is most prevalent when accessing primary school (Garrard Citation2016, The Royal Children’s Hospital National Child Health Poll Citation2019). In contrast, active transport rates for primary school trips only constitute around 25% of total trips, of which 9 out of 10 are walking (or 22% of the total) (Garrard Citation2016). In the context of the overall population of children attending a primary school in Australia (2,075,224 children at primary schools at the 2021 Census, ABS Citation2021c), this translates to over 1.5 million children nationwide who are being driven in cars to access a primary school on school days. Tellingly, these trips are typically within walking (up to 1 km) and cycling (up to 5 km) distances from school (Garrard Citation2009, Ridgewell et al. Citation2009, Sharpe and Tranter Citation2010).
The importance of multifaceted approaches to more effectively reduce the reliance on cars, has long been recognised (Wind Citation2012, Jensen Citation2013, Cortes-Morales and Christensen Citation2014), with various successful policies and programmes such as walking school buses, bike trains and active transport school programmes being facilitated by local governments (for instance Open Streets by Merri-bek City Council or Octopus Schools programme by City of Darebin in Victoria, Australia). However, supportive policy and programme development has been fragmented, with governance arrangements characterised by policy silos that hamper the capacity of such initiatives to create substantial change at scale (Gilbert et al. Citation2018a).
The concept of the local school has a long history in planning, going back at least as far as Clarence Perry’s Neighbourhood Unit from the 1920s, and despite a century of dramatic changes to the size, composition and structure of the cities in which an increasing majority live, schools continue to be “expected to be local” by communities (Brookfield Citation2017, p. 51). This is despite the reality that they are not always accessed and utilised at a local level due to the many factors influencing families’ decision-making processes when choosing schools (e.g. school type, curriculum offerings, socio-cultural or religious reasons) (Cucchiara and Horvat Citation2014, Jackson Citation2019).
The concept of the local school has also been a focal element within the planning and transport policy realm, with local living policies listing them as a key community facility. However, the simplistic assumption is often that proximity to home on its own will induce access by active transport (Gilbert and Woodcock Citation2022), while the actual decisions regarding school choice are complex with many factors independent of closeness to home such as traffic safety, school type and so on being relevant. These can then override any affordances for active modes of transport related to point-to-point distance. Proximity considerations become more meaningful when supported by a range of other features that improve the likelihood that any given place will foster active transport use in general since school access is often just one destination among many across children’s increasingly complex activity spaces. In the case of a school, this could be spatial elements, as in the provision of convenient, legible and safe active transport infrastructure; or temporal, such as starting and finishing times for after-school activities that enable access by non-car modes (Gilbert et al. Citation2018b).
A more sophisticated approach would be premised on a much wider suite of factors that support active travel modes rather than simplistic “buffers” represented by as-the-crow-flies 400 and 800 m circles around key activities. With this, consideration of network-based accessibility for active and public transport for key activity nodes in the pattern of daily life such as shops, sports and recreation, public open space as well as schools would become central to policy and planning, and especially the operation of school zones. To demonstrate the benefits of moving away from a simplistic home-to-school proximity-based approach, this paper combines the social and physical environmental features associated with “child-friendliness”, primarily comprising: positive indicators of child-oriented environmental quality such as “safety and free movement”, “peer gathering places” and “varied activity settings” informed by definitions developed by UNICEF (2013); the work of scholars such as Chawla (Citation2002) and Chatterjee (Citation2005) on children’s positive engagement with places with a diverse range of physical and social settings; the multi-scale importance of child-friendliness from the front door to streets and city-wide public spaces (Woolley and Johns Citation2001, Oktay Citation2004, Christensen et al. Citation2017). Thus, child-friendliness is conceptualised multidimensionally across scales in the present article rather than being framed by the limited scope and scale of child-specific places segregated from everyday urban places. In doing so, the paper advances the framework proposed by Gilbert et al. (Citation2018a) from the theoretical to the practical by quantifying a range of built environment variables of child-friendliness, using a range of spatial databases. This framework utilises the concept of “child-friendliness” to incorporate broader understandings of children’s rights to the city manifested through a range of “agglomeration” effects that arise from the spatial co-presence of activities and sustainable modes of transport that enable children and their caregivers to decide not to drive when making transport decisions. With this, we argue that children have a right to sustainable mobility that is not dependent on access to being transported by car to go about their daily lives; honouring these rights requires more than short distances between a limited suite of child-specific spaces and instead, independent access to a much wider range of urban spaces and experiences.
The paper reports on children’s journeys to school across 10 schools in Melbourne and Adelaide, the capital cities of the Australian states of Victoria and South Australia. To understand how travel behaviour is impacted by the interaction of land use and transport contexts, or “mobility environments” (Bertolini and Le Clercq Citation2003, Bertolini Citation2017) related to home and school, a “child-friendliness index” was devised to assess how distance, mode, land use distribution and accessibility could be related.
2. Methods
As part of a broader research project (PhD thesis conducted at the University of South Australia titled “Children’s everyday mobilities and low carbon living”), 296 surveys were completed (response rate of 33%) by children aged 9–18 years, across 6 schools (3 primary, 2 secondary, 1 combined) in Adelaide, South Australia and 4 schools (2 primary, 1 secondary, 1 combined) in Melbourne, Victoria during 2017 and 2018. 84 surveys were also completed by parents of children aged 9–18 years in the same schools (response rate of 28%). Data collection took place between April 2017 and June 2018. In both years, the weather patterns were as usual for each city, though Melbourne experienced below-average rainfall, while Adelaide’s rainfall was close to the average. The temperatures in both cities were slightly above average for both cities (Bureau of Meteorology Citation2024).
In terms of metropolitan population contexts, Melbourne’s was 4,917,750 and Adelaide’s was 1,387,290 in the 2021 Census (ABS Citation2021a), reflecting the larger and smaller ends of Australian mainland state capitals. In terms of the travel mode to work, the state of Victoria had a lower car use (53.8%) than both South Australia (68.7%) and Australia as a whole (57%). The share of public transport for work trips was 4.4% for Victoria and 5.3% for South Australia (compared to 4.6% for Australia), while the share of walking and cycling in work journeys was 3% for Victoria and 3.3% for South Australia (compared to 3.2% for Australia) (ABS Citation2021b).
Schools were selected to represent local catchment areas (preference given to schools with school zoning rules as school zones are not a consistent policy across different types of schools), diverse socio-economic characteristics, based on the Socio-economic Index for Areas Index of Relative Socio-economic Disadvantage (SEIFA) (ABS Citation2016) and mixed residential density. SEIFA summarises the indicators on a range of economic and social conditions of people and households within an area which measures relative disadvantage. This study was approved by the University of South Australia Ethics Committee and gained the required approval from educational authorities as well as approval from school principals and teachers.
2.1. Distance Between Home and School
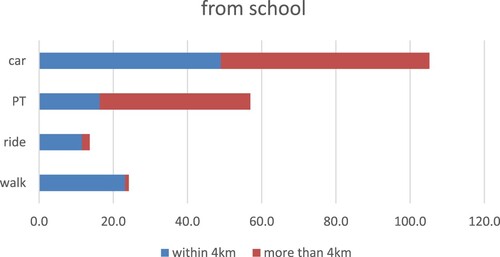
In this study, children and parents were asked to provide their home addresses in the form of the street name or closest intersection as well as the suburb. These addresses were geocoded using Google Earth Pro and the resultant keyhole markup language (kml) files were converted to shape files in QGIS software (version 3.8.0). In terms of the geographical information on where children live, the direction function on Google Earth Pro was used to calculate the shortest modal network distance between home and the school they attended for each respondent. This distance was calculated for driving as well as walking which included the pedestrian network. In most instances, driving distances were found to be equal to or longer than the walking distances: out of the 296 participants, there were only four cases (1.4%) where the driving distance was shorter than the walking distance (by up to 0.5 km). Children’s driving distance to school was recoded into two categories for further analyses as follows: 0 = within 4 km, in line with the overall active transport scale (i.e. walkable when less than 2.25 km, cyclable when less than 4 km) (Mandic et al. 2020). The sample included a higher proportion of children living within 4 km of their schools (64.2%) than those who lived further away (32.4%) Travel mode of participant children concerning the distance was given in and .
Figure 1. Travel mode to school by distance.
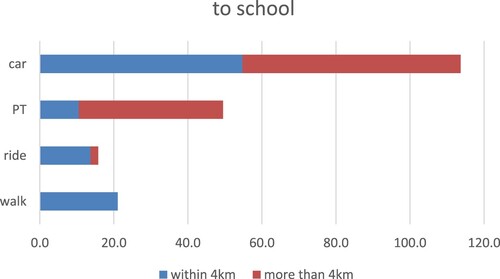
Figure 2. Travel mode from school by distance.
2.2. Child-Friendly Built Environment
The measurements used in this index correspond with the following built environment variables in the operational framework developed by Gilbert et al. Citation2018a: Land use and built environment, provision of nature, local accessibility and mobility provision of local services. These spatial measures are those previously found to be associated with children’s mobilities as explained in the following section and in with the details of sources for each variable listed in Table A-1.
Table 1. Spatial measures of children’s car-based mobilities.
2.2.1. Active Transport Infrastructure
2.2.1.1. Walkability
The findings from previous studies both for children and adults indicate that connectivity of streets, population density and diversity of land uses (land use mix) in a neighbourhood promote increased rates of walking and improved accessibility to local destinations (Sallis Citation2006, van Loon Citation2014, Buck et al. Citation2015, Moudon Citation2006, Dovey and Pafka Citation2020). The walkability index tool within the Australian Urban Research Infrastructure Network (AURIN) portal (AURIN Citation2019) which combined all of these three variables was used to calculate a walkability index for each participant’s home-based and school-based buffer. The databases and the categories used for these composite elements within this tool were:
Land Use Mix: Mesh Block 2016, land use categories of residential, commercial, education, hospital/medical and parkland.
Population: Mesh Block 2016Footnote1, total resident population
Network: OpenStreetMap (OSM) Citation2018 streets
2.2.1.2. Bike and Public Transport Accessibility
In order to estimate the provision of cycling infrastructure, the bike network data was used to calculate the number of intersections to show the potential mobility of cyclists within the neighbourhood using the connectivity tool within the AURIN portal. For public transport accessibility, the number of stops (and stations) for bus, tram and train network were calculated.
2.2.2. Traffic Safety
Concern about traffic safety is one of the key factors contributing to reduced walking and cycling rates amongst school-aged children (Carver et al. Citation2013, Kottyan et al. Citation2014). In order to assess the actual likelihood of traffic danger, crash statistics and traffic exposure data were used. Crash statistics are commonly used to analyse road safety (BITRE Citation2015, Beck et al. Citation2016, State Government of Victoria Citation2019, New South Wales Government Citation2020). In addition, the number of traffic lights was counted to estimate the provision of traffic calming measures. The provision of traffic lights to assist crossing was previously found to be in positive association with the sense of safety amongst parents in relation to their children’s non-car-based mobilities (Veitch Citation2017) and similarly have been found in general to contribute to stronger associations of safety with urban street environments (White Citation2021).
2.2.2.1. Traffic Exposure
In order to estimate the level of traffic exposure, the ratio of the total length of main roads to the length of local roads was used. This method was adapted from previous studies that used the road hierarchy to calculate the traffic exposure in Western Australian context (Giles-Corti et al. Citation2011). The transport hierarchy within the Public Sector Mapping Agencies (PSMA) (Citation2019) street network is used to identify higher-order (high traffic) and lower-order (low traffic) roadsFootnote2:
Higher order = 301, 302, 303 and 304
Lower order = 305, 309 and 400
Using the QGIS software (sum of lines in a network buffer), the total length of these roads within each home and school based buffer was calculated.
2.2.2.2. Proximity to Local Services and Green Spaces
Selected basic services that facilitate the everyday life of families with children were counted for each participant’s home-based buffer. These services were schools, childcare centres, libraries, health services and public open spaces. Public open spaces are important local destinations for families with children as well as contributing to an attractive public realm (Broberg and Sarjala Citation2015, Van Kann Citation2015).
2.2.3. Demographic Diversity
This segment of the index includes data on housing density, housing diversity and child population density.
2.2.3.1. Housing Density
Housing density is one of the most commonly used variables in relation to environments promoting the use of non-car travel modes and increased levels of physical activity (Buck et al. Citation2015, Oliver Citation2015, van Leslie et al. Citation2007, Loon and Frank Citation2011). In this study, the housing density for each buffer area was calculated through the ratio of total number of dwellings to the total buffer area (hectare).
2.2.3.2. Housing mix
In recognition of the link between housing density and diversity, for instance, low-density housing areas generally not conducive to active and public transport use and growing preference for non-detached houses by families with children (Easthope and Tice Citation2011), “housing mix”(mix of different house types) has been added to the CFI. The diversity index in the AURIN portal was used to calculate the degree of housing diversity for each buffer area. This index computes a measure of the degree of diversity across different housing types such as separate, semi-detached, row terrace house, townhouses, flats and apartments. Smaller scores indicated an increasing degree of diversity.
2.2.3.3. Child Population Density
Given the population density was already included in the walkability index tool within the AURIN portal, only the child population density has been added to the demographic diversity component of the CFI. As per the previous studies (Cortes-Morales and Christensen Citation2014, Rothman Citation2014) on the importance of other children’s presence as part of children’s everyday mobilities, in this study, it has been hypothesised that a higher number of children in the neighbourhood creates better opportunities to interact with other children and to make friends as part of children’s everyday mobilities.
2.3. Calculation of Spatial Unit for Analysis: Network Buffers
In recognition of the importance of children’s membership of multiple groupings beyond their home as highlighted by ecological systems theory (Bronfenbrenner Citation1979) and the importance of local environments surrounding both home and school when assessing the environmental correlates of children’s active transport (Easton and Ferrari Citation2015, Larouche Citation2018), the buffers used for the CFI included both home-based and school-based areas. This method was proven useful for detecting associations in relation to after-school trips (from school) that would not have been captured through the inclusion of home-based local environments only.
Conceptualising individuals’ local environments in the context of measuring certain activities (e.g. physical activity levels) within their overall activity spaces is challenging as the full geographic extent often reaches well beyond local environments associated with school and home (Kwan Citation2012). However, our travel patterns and their spatial scales, invariably do include the local environments around our daily spaces and so, network-based buffers offer a more consistent and accurate scale for examining travel patterns. In the context of this study, the buffers related to a short walk from home and school represent the environments to which children are regularly exposed and are therefore useful in measuring the provision of child-friendly infrastructure and services.
The use of network-based buffers is useful in overcoming another issue with the conceptualisation of local environments, that is the misalignment between the areas on which data releases are based and the actual activity spaces. For example, the usual methods for such conceptualisation are often influenced by the availability of data for individual administrative units such as suburbs or other predetermined statistical areas. However, these administrative units rarely align with the individuals’ actual lived local environments and so illustrate the need for alternative scales and zones.
The neighbourhood generator tool within the AURIN portal was used to create the 1000 m network buffer for each participant’s home distance representing a generic 10 to 15-minute walk or 5-minute bicycle ride. This tool, rather than radial buffers, produces buffers for a street network using the maximum distance to travel along the network and a buffer value that determines the width of the buffer around the traversed network segments.
The buffer size of 1000 m is commonly used in studies related to children’s mobilities in Australia and overseas (De Meester et al. Citation2014, Oliver Citation2015, Lin et al. Citation2017, Williams et al. Citation2018). An example of school and home based buffers along with school zones is given in .
Figure 3. Home and school based buffers based on participant children’s residential addresses (Note: School 1’s 1 km network buffer and school zone as shown in blue)
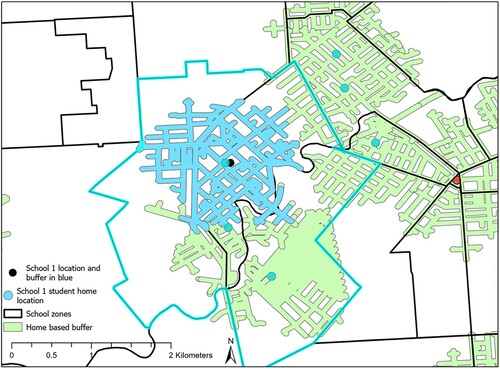
The OpenStreetMap (OSM) network dataset (Citation2018) was used to measure the walkable catchment area within 1000 m of each participant’s home location. The information on the home addresses was sought both from the children’s and parents’ surveys. In total, 286 buffers were created with missing information from 10 participants (total n = 296). The same process was repeated for the schools (1000 m network buffer around schools) where participant children were attending to develop school-based indices.
2.4. Development of a Child Friendliness Index
The Child Friendliness Index (CFI) was calculated by summing the results for each measurement listed above both for the home-based and school-based buffers. The total score (1–10) for each measurement was summed for each buffer area ranging between 15 (lowest child-friendliness) and 150 (highest child-friendliness). The resulting child-friendliness indices (home-based and school-based) were further classified into three equal groups to rescale the results from low, medium and high child-friendliness. These results were used when analysing the relationship between the travel mode reported by participant children and parents.
In the absence of an evidence base indicating the differential impacts of individual indicators used, for this study, we used an equal weighting approach. Equal weighting is a commonly used approach for numerical indices due to the wide-ranging complexities of the development of weighted indices, for example in the absence of a single robust method that eliminates bias from the process (Greco et al. Citation2019, Gómez-Limón et al. Citation2020).
To date, no single approach has been developed to address such challenges in transport indices. One strategy which involves drawing on the experiences of practitioners and researchers assesses the relevance of each factor based on its impact on walkability, essentially determining its ability to predict the level of walkability. Some studies employing this kind of approaches in creating weighted walkability indices have assigned higher importance to factors like land use diversity and street connectivity compared to other elements within the built environment (Frank et al. Citation2010, Al Shammas and Escobar Citation2019). However, complexities arise due to contextual differences. For instance, in a study on the determinants of walkability in the Netherlands, Liao and colleagues (Citation2020) found that elements related to the environment's attractiveness, such as the presence of natural features which are often overlooked in such indices, were more salient than factors like land use mix.
Another layer of complexity with such indices is the presence of collinearity where some independent variables are correlated, potentially leading to double counting. In the case of the CFI, this issue may arise concerning the factors of traffic exposure measured by the ratio of high-order roads to low-order roads and the crash statistics which are likely to increase with the higher presence of high-order roads.
The challenge of ranking the importance of contributing factors to active and public transport usage is further complicated by the presence of subjective elements, such as perceptions of safety in specific streets or places. This is particularly the case with decision-making processes around children’s daily movements, as perceptions of safety both by parents and children significantly influences travel behaviour (Aliyas et al. Citation2022, Gilbert et al. Citation2022, Swain Citation2023).
2.5. Dependent Variable: Children’s Mobilities
Children were asked to report the travel mode to and from school on the day of data collection. The response categories included, walk, ride a bike, bus, train, tram and car. The responses were recoded at 1 = active transport, 2 = public transport and 3 = car.
3. Data Analysis
The chi-square test for independence was used to identify statistically significant differences between the variables. Since the categories in each variable are more than those in a 2 × 2 table, the post-hoc tests were used to identify which combinations of results were statistically significant. The first step of the post-hoc test for chi-square analysis is the calculation of the adjusted p value (Bonferroni adjusted alpha value) which sets an adjusted significance level in order to make multiple comparisons. Calculated by dividing the standard p value (0.05) by the number of comparisons or tests, this value produces a more stringent p value for each comparison which is critical to prevent the possibility of a Type 1 error due to the large number of comparisons being made (Pallant Citation2011, Chen et al. Citation2017).
The second step in conducting the post-hoc tests was the calculation of the adjusted residual values (z scores) for each comparison or analysis being made and the individually adjusted p values for each analysis.Footnote3
4. Results
4.1. Distance and Private Car Usage
In order to identify to what degree the travel modes to and from school reported by children on the day of data collection were dependent on the distance between home and school, chi-square tests for independence were carried out for the travel modes (AT, PT and Car), both to and from school on the day of data collection. The initial chi-square test for independence results indicated that there was a significant difference in children’s travel mode to and from school on the day of data collection χ² (2, n = 285) = 54.04, p < 0.05 to school and from school χ² (2, n = 286) = 42.48, p < 0.05.
After the adjustment of residual values and individual p values (Bonferroni correction), the significance was observed between distance and active transport as well as public transport while no significant difference between distance and car usage (p < 0.0083). Using the adjusted residual values and adjusted individual p values (Bonferroni correction), for the distance within 4 km, there was no significantly lower car usage than expected by chance while there was no significantly higher car usage than expected by chance for the distance longer than 4 km (p < 0.0083). Comparing car and non-car modes to each other at the shortest distance (<4 km), there was no significantly higher AT or PT usage than car usage (Table A-2).
4.2. Child Friendliness and Private Car Usage
In order to identify if the travel modes to and from school reported by children on the day of data collection were dependent on the child-friendliness of their immediate neighbourhood and school, chi-square tests for independence were carried out for travel modes (AT, PT and Car), both to and from school on the day of data collection. All variables were assessed against home-based and school-based child-friendliness.
The chi-square test for independence results indicated that travel modes to and from school on the day of data collection were not independent of the child-friendliness (low, medium and high) of the area around home and school (p < 0.05). The results for each test, travel mode and home-based CFI and travel mode and school-based CFI, are explained in the next two sections.
4.2.1. Travel Mode and Home-Based CFI
A chi-square test for independence indicated a significant difference in children’s travel mode to school on the day of data collection (1 = AT, 2 = PT and 3 = Car), in relation to home-based child-friendliness (1 = low, 2 = medium, 3 = high), χ² (4, n = 285) = 34.18, p < 0.05 and from school χ² (4, n = 286) = 33.11, p < 0.05.
Using the adjusted residual values and adjusted individual p values (Bonferroni correction), at the low level of home-based child-friendliness (CFI_home = 1), there was significantly higher car usage than expected by chance (both to and from school), conversely significantly lower AT (to school) and PT usage (to and from school) than expected by chance (p < 0.0056). At the high level of child-friendliness (CFI_home = 3), there was significantly lower car usage than expected by chance and significantly higher AT usage than expected by chance both to and from school (Table A-3).
4.2.2. Travel Mode and School Based CFI
A chi-square test for independence indicated a significant difference in children’s travel mode to school on the day of data collection (1 = AT, 2 = PT and 3 = Car), in relation to school-based child-friendliness (1 = low, 2 = medium, 3 = high), χ² (4, n = 293) = 53.81, p < 0.05 and from school χ² (4, n = 294) = 52.95, p < 0.05.
Using the adjusted residual values and adjusted individual p values (Bonferroni correction), at the low level of school-based child-friendliness (CFI_school = 1), there was significantly higher car usage than expected by chance, conversely significantly lower PT usage than expected by chance both to and from school, with no significant difference in AT usage (p < 0.0056). By contrast, at the high level of child-friendliness (CFI_school = 3), both to and from school, there was significantly lower car usage than expected by chance and significantly higher PT usage than expected by chance; however, no significant difference was found for AT usage (p < 0.0056). There were no differences in the travel modes at the medium (CFI_home = 2) level of child-friendliness (Table A-4).
5. Discussion
The results from the spatial analysis demonstrated that children’s travel modes to and from school vary depending on the degree of child-friendliness in their home-based and school-based local environments with higher car usage and lower non-car usage for children living or attending a school in an area with a relatively lower level of child-friendliness.
The CFI in this study combines measures of the social and built environment which are associated with child-friendly, sustainable mobility. The combination of such correlates in a single index and its effectiveness in promoting sustainable modes of transport in accessing schools aligns with the recognition of the multifaceted changes that are required to counteract the dominance of cars in children’s mobilities. Against the background of the high proportion of short car trips in accessing schools, it is evident that proximity alone does not translate to a sustainable “school journey”, as the private car usage remains high regardless of the distance. The use of composite indices such as the CFI described here can prove useful in assessing the performance of children’s local environments in enabling the conversion of these short car trips to non-car modes and in actualising the proximity-related affordances. The CFI also expands our understanding of the complexities of travel patterns and the importance of addressing children’s specific needs and rights to use sustainable modes of transport as it represents a shift from the stand-alone objective-based guidelines (e.g. proximity to school) to a set of minimum standard-based guidelines. It offers an alternative technique to assess the performance of neighbourhoods and school catchments from the point of view of accessibility for children, a critical factor in achieving the widely but loosely defined concept of “local school”, the centrepiece of all local living policies (Gilbert and Woodcock Citation2022). The reliance on simplistic proximity-based approaches in local living policies is unlikely in the majority of instances to achieve meaningful outcomes because the complexities of achieving a “local school” involve so many more factors. Examples of these problematic approaches can be seen in way the “school travel plans” required in many Australian states for new schools have highly ambitious active travel mode shares but are produced independently from the land use, transport planning and urban design schemes for the new housing estate catchments the schools are to serve. For instance, the traffic report for Sydney Olympic Park new high school indicates a target of 73% for active transport mode (New South Wales Government Citation2024), noticeably higher than the Australian and New South Wales averages (e.g. around 25%).
By contrast the CFI proposed here specifically considers the factors at stake in affording sustainable accessibility for children in neighbourhoods and school catchment areas, enhances our understanding of the multidimensional factors that make a “local school” and provides concrete pointers towards the specific actions and interventions required to increase the likelihood of achieving such schools.
The index can also be applied to the catchments of other daily destinations for children, such as venues for extra-curricular activities, in supporting the idea that it is critical to develop clear and precise policies aiming to create a wider range of environments within the sustainable transport reach of children. This will constitute an important step toward the recognition of children’s rights to sustainable transport (Whitzman et al. Citation2010, Gilbert Citation2019) when accessing their daily destinations and much-needed attention to non-instrumental enablers and constraints (Gilbert et al. Citation2022). Foregrounding child-friendliness requires considering what might be referred to as the “agglomeration effects” of certain combinations of land use and sustainable transport that impact the decision-making contexts for children’s school journeys, and all the other activities in children’s lives where they ought not to be dependent on cars to engage with them.
Complementing other indices such as the school walkability index developed by Giles-Corti et al. Citation2011 and by Christiansen et al. Citation2014, which are associated with increased rates of active transport, the CFI captures additional factors, including various demographic variables, cycling and public transport accessibility, which all influence children’s everyday mobilities. The CFI can also be linked to other conceptually driven frameworks that assess neighbourhoods from the health and wellbeing point of view, such as the Neighbourhood Early Childhood Development Framework developed by Badland and colleagues (Citation2023).
Despite the rigorous selection and analysis of the measures in developing the CFI, the index can be further improved and expanded to include additional measures: the more elements an index has, the greater potential there is for different aspects of performance to be analysed for the effects on children’s mobility patterns, and the more useful it is likely to be for policymakers, planners and urban designers. For example, the analysis of fine grain fabric of the built environment, including factors such as intersection density, ratio of T-intersections to crossroads, street widths, prevalence of pedestrian crossings (and by type), safe cycling infrastructure, the cleanliness of public places (e.g. sweeping schedules for specific areas), more fine-grained data on active frontages relative to total street length, actual non-residential land use diversity and data to indicate the provision of soft edges, footpath widths and conditions, street trees, shading and weather protection that promote further foot traffic and increased passive surveillance from well-used public spaces.
To enhance the accuracy of the CFI, future considerations could include assigning weights to individual factors within it. For example, given the evidence around the significance that parents attribute to “personal and traffic safety”, future iterations of the CFI could benefit from not only assigning greater weight to safety measures such as the volume and speed of vehicle traffic, the condition and distribution of footpaths and bike lanes and presence of safe crossings but also take into account community perceptions of safety as evidenced through media reporting and opinion surveys about the places in question (te Brömmelstroet Citation2020).
In relation to the use of crash statistics in developing the CFI, the underlying assumption was that fewer crashes meant relatively safer environments for pedestrians and cyclists. However, this assumption does not consider the possibility of the subject location being extremely dangerous and therefore being avoided by pedestrians and cyclists. Because crash statistics databases rely on police officer generated reports, it is important to acknowledge the inherent biases within these crash datasets, particularly concerning the underreporting of the number and types of injuries sustained by non-car users (Poulos Citation2015 Shinar Citation2018, Oxley Citation2020,). Future studies could use an approach where the crash dataset is checked against the datasets on a range of built environment variables such as traffic volume, vehicle speed, and provision of footpaths and bike lanes. Furthermore, future studies assessing the social and spatial determinants of private car usage in transporting children to their everyday destinations could benefit from the use of the CFI in investigating differences in socio-economically advantaged and disadvantaged areas.
A note of caution must be sounded, however. While the rise of urban analytics based on digital data has greatly enabled certain types of policy-relevant knowledge about cities to be gained, there are other trends and countervailing forces when it comes to the potential to create “local schools”. For example, the neoliberal ideology of “choice” that increasingly dominates education, and in particular primary and secondary schools tends to change the spatial dynamics of mobility and land use distribution in ways that may greatly complicate the ability to plan the creation of more integrated sustainable mobility environments for children. For example, the expansion of the independent school sector to cater to demands for greater “choice” has been shown to result in increased travel to school distances and accordingly, journeys by car (Yan et al. Citation2019). In the state school sector, selective entry programmes could have similar effects. Likewise, the proliferation of ethno-religious independent schools that are an increasing element of contemporary multicultural Australia form part of this cohort. As the CFI specifically looks at neighbourhood characteristics at both ends of the home to school journey, no matter how spatially proximate or distant they are, it could also be deployed to better understand the extent to which such social dynamics are impacting the creation of child-friendly contexts in Australia and elsewhere.
6. Conclusions
As Kullman (Citation2010) puts it, a journey to school (or any other destination for a child) is more than simply transport as it offers many ways for children to relate to their everyday environments, including feelings of “self-possession” and as “an opportunity to make their own decisions” (p. 834). Similarly, children’s emotional and embodied engagements are not just with their destinations but with the various social, natural and built elements of their journeys (Porter et al. Citation2021). Integrated transport and planning policies and programmes that aim to create sustainable journeys to children’s everyday destinations such as schools have much to gain from a consideration of more all-encompassing metrics to assess the performance of these places in promoting sustainable mobility. The CFI could be a good starting point to de-emphasise instrumental aspects such as the use of proximity as a stand-alone objective and recognise the importance of other factors to unlock the full potential of “proximity”. Such an approach would also promote a move towards more elaborate solutions to complex problems such as the heavy reliance on cars when transporting children, require. The recognition of children’s right to access their daily destinations without being dependent on cars needs to be at the core of such approaches. By combining a myriad of factors that are required to create a child-friendly environment, the CFI serves as a crucial step towards displaying this recognition.
Acknowledgement
The first author also extends her gratitude to Andrew Allan, Carolyn Whitzman, Stephen Berry and Johannes Pieters for their supervision throughout this PhD project.
Disclosure Statement
No potential conflict of interest was reported by the author(s).
Additional information
Funding
Notes
1 Mesh blocks which contain between 30 and 60 dwellings, are the smallest geographical area defined by the Australian Bureau of Statistics (ABS) (ABS Citation2016)
2 301: National or State Highway, 302: Arterial road, 303: Sub-arterial road, 304: Collector road, 305: Local road, 309: Access road, 400: Pedestrian thoroughfare access
3 The function for “one tailed probability of the chi-squared distribution” in Excel (2010) [CHISQ.DIST.RT (z², deg_freedom)] is used for the calculation of these individually adjusted p values for each comparison (Carlberg Citation2011) and used to assess the statistical significance.
References
- Aliyas, Z., Lak, A., and Cloutier, M.-S., 2022. Emotional perceptions and barriers to Children's active school travel in low and high socio-economic neighbourhoods in Iran. Journal of transport & health, 26, 101483.
- Al Shammas, T., and Escobar, F., 2019. Comfort and time-based walkability index design: A GIS-based proposal. International journal of environmental research and public health, 16 (16), 2850.
- Australian Bureau of Statistics (ABS). 2016. ‘Census of population and housing: socio-economic indexes for areas (SEIFA), Australia’. Retrieved January 25, 2024, from https://www.abs.gov.au/ausstats/[email protected]/mf/2033.0.55.001.
- Australian Bureau of Statistics (ABS). 2021a. ‘2021 Census All persons’. QuickStats. Retrieved January 25, 2024 from https://www.abs.gov.au/census/find-census-data/quickstats/.
- Australian Bureau of Statistics (ABS). 2021b. ‘Census of Population and Housing: Transport data summary, 2021, Method of Travel to Work by State and Territory. Retrieved February 8, 2024 from https://www.abs.gov.au/statistics/industry/tourism-and-transport/transport-census/2021#data-downloads.
- Australian Bureau of Statistics (ABS). 2021c. ‘Type of educational institution attending’, 2021 Census All persons QuickStats. Retrieved July 16, 2023, from https://www.abs.gov.au/census/guide-census-data/census-dictionary/2021/variables-topic/education-and-training/type-educational-institution-attending-typp.
- Australian Urban Research Infrastructure Network (AURIN). 2019. The University of Melbourne 2011-2017.
- Badland, H., et al., 2023. An urban neighbourhood framework for realising progress towards the New Urban Agenda for equitable early childhood development. Children's geographies, ahead-of-print, 1–19.
- Bayart, C., et al., 2020. Young people and the private car: A love-hate relationship. Transportation research part D: transport and environment, 80, 102235.
- Beck, B., et al., 2016. Bicycling crash characteristics: An in-depth crash investigation study. Accident analysis & prevention, 96, 219–227.
- Behrens, T., et al., 2017. A profile of active transportation in Colorado public schools, 2014–2015. Journal of community health, 42 (1), 116–121.
- Bertolini, L., 2017. Planning the mobile metropolis : transport for people, places and the planet. London, England: Palgrave.
- Bertolini, L., and Le Clercq, F., 2003. Urban development without more mobility by Car? lessons from Amsterdam, a multimodal urban region. Environment and planning A: economy and space, 35 (4), 575–589.
- Broberg, A., and Sarjala, S., 2015. School travel mode choice and the characteristics of the urban built environment: The case of Helsinki, Finland. Transport policy, 37, 1–10.
- Bronfenbrenner, U., 1979. The ecology of human development : experiments by nature and design. Cambridge, MA: Harvard University Press.
- Brookfield, K., 2017. Residents’ preferences for walkable neighbourhoods. Journal of urban design, 22 (1), 44–58.
- Buck, C., et al., 2015. Objective measures of the built environment and physical activity in children: from walkability to moveability. Journal of urban health, 92 (1), 24–38.
- Bureau of Infrastructure, Transport and Regional Economics (BITRE), 2015. Traffic and congestion cost trends for Australian capital cities Information Sheet 74. Canberra.: BITRE.
- Bureau of Meteorology (BOM), 2024. Long-range weather and climate. Canberra.: Commonwealth of Australia.
- Carlberg, C.G., 2011. Statistical analysis: Microsoft Excel 2010. Indianapolis, Ind.: Que.
- Carver, A., Timperio, A., and Crawford, D., 2013. Parental chauffeurs: what drives their transport choice? Journal of transport geography, 26, 72–77.
- Chatterjee, S., 2005. Children's friendship with place: A conceptual inquiry. Children, youth and environments, 15 (1), 1–26.
- Chawla, L., 2002. Growing up in an urbanising world. London.: Earthscan.
- Chen, S.-Y., Feng, Z., and Yi, X., 2017. A general introduction to adjustment for multiple comparisons. Journal of thoracic disease, 9 (6), 1725–1729. doi:10.21037/jtd.2017.05.34.
- Christensen, P.M., et al., 2017. Children living in sustainable built environments : new urbanisms, new citizens. New York: Routledge.
- Christiansen, L.B., et al., 2014. School site walkability and active school transport - association, mediation and moderation. Journal of transport geography, 34, 7–15.
- Cortes-Morales, S., and Christensen, P., 2014. Unfolding the pushchair. children's mobilities and everyday technologies. Research on education and media, 6.
- Cucchiara, M.B., and Horvat, E.M., 2014. Choosing selves: the salience of parental identity in the school choice process. Journal of education policy, 29 (4), 486–509.
- De Meester, F., et al., 2014. Parental perceived neighborhood attributes: Associations with active transport and physical activity among 10-12 year old children and the mediating role of independent mobility. Bmc public health, 14 (1), 631–631.
- Dovey, K., and Pafka, E., 2020. What is walkability? The urban DMA. Urban Studies (Edinburgh, Scotland), 57 (1), 93–108.
- Easthope, H., and Tice, A., 2011. Children in apartments: implications for the compact city. Urban policy and research, 29 (4), 415–434.
- Easton, S., and Ferrari, E., 2015. Children's travel to school—the interaction of individual, neighbourhood and school factors. Transport policy, 44, 9–18.
- Frank, L.D., et al., 2010. The development of a walkability index: application to the Neighborhood Quality of Life Study. British journal of sports medicine, 44 (13), 924–933.
- Freeman, C., 2010. Children's neighbourhoods, social centres to ‘terra incognita’. Children's geographies, 8 (2), 157–176.
- Fyhri, A., et al., 2011. Children's active travel and independent mobility in four countries: Development, social contributing trends and measures. Transport policy, 18 (5), 703–710.
- Garrard, J. 2009. Active transport: Children and young people. VicHealth <www.vichealth.vic.gov.au>.
- Garrard, J. 2016. Walking, riding or driving to school: what influences parents’ decision making?, Literature review prepared for the South Australian Department of Planning, Transport and infrastructure, September 2016. Retrieved May 28, 2022, from https://dit.sa.gov.au.
- Gilbert, H., et al., 2018a. Children's everyday freedoms: Local government policies on children and sustainable mobility in two Australian states. Journal of transport geography, 71, 116–129.
- Gilbert, H., 2019. Children’s rights in local government transport policies: getting It right through shifting conventions. State of Australian cities national conference 2019, Perth, Australia.
- Gilbert, H., et al., 2022. Understanding the complexity of children's everyday mobilities: non-instrumental aspects in sustainable transport and planning policy making in Australia. Applied Mobilities, ahead-of-print, 1–20.
- Gilbert, H., Allan, A., and Pieters, J., 2018b. Families, children and car: the environmental cost of chauffeuring children. Paper presented at australasian transport research forum, 30 October - 1 November 2018 Darwin, Australia.
- Gilbert, H., and te Brömmelstroet, M., 2023. Our culturally maladaptive transport discourses are continuing to fail our children. Children's geographies, 1–8. doi:10.1080/14733285.2023.2270444.
- Gilbert, H., and Woodcock, I., 2022. Local living and travel time based urbanism. Urban policy and research, 40 (4), 304–320.
- Giles-Corti, B., et al., 2011. School site and the potential to walk to school: The impact of street connectivity and traffic exposure in school neighborhoods. Health & Place, 17 (2), 545–550.
- Gilliland, J., et al., 2019. Is active travel a breath of fresh air? Examining children's exposure to air pollution during the school commute. Spatial and spatio-temporal epidemiology, 29, 51–57.
- Gómez-Limón, J.A., Arriaza, M., and Guerrero-Baena, M.D., 2020. Building a composite indicator to measure environmental sustainability using alternative weighting methods. Sustainability (Basel, Switzerland), 12 (11), 4398.
- Greco, S., et al., 2019. On the methodological framework of composite indices: A review of the issues of weighting, aggregation, and robustness. Social indicators research, 141 (1), 61–94.
- Jackson, J. 2019. ‘Choosing a school for your kid? Here’s how other Australian parents do it’, The Conversation. Retrieved May 27, 2022, from https://theconversation.com/choosing-a-school-for-your-kid-heres-how-other-australian-parents-do-it-126011.
- Jacob, V., et al., 2021. Economics of interventions to increase active travel to school: A community guide systematic review. American journal of preventive medicine, 60 (1), e27–e40.
- Jensen, O.B., 2013. Staging mobilities. New York: Routledge.
- Keall, M., et al., 2020. Implications of attending the closest school on adolescents’ physical activity and car travel in Dunedin, New Zealand. Journal of transport & health, 18, 100900.
- Kottyan, G., et al., 2014. Assessment of active play, inactivity and perceived barriers in an inner city neighborhood. Journal of community health, 39 (3), 538–544.
- Kullman, K., 2010. Transitional geographies: making mobile children. Social & cultural geography, 11 (8), 829–846.
- Kwan, M.-P., 2012. The uncertain geographic context problem. Annals of the association of American geographers, 102 (5), 958–968.
- Larouche, R., 2018. Children's active transportation. Amsterdam, Netherlands: Elsevier.
- Leslie, E., et al., 2007. Walkability of local communities: Using geographic information systems to objectively assess relevant environmental attributes. Health & Place, 13 (1), 111–122.
- Liao, B., et al., 2020. Empirical analysis of walkability using data from The Netherlands. Transportation research part D: transport and environment, 85, 102390.
- Lin, E.-Y., et al., 2017. Social and built-environment factors related to children's independent mobility: The importance of neighbourhood cohesion and connectedness. Health & Place, 46, 107–113.
- Loon, J.v., and Frank, L., 2011. Urban form relationships with youth physical activity. Journal of planning literature, 26 (3), 280–308.
- Malone, K., and Rudner, J., 2017. Child-friendly and sustainable cities : exploring global studies on children's freedom, mobility, and risk. In: C. Freeman, P. Tranter, and T. Skelton, eds. Risk, protection, provision and policy. Singapore: Springer Reference, 345–370.
- McMillan, T. 2013. Children and Youth and Sustainable Urban Mobility, Thematic study prepared for Global Report on Human Settlements 2013 Retrieved June 2, 2022, from http://www.unhabitat.org/grhs/2013.
- Moudon, A.V., et al., 2006. Operational definitions of walkable neighborhood: theoretical and empirical insights. Journal of physical activity and health, 3 (s1), S99–S117.
- New South Wales Government. 2020. Statistics – Road Crash Analysis. Retrieved January 18, 2020, from https://roadsafety.transport.nsw.gov.au/statistics/index.html.
- New South Wales Government. 2024. Sydney Olympic park new high school, traffic report – Transport Access Impact Assessment 2021. Retrieved February 2, 2024 from https://www.planningportal.nsw.gov.au/major-projects/projects/sydney-olympic-park-new-high-school.
- Oakil, A.T.M., Manting, D., and Nijland, H., 2016. Dynamics in car ownership: the role of entry into parenthood. European journal of transport and infrastructure research, 16 (4.
- Oktay, D., 2004. Urban design for sustainability: A study on the Turkish city. International journal of sustainable development & world ecology, 11 (1), 24–35.
- Oliver, M., et al., 2015. Associations between the neighbourhood built environment and out of school physical activity and active travel: An examination from the Kids in the City study. Health & Place, 36, 57–64.
- OpenStreetMap (OSM). 2018. OpenStreetMap - Lines (Australia) 2018. Retrieved, July 2, 2019, from https://portal.aurin.org.au/.
- Oxley, J., et al. 2020. Understanding pedestrian crashes in Victoria, Victoria Walks, Melbourne, July 2020.
- Pallant, J. F. (2011). SPSS Survival Manual : a step by step guide to data analysis using SPSS (4th ed.). Crows Nest, NSW: Allen & Unwin.
- Porter, L., Spark, C., and de Kleyn, L., 2021. Navigating the neighbourhood: gender, place and agency in children's mobility. Children's geographies, 19 (3), 339–350.
- Poulos, R.G., et al., 2015. An exposure based study of crash and injury rates in a cohort of transport and recreational cyclists in New South Wales, Australia. Accident analysis & prevention, 78, 29–38.
- PSMA Australia Limited. 2019. PSMA Street Network (August 2018). Retrieved July 6, 2019, from https://portal.aurin.org.au/.
- Ramanathan, S., et al., 2014. Happiness in motion: emotions, well-being, and active school travel. Journal of school health, 84 (8), 516–523.
- Ridgewell, C., Sipe, N., and Buchanan, N., 2009. School travel modes: factors influencing parental choice in four Brisbane schools. Urban policy and research, 27 (1), 43–57.
- Rothman, L., et al., 2014. Influence of social and built environment features on children walking to school: An observational study. Preventive medicine, 60, 10–15.
- The Royal Children’s Hospital National Child Health Poll. 2019. Travelling to school: Habits of Australian families. Poll number 13. The Royal Children’s Hospital Melbourne, Parkville, Victoria.
- Sallis, J.F., et al., 2006. An ecological approach to creating active living communities. Annual review of public health, 27, 297–322.
- Schoeppe, S., et al., 2013. Associations of children's independent mobility and active travel with physical activity, sedentary behaviour and weight status: A systematic review. Journal of science and medicine in sport, 16 (4), 312–319.
- Sharpe, S., and Tranter, P., 2010. The hope for oil crisis: children, oil vulnerability and (in)dependent mobility. Australian planner, 47 (4), 284–292.
- Shinar, D., et al., 2018. Under-reporting bicycle accidents to police in the COST TU1101 international survey: Cross-country comparisons and associated factors. Accident analysis & prevention, 110, 177–186.
- SRTS (Safe Routes to School). 2023. The decline of walking and bicycling. SRTS guide. Retrieved July 24, 2023, from http://guide.saferoutesinfo.org/introduction/the_decline_of_walking_and_bicycling.cfm.
- The State Government of Victoria. 2019. Traffic Signals 2019. Retrieved July 7, 2019, from https://portal.aurin.org.au/.
- Swain, R., et al., 2023. Children's and parents’ perceptions on safe routes to schools: a mixed-methods study investigating factors influencing active school travel. Journal of urban design, ahead-of-print (ahead-of-print), 1–23.
- te Brömmelstroet, M., 2020. Framing systemic traffic violence: Media coverage of Dutch traffic crashes. Transportation research interdisciplinary perspectives, 5, 100109. doi:10.1016/j.trip.2020.100109.
- Van Kann, D.H., et al., 2015. The association between the physical environment of primary schools and active school transport. Environment and behavior, 47 (4), 418–435.
- van Loon, J., et al., 2014. Youth physical activity and the neighbourhood environment: examining correlates and the role of neighbourhood definition. Social science & medicine, 104, 107–115.
- Veitch, J., et al., 2017. What predicts children's active transport and independent mobility in disadvantaged neighborhoods? Health & Place, 44, 103–109.
- Waygood, E.O.D., et al., 2017. Transport and child well-being: An integrative review. Travel behaviour and society, 9, 32–49.
- White, M., et al., 2021. Exploring the balance between movement and place in designing safe and successful places, iMOVE. Sydney, NSW: CRC and Transport for NSW.
- Whitzman, C., Worthington, M., and Mizrachi, D., 2010. The Journey and the Destination Matter: Child-Friendly Cities and Children's Right to the City. Built Environment (London. 1978), 36 (4), 474–486.
- Williams, G.C., Borghese, M.M., and Janssen, I., 2018. Objectively measured active transportation to school and other destinations among 10–13 year olds. International journal of behavioral nutrition and physical activity, 15 (1), 11–11.
- Wind, S., et al., 2012. Paving the road from transport models to “new mobilities” models. Paper presented at the trafikdage proceedings from the annual transport conference at Aalborg university.
- Woolley, H., and Johns, R., 2001. Skateboarding: The city as a playground. Journal of urban design, 6 (2), 211–230.
- Yan, Y., Burke, M., and Leung, A., 2019. Travel behaviour differences between private and public-school students in South East Queensland. Paper presented at Australasian Transport Research Forum 2019, 30 September – 2 October, Canberra.
APPENDIX
Table A-1. Databases for each variable used.
Table A-2. Pearson’s chi-square test results for travel mode to/from school and distance.
Table A-3. Pearson’s chi-square test results for travel mode to and from school (AT, PT and car) on day of data collection (reported by children) and child-friendliness (home-based)
Table A-4. Pearson’s chi-square test results for travel mode to school (AT, PT and car) on day of data collection reported by children and child-friendliness (school-based).