
Abstract
This paper describes the purpose, design and implementation of a new regional-scale geodetic network that has been installed in the Surat Basin, Queensland, and completed in November 2014. The network incorporates 65 survey marks and 40 radar corner reflectors to enable the combination of Global Navigation Satellite System measurements with remotely sensed surface deformation maps derived using the Interferometric Synthetic Aperture Radar technique. The combination of these geodetic techniques in this region will bring an enhanced understanding of how resource extraction affects the ground surface.
本文介绍了一种2014年11月安装在昆士兰州昆士兰州苏拉特盆地的新的区域规模的大地测量网络的目的、设计和实施。网络集成65个测量标志和40个雷达角反射器,以便将全球导航卫星系统的测量与遥感地表形变图综合起来,后者通过使用干涉合成孔径雷达技术而取得。在该区域综合运用大地测量技术将有助于进一步了解资源提取如何影响地面。
INTRODUCTION
Internationally, we rely on the Earth's crust to provide mineral, energy and water resources to support an evolving and growing society. Increasingly, we are also looking to use the crust as a repository for hazardous waste products that we generate such as radioactive waste and carbon dioxide. As extraction continues, it becomes increasingly important to have an understanding of the remaining resources in addition to the evolving storage capacity of the crust in order to secure sustainable, ethical and low-cost resourcing for our society. To this end, the Australian Government invested $23 million in 2010 to develop an Australian Geophysical Observing System (AGOS) infrastructure through funding from the Education Investment Fund (EIF) Round 3. Administered by AuScope Ltd, the purpose of AGOS is to enable collection of new baseline data including surface geospatial and subsurface imaging and monitoring data, to provide an understanding of the physical state of the accessible crust of the Australian continent, particularly focussed on emerging energy issues. Geoscience Australia (GA) has been responsible for implementing the AGOS geospatial observatory, which features:
A geodetic survey mark network, including co-located radar corner reflectors, to enable the precise measurement of surface deformation at a regional scale using Interferometric Synthetic Aperture Radar (InSAR) and Global Navigation Satellite System (GNSS) techniques.
Four high-precision GNSS continuously operating reference station (CORS) monuments installed at Mitchell (Queensland), King Island (Tasmania), Blinman (South Australia) and at the Murchison Radio Observatory, Boolardy (Western Australia). These supplement 101 more GNSS CORS funded by a National Collaborative Research Infrastructure Strategy (NCRIS) award to AuScope.
A robotic GNSS antenna calibration facility; the only one of its kind in the southern hemisphere.
A deployable pool of GNSS instruments for episodic campaign surveys in Australia. This includes 80 GNSS instruments, 10 ionospheric receivers and three Real Time Kinematic (RTK) kits.
An open-access repository of Synthetic Aperture Radar (SAR) data acquired by the ‘European Remote-sensing Satellite’ (ERS) satellites over the Australian territory, suitable for InSAR analysis to detect ground surface deformation.
Geodetic networks comprising discrete surface observation sites are essential for determining a coordinate reference system at any scale, be it at the jurisdictional level, nationally or globally. Collectively, these coordinate systems provide the fundamental datum with which all other geospatial datasets can be referenced. The Geocentric Datum of Australia 1994 (GDA94; ICSM Citation1998) is the official Australian coordinate system that underpins all geospatial activity in Australia including surveying, mapping and remote sensing. Implemented in 1995 by the Intergovernmental Committee on Surveying and Mapping (ICSM), and adopted as the national datum in 2000, GDA94 is a static geospatial referencing system defined initially on a network of eight GNSS CORS that are considered to be geologically stable across Australia. The static nature of the datum means that GDA94 coordinates remain unchanged with time despite ongoing tectonic motion of the Australian Plate (Altamimi et al. Citation2011), intra-continental deformation (Watson et al. Citation2010; Tregoning et al. Citation2013) and natural and anthropogenic deformation processes evident at the local and regional scales (e.g. Dawson et al. Citation2008; Featherstone et al. Citation2012). With an increasing societal demand for improved positioning for geospatial applications, the ICSM are currently undertaking research towards the implementation of the next Australian geodetic datum, which is anticipated to incorporate time-variable coordinates. The inclusion of regional-scale crustal deformation models in addition to the well-defined plate movement model for Australia is key to ensuring this new datum meets the requirements of all users (Dawson & Woods Citation2010).
Following recent densification, the national GNSS CORS network maintained by GA now contains 121 stations with a mean minimum station spacing of ∼209 km (and a standard deviation of 181 km). Where there is local- or regional-scale crustal deformation occurring at spatial scales of less than 200 km (e.g. owing to resource extraction in a sedimentary basin) it is likely that this deformation will not be sampled by a GNSS CORS, and therefore the coordinate system will be inaccurate in regions affected by such deformation. Complementary geodetic networks covering localised deforming regions are therefore crucial for enabling the widespread accuracy of any new national datum. In the modern era of multi-constellation satellite geodesy and remote sensing, geodetic networks are also used exclusively as an observatory for monitoring dynamic deformation of the Earth's surface. For instance, the Plate Boundary Observatory, a network of over 1000 GNSS CORS sites in the western USA, is designed to measure the complex tectonic strain field on the margin of the North American and Pacific plates. Surface deformation can also occur when resources are extracted from the Earth's crust, although no geodetic networks have been established in Australia that span an entire sedimentary basin and all the extraction activities that exist within it. Although a CORS network provides the most accurate observations of surface movement, they are expensive to construct and require ongoing maintenance. Therefore, a regional high-density geodetic network will usually make use of permanent survey marks that can be re-observed periodically during campaign GNSS surveys.
In this paper, we describe the design of the new regional AGOS geodetic network that has been established in the northern Surat Basin, Queensland, Australia. This geodetic network spans the full east-to-west extent of the Surat Basin in Queensland and contains 65 permanent GNSS survey marks with the innovative inclusion of 40 radar corner reflectors co-located at a subset of the survey mark sites. The purpose of the new geodetic network is to enable the combination of traditional ground network-based geodetic techniques (such as GNSS) with modern remotely sensed surface deformation maps derived using the InSAR technique to yield temporal estimates of regional scale surface deformation with millimetre-to-centimetre level accuracy and spatial resolution on the order of 100 m.
RESOURCE EXTRACTION IN THE SURAT BASIN
The Surat Basin is a large (∼300 000 km2) Jurassic–Cretaceous age basin that occupies southern Queensland and northern New South Wales (Exon Citation1976). The Middle Jurassic Walloon Subgroup contains shallow coal beds that have been found to have sufficient unconventional gas content (i.e. gas trapped throughout a formation rather than concentrated in a structural trap) to be economically viable (Scott et al. Citation2007). Production of coal seam gas from the Walloon Subgroup coal beds began in January 2006 from the Kogan area of the Darling Downs of Queensland (∼50 km west of Dalby), typically from between 300 and 600 m depth (Queensland State Government Citation2015). By the time of the 2013–2014 Australian fiscal year, production from the Surat Basin had grown to 166 Petajoules (Queensland State Government Citation2015). With proved and probable (2P) reserves of over 32 000 Petajoules (Queensland State Government Citation2015) the Surat Basin is the largest onshore reserve of gas in Australia (Geoscience Australia and BREE Citation2012). Therefore, the Surat Basin represents a significant energy resource for Australia and production could increase in the future.
In order to extract gas from the coal beds, a well is drilled into the coal seam, and a large volume of groundwater (on the order of megalitres per annum) is pumped out in order to reduce pressure in the formation and allow the gas to desorb from the coal. It is generally understood that extracting groundwater from the subsurface can result in surface subsidence (i.e. lowering of the ground surface) owing to the compaction of susceptible layers within the aquifer after the pressure is lowered (Galloway & Burbey Citation2011). In the case of an impermeable coal bed, well stimulation techniques such as hydraulic fracturing may be used to increase gas production. Hydraulic fracturing involves injection of a fluid into the formation that could potentially result in ground surface uplift, similar to the situation observed in carbon capture and storage projects when CO2 is injected (e.g. Onuma & Ohkawa Citation2009). However, because of the permeability of the Walloon Subgroup, to date well stimulation has generally not been used in the Surat Basin.
It is possible to map the spatial patterns of subsidence induced by groundwater and other fluid extraction on a regional scale using space-based InSAR techniques (e.g. Fielding et al. Citation1998; Galloway et al. Citation1998; Schmidt & Bürgmann Citation2003; Bell et al. Citation2008) and even to predict aquifer-system behaviour using these measurements (Chaussard et al. Citation2014; Reeves et al. Citation2014). The magnitude of subsidence will depend on the specific conditions in a basin, and so for this reason, the impacts of groundwater extraction in the Surat Basin (and other gas-producing basins and aquifers in Australia) are poorly known. Understanding the temporal and spatial evolution of surface movement is an important constraint on what is happening at depth, but can also help develop our understanding of the environmental impacts of extraction. For instance, differential subsidence could change the local surface slope morphology and thus impact on established patterns of surface water runoff. Furthermore, patterns of vertical movement can indicate the pathways taken by subsurface fluids and therefore lead to better-targeted extraction well locations. It is therefore expected that the AGOS geodetic network could contribute to enhanced resource production and better environmental management in the Surat Basin.
SITE SELECTION
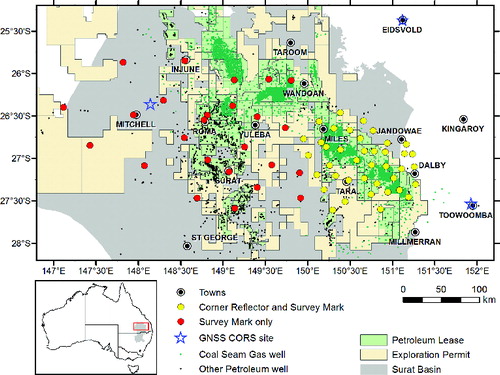
Initial geodetic site locations were identified by a desk-top study based on the access, site security and land-use, as well as providing a good spatial sampling of the expected pattern of ground deformation in the region. In the Darling Downs, between Dalby and Miles, existing gas production wells are concentrated in a NW–SE oriented band approximately 30 km wide (). Predictions of surface deformation based on homogenous poroelastic modelling and projected hydraulic draw-down indicate a long-term vertical deformation signal on the order of a decimetre (Brown et al. Citation2014). The time period of this signal is unknown and will vary spatially depending on local gas production rates. The spatial pattern of deformation has a wavelength of around 100 km that correlates with the location of the production wells. We therefore sought to locate geodetic sites at around 20 km spacing to fully sample this signal and also to locate sites where deformation is not expected.
Figure 1 Distribution of 65 new geodetic sites in southern Queensland and locations of three nearby GNSS CORS sites at Mitchell, Eidsvold and Toowoomba. Also plotted are land parcels designated as petroleum leases for production and exploration permits for petroleum, coal seam gas (CSG) wells and other petroleum wells (these data obtained on 11 December 2014 from the Queensland State Department of Natural Resources and Mines’ ‘Queensland Globe’ service). Background grey shading indicates the spatial extent of the Surat Basin.
In order to establish an understanding of the reconnaissance and installation costs, the first phase of the project was confined to the Darling Downs region. Contractors were engaged in February 2014 to undertake field evaluation, land access and cultural heritage clearances for the sites identified in the initial desktop study. Almost immediately, the contractor, responsible for site evaluations and land access, encountered resistance from local landowners, citing ‘stakeholder fatigue’ as the primary reason for their resistance. This was largely due to previous sustained engagement with the resource extraction industry, which was seeking access to property to establish coal seam gas infrastructure. Based on this feedback, the focus of the site location activity changed to utilise the vast road reserve network, including proposed road corridors.
Once the initial site selection and evaluation were completed, the spatial locations of the proposed sites on private land and road reserves were sent to the Queensland State Department of Natural Resources and Mines for querying against the Queensland Heritage Register. This was in order to determine the proximity of each site to already-known cultural heritage features and to identify the Aboriginal groups on whose native-title claim the sites were located. Additionally, all Aboriginal groups were sent a Notice (pursuant to section 24KA of the Commonwealth of Australia Native Title Act, 1993) that provided details of the project and gave the registered native title claimants the opportunity to make a submission or comment. For the Western Downs area, the principal Aboriginal group were the Barunggam People, represented by the Warner and Daylight family groups. Representatives from GA and the cultural heritage consultants met with the representatives of the Barunggam People to provide an overview of the project and to request assistance in discharging GA's responsibilities under the Queensland State Government Aboriginal Cultural Heritage Act Citation2003 Duty of Care Guidelines (‘the Guidelines’; ACHA Citation2003). The first outcome of these discussions was the recognition that a Cultural Heritage Management Plan (CHMP) between GA and the Barunggam People would be required for the AGOS project. A CHMP is an agreement that establishes the mechanisms by which the proponent (in this case GA) will use to avoid harm to cultural heritage identified by the Barunggam People during the project. The CHMP was successfully negotiated by the parties and came into effect on 24 March 2014.
The second outcome of the discussions was the classification of the installation of radar corner reflectors as either a Category 4 or 5 activity under the Guidelines (ACHA Citation2003; pp. 8–10). Therefore, further investigation of the potential cultural heritage impact of the project was required. The spatial locations of the 40 proposed sites for co-located corner reflectors and survey marks were made available to the technical advisor appointed by the Barunggam People. The desktop assessment performed by the technical advisor identified that 15 of the 40 proposed sites had a moderate to high probability of impacting cultural heritage. This meant that an initial cultural heritage assessment (ICHA) of these sites would be required. This ICHA was undertaken in May 2014 by a representative from the Warner and Daylight families, the technical advisor and a representative from GA. The ICHA was able to clear all 15 sites for installation of AGOS infrastructure.
Once the cultural heritage clearances for all corner reflector (and survey mark) sites in the Western Downs region were completed, the land access agreements with each of the participating landowners were finalised. The agreement determined the specific location of the corner reflector and survey mark that would be installed, and the terms and conditions of access for the installation activities and subsequent observations.
At the completion of this first phase of the project, funding was available for a further 25 survey mark-only sites located to the west in the South West region of Queensland. Gas-production wells in the South West region are currently concentrated to the northeast of Roma in three distinct areas (). The site spacing in the second phase was increased to around 40–50 km in order to achieve the widest coverage across the Surat Basin including regions where gas production is not currently occurring or has recently begun. Based on the lessons learned from the land access for the first 40 sites, the new sites were primarily located on road reserves and public land adjacent to several regional airports (e.g. Roma, Mitchell and Morven), and on private land where a willing landowner was identified through property visits or cold calling. With only survey marks being installed on these 25 sites, the potential impact of installation on cultural heritage was re-assessed, based on legal advice provided to GA, as Category 2 (Activities causing No Additional Surface Disturbance) under the Guidelines (ACHA Citation2003, p. 7). This meant that GA could proceed with the site selection and installation without the need for a CHMP with the Aboriginal groups, providing that these sites were located on areas where ground disturbance had already occurred (e.g. grazed paddocks and existing road corridors).
Construction of the geodetic network was completed on 21 November 2014. The positions of the 65 geodetic sites in the network are shown in , and the GDA94 positions (with heights referenced to the GRS80 ellipsoid) of each survey mark and corner reflector are listed in the Supplementary Paper. Additionally, we describe the survey methods used to determine the positions in the Supplementary Paper. In the constructed geodetic network, 38 sites were established on private property with the remaining 27 sites located on road reserves administered by the State of Queensland. Forty co-located survey mark and corner reflector sites are concentrated in a 150 km × 150 km area in the Darling Downs region of the Surat Basin with a site spacing of 10–30 km. An additional network of 25 survey mark sites extends further west in the South West region to the western margin of the Surat Basin with an increased spacing of 30–70 km. One of the four previously mentioned AGOS GNSS CORS was established within the geodetic network near to Mitchell, Queensland with data logging commencing on 9 April 2014. The next closest GNSS CORS are located approximately 80 km east and 150 km northeast of the geodetic network at Toowoomba and Eidsvold, respectively ().
SURVEY MARK DESIGN
Permanent survey marks for the AGOS geodetic network were designed to adhere to the recommendations laid out by the ICSM (Citation2014a, Citationb). Sites with a 360° unobstructed sky view 10° above the horizon were chosen. At a small number of sites where obstructions were unavoidable, the survey mark was placed to the north of that obstruction, since no GNSS satellites are in the sky to the south in an arc governed by the orbital inclinations.
Ideally, each survey mark should be directly coupled to stable in situ rock outcrops that are just above or below the ground surface. However, in order for the geodetic network to effectively sample spatial patterns of deformation at the basin scale, survey marks must also be located within the soil profile of the sedimentary basin. Vertosols are the dominant soil type in the northern Surat Basin. This soil type (commonly termed ‘black soils’) exhibits shrink-swell properties that could impart a signal correlated with changing moisture patterns on to surface-mounted survey marks. This shallow-soil signal component will imprint on any signal originating from the crust and will ensure that the overall geodetic signal measured on these survey marks will not uniquely tell us about deformation processes in the crust. The survey mark for installation in the soil profile was therefore designed to minimise the effect of shallow-soil signals and is specified as follows ().
Figure 2 (a) Engineering drawing of the soil-profile survey mark design. Dimensions in millimetres. (b) Installed soil profile survey mark at Site 8 with valve box lid removed.
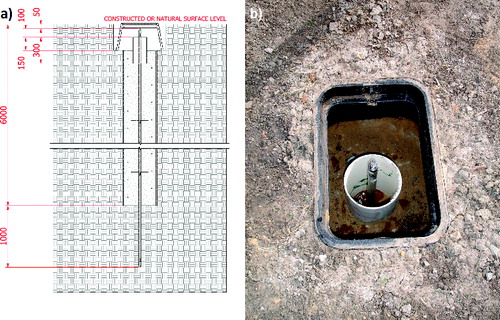
A hole of 450 mm diameter was drilled to a depth of 6.0 m below the ground surface unless bedrock or indurated material was reached at a shallower level. Survey mark hole depths are given in the Supplementary Paper. This hole was then sleeved to within 300 mm of the ground surface with a continuous section of PN6 PVC pressure pipe with external diameter of 400 mm. The gap between the pipe and hole excavation was in-filled with washed sand. A 25 mm diameter stainless steel rod (assembled from 2.0 m, 1.0 m, 0.5 m and 0.2 m lengths) was driven into the centre of the excavated hole to a refusal depth of at least 1.0 m for soil or at least 200 mm into indurated material depending on the resistance. Where bedrock was encountered rather than indurated material, the rod was secured into a hole drilled in the bedrock to a depth of up to 250 mm using epoxy mortar. At all sites, the verticality of the stainless steel rod was measured using both a staff level and screw-on bubble level to ensure consistency of the verticality tolerance across the network. A reinforcement cage was inserted into the hole to provide horizontal stability to the stainless steel rod and to help maintain the structural strength and integrity of the concrete. The hole was then filled with pre-mixed concrete with a compressive strength of 32 MPa after 28 days. A 300 mm length of smaller 265 mm-diameter PVC pressure pipe was secured into the upper 150 mm of the hole. This short length of pipe was kept free of concrete in order to allow unimpeded access to the length of stainless steel rod housed within (see b). The top 300 mm of the hole was further excavated to accommodate a valve box cover with its top surface flush with the ground surface.
At two sites (30 and 33), bedrock exists at the surface, and a different survey mark design was installed (). In the bedrock design, a 12 mm threaded rod was secured with epoxy mortar into a drilled hole in the bedrock to a depth of at least 250 mm. Three 6 mm levelling screws were also secured into the bedrock, and used to level the exposed instrument disc with reference to a bubble level temporarily screwed on to the centralised thread of the instrument disc. Following levelling, the three levelling screws are locked with nuts and cut off to the level of the disc.
Figure 3 (a) Engineering drawing of bedrock survey mark design. Dimensions in millimetres. (b) Installed bedrock survey mark at Site 30 with attached instrument holder and GNSS antenna during a survey (the pink length of rod is an additional component of the particular GNSS antenna model used here).
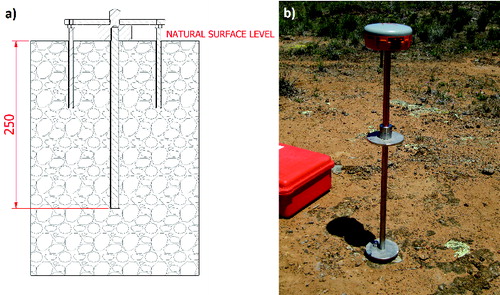
A removable instrument holder was also designed that will be used to attach a GNSS antenna to the in situ survey mark during campaign measurements (see b). The instrument holder consists of a 500 mm rod that elevates the antenna above the ground surface and an adaptor ring that can be rotated to ensure the antenna is appropriately oriented (i.e. in the north direction). By elevating the GNSS antenna above the ground the impact of multi-path signal interference owing to the reflection of radio waves from the ground surface is reduced. The antenna connects to the instrument holder using a 5/8" British Standard Whitworth (BSW) thread, which is the standard in all surveying forced centrings, including GNSS instrumentation.
Each AGOS survey mark installed within the soil profile cost approximately $8000 (excluding GST). Each AGOS survey mark installed onto bedrock cost approximately $5000 (excluding GST).
CORNER REFLECTOR DESIGN
Corner reflectors were chosen as the most suitable radar target for deployment in the AGOS geodetic network. A corner reflector is a passive device that reflects incoming electromagnetic energy directly back to the source of that energy, similar to an optical reflecting prism. In the case of a trihedral corner reflector, this is facilitated by the bouncing of the incident wave from three mutually orthogonal plates. The orthogonality of all three plates ensures that the corner reflector resembles the corner of a cube (and hence the name ‘corner reflector’). Corner reflectors have traditionally been used as a target suitable for calibration of SAR images (Freeman Citation1992) but they are also popular as targets with a temporally stable phase response suitable for accurately measuring ground deformation using InSAR techniques (e.g. Hanssen Citation2001; Ketelaar Citation2009; Strozzi et al. Citation2013). Previous validation experiments have found that artificial reflectors can yield displacement estimates from Persistent Scatterer InSAR analysis with sub-millimetre accuracy in both vertical and east–west directions (Ferretti et al. Citation2007).
Through a prototyping exercise a single corner reflector design and size was sought that would provide a bright response in X-, C- and L-band SAR imagery and that would exhibit stable phase characteristics over long (nominally decadal) time periods for permanent deployment in the landscape (Garthwaite et al. Citation2015). Following this exercise, a triangular trihedral design with an inner-leg length (i.e. the non-hypotenuse edge of the right-angled isosceles triangle) of 1.5 m was chosen because of the relative simplicity of manufacture, long term structural rigidity, relative stability for large radar cross-section and a three decibel beamwidth of approximately 40° (Curlander & McDonough Citation1991). This last property ensures that the permanently deployed corner reflectors can be aligned in an average orientation for all orbiting SAR sensors (on either an ascending or descending orbital pass) yet the signal-to-noise ratio of the corner reflector response in SAR imagery for each sensor will still be high.
Corner reflector panels were manufactured from 6 mm aluminium sheet, with cross-braces of 6 mm-thick, 50 mm-width aluminium L-section to improve structural rigidity (). Particular care was taken through the manufacture and installation process to maintain the flatness of each panel and minimise surface irregularities that might adversely impact the reflective performance of the corner reflector. As such, the L-section cross-braces were attached to each panel using insert studs that sit flush on the reflective side of each panel. Each assembled panel was powder-coated matt grey in order to enhance the longevity of the panel and to reduce the impact of thermal expansion. Three almost-identical corner reflector panels are mounted to a stand manufactured from steel hollow section that has been welded together and then powder-coated. The design of the stand includes azimuth and elevation adjustability that enables 360° azimuth adjustment and base-plate elevations between 0 and 40° (with respect to local horizontality). This adjustment range ensures that once permanently deployed, the corner reflector can be oriented for most imaging modes of present and future SAR sensors regardless of its location within radar imaging swathes. Each AGOS corner reflector assembly (three almost-identical panels plus mounting stand) cost approximately $5400 (excluding GST) to manufacture.
Figure 4 (a) Engineering drawing of the 1.5 m triangular trihedral corner reflector (side-on view) and concrete slab design for construction in the soil profile. Dimensions in millimetres. (b) 1.5 m corner reflector installed at Site 26. Concrete slab dimension is 2 m square.
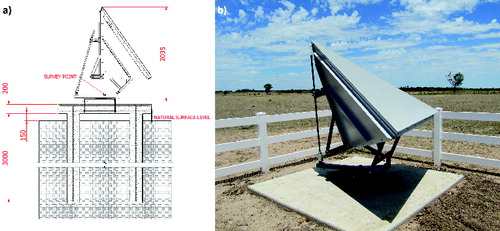
Corner reflectors were generally placed to the north of co-located survey marks with baseline lengths between 20 and 40 m to ensure the corner reflector does not encroach on the sky view of the survey mark. For sites installed into the soil profile a 200 mm thick, 2 m × 2 m suspended concrete slab supported on four 250 mm diameter PVC-cased concrete pillars was constructed. A centrally located reinforcing bar in the concrete pillars was tied to the reinforcing mesh within the slab, and concrete with a compressive strength of 32 MPa after 28 days was poured in one pour. All four pillars were required to be equivalent lengths up to 3.0 m and sitting on the same ground type. If bedrock was encountered at a depth shallower than 3.0 m, then the reinforcing bar was secured into the bedrock to a depth of 250 mm. Average depths for the four pillars at each site are given in the Supplementary Paper. The suspended slab is poured over collapsible formwork that will decompose over time to leave an air void between the slab and ground surface of 150 mm. The aim here is to isolate the corner reflector from the influence of shrinking and swelling in the shallow soil layer. After curing of the concrete, the sub-slab air void was blocked off using 300 mm-tall Compressed Fibre Cement sheeting to stop vermin gaining access to the void following formwork decomposition. The edges of the slab were then backfilled to a gentle slope using material from the hole excavation. At site 30, bedrock existed at the surface so the slab was poured directly on to the rock surface. In place of the four sub-surface concrete pillars, four 20 mm-diameter, 250 mm-deep holes were drilled into the rock into which a 16 mm reinforcing bar was secured with epoxy-mortar. These reinforcing bars were tied to the mesh layers within the slab. All slabs were poured so that one edge was oriented in the true north direction. The corner reflector assembly was secured to the slab by way of three 16 mm threaded rods that protruded above the slab surface and were connected to the bolt cage and reinforcing mesh set within the concrete.
At 33 sites, the corner reflectors were installed within a 5 m × 5 m fenced enclosure in order to protect them from interference by grazing livestock (and avoid injury to livestock caused by the sharp corners). The fences are manufactured from PVC in order to minimise their impact (if any) on the radar response of the corner reflector. Given that most corner reflectors are installed on a slab whose top surface is 350 mm above ground level and on a stand that supports the bottom panel a minimum of 535 mm above the slab, the 1.2 m high fence does not obstruct the sky view of the corner reflector whose boresight is elevated ∼35° above the bottom panel. The ground infrastructure for each corner reflector cost approximately $8200, excluding GST.
FUTURE USE OF THE GEODETIC NETWORK
The deployed network of corner reflectors and surrounding region will be imaged periodically by orbiting SAR satellites. These SAR images will be analysed using differential InSAR techniques to produce interferograms and subsequently yield deformation maps of the height change through time. Typical InSAR interferograms contain noise from a multitude of sources but with a dominant contribution from the atmosphere. Garthwaite et al. (Citation2013) found that the magnitude of noise is 20 mm or less in 48 out of a stack of 51 interferograms covering the Tibetan Plateau. When producing the deformation map the impact of noise is mitigated by ‘stacking’ multiple interferograms to reduce the variance of the noise by a factor proportional to the number of independent interferograms (Emardson et al. Citation2003). Given 20 mm of noise in the interferograms, 10 mm/yr of deformation could be resolved after 1.2 years of monthly SAR acquisitions, which increases to 1.6 years for 30 mm of noise (Emardson et al. Citation2003). Since InSAR is a differential technique, deformation maps are referenced relative to a particular acquisition epoch but not an absolute coordinate reference system. The network of co-located corner reflectors and survey marks will be used as the connection between the two to ensure that the absolute height of InSAR-derived products is accurate.
Annual campaign GNSS surveys will be conducted that observe all 65 AGOS survey marks (including the 40 co-located with corner reflectors). The first of these campaign surveys will be undertaken in 2015. Each survey mark will be occupied for a period of at least a week, which is a sufficient occupation length to reduce the height uncertainty to a few centimetres. Brockmann (Citation1997) derived relationships that can be used to estimate the precision of estimated velocities and coordinates from geodetic observations given defined measurement uncertainties. Importantly, these precisions are independent of the deformation rate and are proportional to the measurement uncertainty. Assuming linear deformation, a vertical measurement uncertainty of 0.1 m and our campaign strategy, the precision of the velocity estimation would drop below 1 mm/yr after six campaign occupations (i.e. 5 years). However, given that the magnitude of this height uncertainty is a worst-case scenario and not representative of all sites, this period can be considered an upper-bound on the time needed to achieve this precision from the new geodetic network. It should be noted that our defined campaign strategy gives a precision that is around 15% of that achievable from a CORS network (Brockmann Citation1997).
Observed data from the AGOS survey marks will be included in network adjustments with other survey marks and GNSS CORS to determine coordinates consistent with the new Australian national datum and heights with respect to a stable vertical reference frame (Bevis et al. Citation2013). The co-located corner reflectors will enable the accuracy of the determined three-dimensional coordinates to be propagated into the InSAR analysis. The geodetic surface observations combined in this way will then be used as a constraint to geophysical inversions that make inferences about the temporal evolution of the poroelastic properties of the Walloon Subgroup of the Surat Basin (e.g. Brown et al. Citation2014).
SUPPLEMENTARY PAPERS
Quality of reported positions
Supplementary Table Positions, corner reflector alignments and other associated information for the 65 new geodetic sites installed in the northern Surat Basin.
Collated_supp_material_2017.pdf
Download PDF (152.3 KB)ACKNOWLEDGEMENTS
This work was funded by the AuScope Australian Geophysical Observing System (AGOS) through funding from the Education Investment Fund (EIF) Round 3. The implementation of the AGOS geodetic network was a complicated project that could not have been achieved without the assistance of the following: AuScope Ltd; the Queensland State Department of Natural Resources and Mines, and Department of Transport and Main Roads; the Western Downs, Maranoa and Murweh regional councils; CS Energy, Linc Energy, Origin Energy, QGC, Santos and Yancoal; team members of the Geodesy Section, Geoscience Australia for many contributions to this work. We are grateful to the private landowners who agreed to host a geodetic site, and the traditional owners of the lands, in particular: the representatives of the Warner and Daylight families; the Barunggam People (all sites cleared for installation under a Cultural Heritage Management Plan established on 24 March 2014); the Iman People (all sites inspected and cleared for installation by an elder, Uncle Patrick, in September 2014); and the Mandandanji, Gunggari and Bigambul peoples (all sites installed under Duty of Care Category 2). McCall Consulting performed the site reconnaissance and secured land access, Mipec installed the survey marks and corner reflector slabs, J&H Williams manufactured the corner reflectors and Twin City Engineering manufactured the survey mark components. The paper was improved by the comments of Nicholas Brown, Anna Riddell and two anonymous reviewers. This paper is published with the permission of the CEO, Geoscience Australia.
Disclosure statement
No potential conflict of interest was reported by the authors.
Related Research Data
References
- ACHA. 2003. Aboriginal cultural heritage act 2003 duty of care guidelines. Queensland State Government Department of Aboriginal and Torres Strait Islander and Multicultural Affairs, Brisbane Qld
- Altamimi Z., Collilieux X. & Métivier L. 2011. ITRF2008: an improved solution of the international terrestrial reference frame. Journal of Geodesy 85, 457–473.
- Bell J. W., Amelung F., Ferretti A., Bianchi M. & Novali F. 2008. Permanent scatterer InSAR reveals seasonal and long-term aquifer-system response to groundwater pumping and artificial recharge. Water Resources Research 44, W02407.
- Bevis M., Brown A. & Kendrick E. 2013. Devising stable geometrical reference frames for use in geodetic studies of vertical crustal motion. Journal of Geodesy 87, 311–321.
- Brockmann E. 1997. Combination of solutions for geodetic and geodynamic applications of the Global Positioning System (GPS). Geodesy-Geophysics Arb. Schweiz 55, 211, Zurich Switzerland
- Brown N. J., Woods A. W., Neufeld J. A. & Richardson C. 2014. Constraining surface deformation predictions resulting from coal seam gas extraction. Geoscience Australia 2014/44, Canberra ACT.
- Chaussard E., Bürgmann R., Shirzaei M., Fielding E. J. & Baker B. 2014. Predictability of hydraulic head changes and characterization of aquifer-system and fault properties from InSAR-derived ground deformation. Journal of Geophysical Research: Solid Earth 119, 6572–6590.
- Curlander J. C. & McDonough R. N. 1991. Synthetic aperture radar systems and signal processing, John Wiley & Sons, Inc, New York NY.
- Dawson J., Cummins P., Tregoning P. & Leonard M. 2008. Shallow intraplate earthquakes in Western Australia observed by Interferometric Synthetic Aperture Radar. Journal of Geophysical Research: Solid Earth 113, B11408.
- Dawson J. & Woods A. 2010. ITRF to GDA94 coordinate transformations. Journal of Applied Geodesy 4, 189.
- Emardson T. R., Simons M. & Webb F. H. 2003. Neutral atmospheric delay in interferometric synthetic aperture radar applications: Statistical description and mitigation. Journal of Geophysical Research: Solid Earth 108, 2231.
- Exon N. F. 1976. Geology of the Surat Basin in Queensland. Bureau of Mineral Resources, Geology and Geophysics Bulletin 166, 0642019479, Canberra ACT.
- Featherstone W., Filmer M., Penna N. T., Morgan L. M. & Schenk A. 2012. Anthropogenic land subsidence in the Perth Basin: challenges for its retrospective geodetic detection. Journal of the Royal Society of Western Australia 95, 53–62.
- Ferretti A., Savio G., Barzaghi R., Borghi A., Musazzi S., Novali F., Prati C. & Rocca F. 2007. Submillimeter Accuracy of InSAR Time Series: Experimental Validation. IEEE Transactions on Geoscience and Remote Sensing 45, 1142–1153.
- Fielding E. J., Blom R. G. & Goldstein R. M. 1998. Rapid subsidence over oil fields measured by SAR interferometry. Geophysical Research Letters 25, 3215–3218.
- Freeman A. 1992. SAR calibration: an overview. IEEE Transactions on Geoscience and Remote Sensing 30, 1107–1121.
- Galloway D. L. & Burbey T. J. 2011. Review: regional land subsidence accompanying groundwater extraction. Hydrogeology Journal 19, 1459–1486.
- Galloway D. L., Hudnut K. W., Ingebritsen S. E., Phillips S. P., Peltzer G., Rogez F. & Rosen P. A. 1998. Detection of aquifer system compaction and land subsidence using interferometric synthetic aperture radar, Antelope Valley, Mojave Desert, California. Water Resources Research 34, 2573–2585.
- Garthwaite M. C., Nancarrow S., Hislop A., Thankappan M., Dawson J. H. & Lawrie S. 2015. Design of radar corner reflectors for the Australian Geophysical Observing System. Geoscience Australia, 2015/03, Canberra ACT.
- Garthwaite M. C., Wang H. & Wright T. J. 2013. Broadscale interseismic deformation and fault slip rates in the central Tibetan Plateau observed using InSAR. Journal of Geophysical Research: Solid Earth 118, 5071–5083.
- Geoscience Australia and BREE. 2012. Australian Gas Resource Assessment 2012. Geoscience Australia and BREE. <http://www.bree.gov.au/documents/publications/_other/gasresourceassessment.pdf>, Canberra ACT.
- Hanssen R. F. 2001. Radar interferometry. data interpretation and error analysis, Kluwer Academic Publishers, Dordrecht, the Netherlands.
- ICSM. 1998. Geocentric datum of Australia, technical manual. Intergovernmental Committee on Surveying and Mapping (ICSM), Canberra ACT.
- ICSM. 2014a. Guidelines for the Installation and Documentation of Survey Control Marks. Intergovernmental Committee on Surveying and Mapping, Permanent Committee on Geodesy (PCG) Special Publication 1, Canberra ACT.
- ICSM. 2014b. Standard for the Australian Survey Control Network. Intergovernmental Committee on Surveying and Mapping (ICSM), Permanent Committee on Geodesy (PCG) Special Publication 1, Canberra ACT.
- Ketelaar V. B. H. 2009. Satellite radar interferometry. subsidence monitoring techniques, Springer, Berlin Germany.
- Onuma T. & Ohkawa S. 2009. Detection of surface deformation related with CO2 injection by DInSAR at In Salah, Algeria. Energy Procedia 1, 2177–2184.
- Queensland State Government 2015. Queensland's petroleum and coal seam gas 2013–14. Department of Natural Resources and Mines. https://www.dnrm.qld.gov.au/__data/assets/pdf_file/.../petroleum.pdf, Brisbane Qld.
- Reeves J. A., Knight R., Zebker H. A., Kitanidis P. K. & Schreüder W. A. 2014. Estimating temporal changes in hydraulic head using InSAR data in the San Luis Valley, Colorado. Water Resources Research 50, 4459–4473.
- Schmidt D. A. & Bürgmann R. 2003. Time-dependent land uplift and subsidence in the Santa Clara valley, California, from a large interferometric synthetic aperture radar data set. Journal of Geophysical Research: Solid Earth 108, 2416.
- Scott S., Anderson B., Crosdale P., Dingwall J. & Leblang G. 2007. Coal petrology and coal seam gas contents of the Walloon Subgroup — Surat Basin, Queensland, Australia. International Journal of Coal Geology 70, 209–222.
- Strozzi T., Teatini P., Tosi L., Wegmüller U. & Werner C. 2013. Land subsidence of natural transitional environments by satellite radar interferometry on artificial reflectors. Journal of Geophysical Research: Earth Surface 118, 1177–1191.
- Tregoning P., Burgette R., McClusky S. C., Lejeune S., Watson C. S. & McQueen H. 2013. A decade of horizontal deformation from great earthquakes. Journal of Geophysical Research: Solid Earth 118, 2371–2381.
- Watson C., Burgette R., Tregoning P., White N., Hunter J., Coleman R., Handsworth R. & Brolsma H. 2010. Twentieth century constraints on sea level change and earthquake deformation at Macquarie Island. Geophysical Journal International 182, 781–796.