
Abstract
Multi-scale, multi-method integration of geological constraints, with new interpretations of potential field data and seismic reflection data, has resulted in a comprehensive structural interpretation of the southern Thomson Orogen, eastern Australia. The interpretation reveals ∼50 major faults and shear zones, many of which can be traced for several hundred kilometres. The interpretation suggests that the southern Thomson Orogen can be subdivided into several structural domains that can be distinguished by differences in: (i) spatial orientation, (ii) geographic distribution, and (iii) partly the timing of major faults, but also to varying degrees by (iv) the evolution and spatial orientation of other structural elements, such as folds, minor faults and fractures, (v) broader lithological trends, (vi) stratigraphy, and (vii) structural style. The two largest domains are the Western Structural Domain that contains numerous faults and shear zones, and the fold-dominated Eastern Structural Domain, which is more strongly affected by late- to post-Devonian thrusting than the Western Structural Domain. Notwithstanding their differences, the domains can be integrated into a coherent structural model for the southern Thomson Orogen, which suggests that the area represents a set of megafolds or oroclines, which may have formed during the Bindian Orogeny.
Introduction
The southern part of the Thomson Orogen is a key area for understanding the geological evolution of eastern Australia, where several major tectonic elements are juxtaposed: Delamerian, Lachlan, Thomson and New England orogens (). The status and evolution of the Thomson Orogen as a separate geological province within the Tasmanides of eastern Australia is a matter of much debate (see Glen, Citation2005 for a review). Points of controversy include the existence (or non-existence) of a major tectonic boundary between the Thomson and Lachlan orogens (Burton, Citation2010; Burton & Trigg, Citation2014; Glen et al., Citation2010, Citation2013; Glen, Poudjom Djomani, Belousova, Hegarty, & Korsch, Citation2014), the position of such a boundary (Scheibner & Basden, Citation1996), and the tectonic and geodynamic setting of the area within the Tasmanides (Abdullah & Rosenbaum, Citation2017; Burton, Citation2010; Champion, Citation2016; Fergusson & Henderson, Citation2015; Glen et al., Citation2013; Klootwijk, Citation2013; Moresi, Betts, Miller, & Cayley, Citation2014; Rosenbaum, Citation2018).
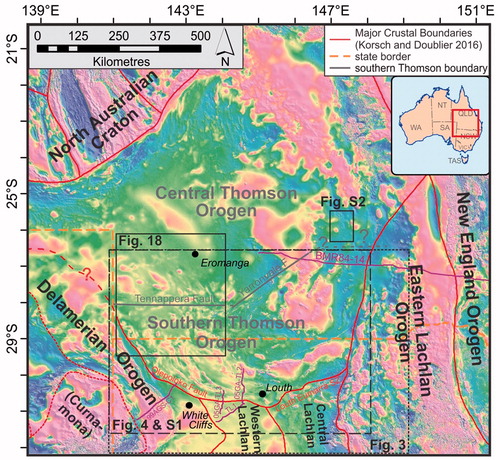
Figure 1. Overview of central eastern Australia showing the major crustal boundaries from Korsch and Doublier (Citation2016) on a semitransparent grey-scale 1VD RTP magnetic intensity image, draped on a Bouguer gravity image (cool colours indicate lower density); position of and Supplementary papers, Figures S1, S2 are shown. Also shown is the position of deep seismic reflection lines 05GA-TL1, 05GA-TL2, 05GA-TL3, 99AGS-C1 and BMR84-14.
A comprehensive discussion of this topic requires a holistic assessment of all geological data, which is beyond the scope of this paper. However, we note that previous models are based on structural arguments (e.g. Burton, Citation2010) or have implications for the structural evolution of this key area in regard to timing, geometry and kinematics of the structural elements (e.g. Cayley, Citation2015; Klootwijk, Citation2013). Such information is poorly documented for wide parts of the southern Thomson Orogen.
To provide new insights into the structural evolution of the area, we describe, interpret and synthesise the structural elements of the southern Thomson Orogen through a multi-method, scale-integrated approach. Drawing on previous work and new interpretations we present (i) the large-scale crustal architecture; (ii) an interpretation of the (meso-scale) major fault structures of the area; (iii) a subdivision into several domains, which are defined and described based on their structural elements; and (iv) the overarching structural frame. Although we refer to certain aspects of the structural evolution through time, the emphasis here is on the description of the geometries observed. The tectono-metamorphic evolution of the southern Thomson Orogen, including a major new dataset of 40Ar–39Ar and K–Ar geochronology, will be presented elsewhere.
Geological setting
Tasmanides
The Tasmanides of eastern Australia are an orogenic system formed by the breakup of Rodinia and the following subduction and accretion processes along the eastern margin of Gondwana from the late Neoproterozoic to the early Mesozoic (Cawood, Citation2005; Champion, Citation2016; Glen, Citation2005, Citation2013). The system as a whole is driven by (repetitive) cycles of trench retreat and advance (Collins, Citation2002), and deformation, magmatism and stratigraphy show a broad younging trend towards the east. The Tasmanides are subdivided into five orogens (Delamerian, Thomson, Lachlan, Mossmann and New England; Glen, Citation2005; Rosenbaum, Citation2018), which have been affected to varying degrees by six major orogenic events (; Shaanan, Rosenbaum, & Sihombing, Citation2018): the ca 515–490 Ma Delamerian Orogeny (Foden, Elburg, Dougherty-Page, & Burtt, Citation2006, Greenfield, Citation2010), the ca 460–425 Ma Benambran Orogeny (e.g. Collins & Vernon, Citation1992; Glen, Meffre, & Scott, Citation2007a), the ca 420–406 Ma Bindian Orogeny, the ca 400–380 Ma Tabberabberan Orogeny, the ca 360–340 Ma Kanimblan Orogeny (Collins & Vernon, Citation1992; Fergusson, Citation2017; Glen, Citation2005), and the ca 260–230 Ma Hunter-Bowen Orogeny (Fergusson, Citation1991; Holcombe et al., Citation1997).
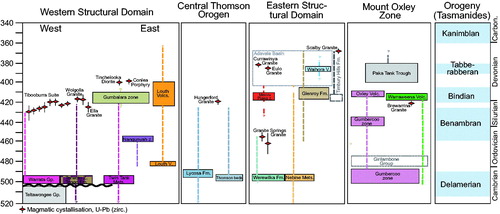
Figure 2. Time–space plot for the southern Thomson Orogen divided into domains and regions, showing the major units. The plot is simplified after Purdy et al. (Citation2018), to whom we also refer for a compilation of geochronological constraints. The stratigraphy is dominated by a Cambrian to Ordovician metasedimentary package and an upper Silurian to Lower Devonian package of metasedimentary and volcanic rocks. Also displayed is the timing of the major orogenies of the Tasmanides (see text for details).
The main structural grain of the Tasmanides runs north–south but is disrupted by east–west-trending structural corridors such as the Thomson–Lachlan boundary (Glen et al., Citation2013), which has been linked to plate boundary segmentation processes (; Abdullah & Rosenbaum, Citation2017). To the south of the Thomson–Lachlan boundary, the northern part of the Lachlan Orogen can be subdivided into three sub-provinces, which are bounded by major structures (; e.g. Glen, Citation2013). The boundary between the Delamerian Orogen and the western sub-province of the Lachlan Orogen is imaged in deep seismic reflection data as the west-dipping Moyston Fault (Cayley et al., Citation2011). The boundary between the western and central sub-province is the Paddington Line and its southern continuation the Bootheragandra Fault (Glen, Clare, & Spencer, Citation1996), which is imaged in deep crustal reflection seismic as a west-dipping structure (Korsch & Doublier, Citation2016). The Gilmore Fault Zone and its northern extension represent the boundary to the eastern sub-province of the Lachlan Orogen (e.g. Glen, Citation2013), which contains the Macquarie Volcanic Belt (Glen et al., Citation2002; Quinn, Percival, Glen, & Xiao, Citation2014).
Southern Thomson Orogen
Major crustal boundaries
The following description of the southern Thomson Orogen largely adapts the boundaries proposed by Glen et al. (Citation2013) and Korsch and Doublier (Citation2016), but we refer to Scheibner and Basden (Citation1996) and Burton (Citation2010) for alternative interpretations.
The boundary between the southern Thomson Orogen and the Lachlan Orogen is located in northern New South Wales (NSW) and represented by a major structural break (or structural discordance) in the form of a ∼400 km broadly east–west-trending zone (; Abdullah & Rosenbaum, Citation2017). The north-trending main structural grain of the Lachlan Orogen of NSW terminates along this discordance and is juxtaposed against a broadly east–west-oriented structural grain adjacent to the north in the Thomson Orogen. This regional configuration is delineated in magnetic images (). To the west of Louth, NSW, it coincides with a steep gravity gradient (Glen, Poudjom Djomani, Korsch, Costello & Dick, Citation2007b; Murray & Kirkegaard, Citation1978; Stevens, Citation1991). This break is discrete and is known as the Olepoloko Fault (Glen et al., Citation2013; Stevens & Crawford, Citation1992). To the west of White Cliffs, NSW, the Olepoloko Fault progressively swings into a north-northwest trend and represents the boundary between the (southern) Thomson Orogen and the Koonenberry Belt of the Delamerian Orogen (; Greenfield, Musgrave, Bruce, Gilmore, & Mills, Citation2011).
Figure 3. 3D crustal architecture of the southern Thomson and northern Lachlan orogens looking north (from Doublier, Brennan, Korsch & Nicoll, Citation2016), illustrating the geometries of the major crustal boundaries of the area. Also shown are deep seismic reflection lines 05GA-TL1, 05GA-TL2, 05GA-TL3, 99AGS-C1 and BMR84-14. Green, Moyston Fault northern extension; yellow, Paddington Line; blue, Gilmore Fault and unnamed northern extension; orange, Olepoloko Fault; white, Bancannia Shear Zone and extension. The grey surface and corresponding colour bar represent the Moho depth (km).
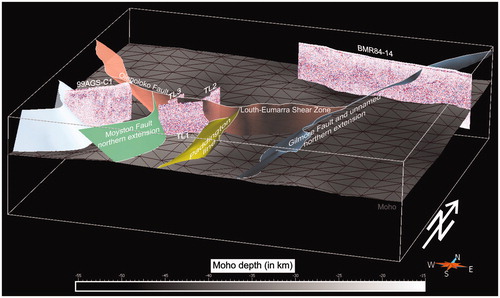
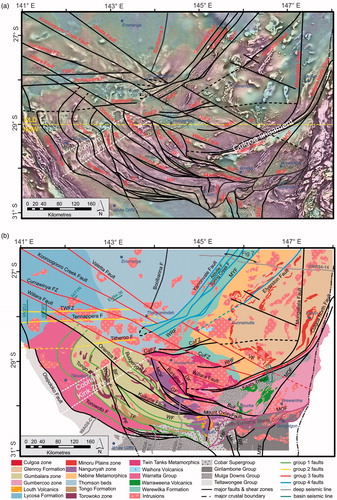
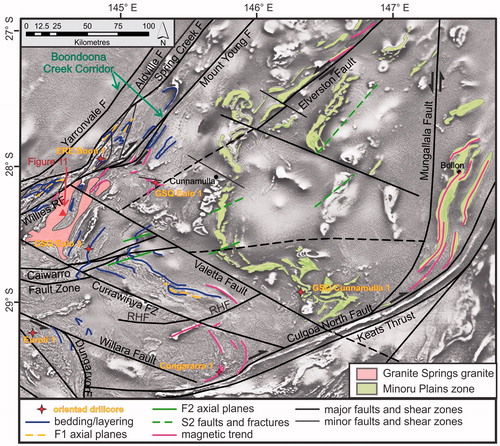
Figure 4. Interpretation of the major faults and shear zones shown on: (a) a semitransparent grey-scale 1VD RTP magnetic intensity image draped on a Bouguer gravity image (cool colours indicate lower density); and (b) a simplified basement geology map of the southern Thomson Orogen (after Purdy et al., Citation2018) with the positions of deep crustal and basin seismic reflection lines illustrated in the paper. BF: Bundarra Fault; CaFZ: Caiwarro Fault Zone; CuFZ: Currawinya Fault Zone; DF: Dungarvon Fault; GF: Gumbalie Fault; GuF: Gundabooka Fault; LMF: Little Mountain Fault; MDF: Mount Druid Fault; MOF: Mount Oxley Fault; MYF: Mount Young Fault; MTF: Mulga Tank Fault; MF: Myrt Fault; PF: Purnanga Fault; RF: Rookery Fault; RHF: Rose Hill Fault; TF: Tongo Fault; TWFZ: Tooley Wooley Fault Zone; VF: Valetta Fault; WRF: Willies Range Fault; WF: Wuttagoona Fault.
To the east of Louth, the structural break is accommodated by the ∼30 km wide east-northeast-trending Louth-Eumarra Shear Zone ( Glen et al., Citation1996), a zone which underwent complex polyphase deformation, and as a whole is interpreted as a major dextral shear zone (Dunstan, Rosenbaum, & Babaahmadi, Citation2016), although a sinistral kinematic has also been proposed (Glen et al., Citation1996). Glen et al. (Citation2010) proposed the southern Thomson Orogen boundary to follow the northern margin of the Louth-Eumarra Shear Zone, corresponding to the Mount Oxley Fault in the eastern part (). Further to the west, Glen et al. (Citation2010, Citation2013) suggested the Little Mountain Fault (labelled as LMF, ) as the boundary.
The eastern boundary between the southern Thomson Orogen and the eastern sub-province of the Lachlan Orogen is ambiguous in potential field data but has been interpreted from deep seismic reflection line BMR84-14 () as a crustal-scale, west-dipping fault (Korsch & Doublier, Citation2016), broadly coinciding with the Foyleview Geosuture (Finlayson et al., Citation1990). In plan view, this structure continues to the south where it is interpreted to link with the Gilmore Fault (Korsch & Doublier, Citation2016).
The boundary between the southern and central Thomson Orogen is not a major structure. The term southern Thomson Orogen is defined here as the southern part of the Thomson Orogen with comparably shallow overburden of the Eromanga Basin, an area characterised by high-frequency magnetic data that allows for a more detailed interpretation of the basement geology (). Although the increase in overburden is gradational rather than discrete, we define the central Thomson as the area north of a structural corridor defined by the Tennappera Fault in the west, and the Yarronvale Fault to the east ( and ). North of the deep seismic reflection line BMR84-14 the boundary is poorly defined and inferred to trend east–west.
Crustal architecture
The geometry of major crustal boundaries in the southern Thomson region is imaged by several deep seismic reflection lines (e.g. Glen et al., Citation2013). When combined with 2 D linework in plan-view () and interpolated away from the seismic profiles (Doublier et al., Citation2016), interpretation of these seismic profiles allows construction of a 3 D model of the crustal architecture of the southern Thomson and northern Lachlan orogens (). The position of some of the major crustal boundaries is not well constrained, reflected in a low confidence weighting in their interpretation presented by Korsch and Doublier (Citation2016). This applies for example to the northern extension of the Moyston Fault (e.g. Korsch, Barton, Gray, Owen, & Foster, Citation2002), which the 3 D model shows with an easterly dip. It is interpreted to represent the boundary between the Delamerian Orogen and the western sub-province of the Lachlan Orogen, truncated by the Olepoloko Fault. Further to the east, the west-dipping Paddington Line (e.g. Glen et al., Citation1996) marks the boundary with the central Lachlan sub-province. The Louth-Eumarra Shear Zone is interpreted to abut the northern extension of the Gilmore Fault.
Regional geology
The regional geology of the southern Thomson Orogen is described in detail in a companion paper by Purdy, Hegarty and Doublier (Citation2018), which presents an interpreted basement geology map used here in a simplified form () and a detailed discussion on the geochronology constraints on the basement stratigraphy and magmatism. The results are therefore only briefly summarised here, and the reader is referred to Purdy et al. (Citation2018) for further details.
Within the southern Thomson Orogen, two major stratigraphic packages are recognised ().
An upper Cambrian to Lower Ordovician metasedimentary package that is recognised throughout the southern and central Thomson Orogen. This package includes the Warratta Group, Lycosa Formation, Thomson beds, Werewilka Formation, Nebine Metamorphics, Twin Tanks Metamorphics, and, likely, elements of the Torowoko zone and Tongo Formation ().
A Lower to Middle Devonian package of volcanic and sedimentary units largely confined to the southern Thomson Orogen, formed by the Louth Volcanics, possibly the Glenroy Formation, the Warraweena Volcanics and parts of the Gumbercoo Zone. The latter two are located to the south of the Culgoa Lineament, a prominent, west-southwest-trending magnetic feature in the southeastern part of the southern Thomson Orogen ().
Other stratigraphic units of a more restricted extent include a Middle to Upper Ordovician metasedimentary rocks of the Nangunyah zone, and the Waihora Volcanics, which are Devonian or younger in age ().
The southern Thomson Orogen experienced several episodes of both S- and I-type granitic magmatism (): at ca 460 Ma, between ca 430 and 418 Ma, around ca 400 Ma, between 385 and 380 Ma, and around 370 Ma. Of these episodes, the Siluro-Devonian magmatism is the most significant in terms of areal extent and volume, as it comprises the large Hungerford Granite in the central southern Thomson Orogen () and is also recognised in the adjacent northern Lachlan Orogen (Champion, Citation2016).
The basement rocks are covered by several sedimentary basins, which vary in depth and extent, but are mostly weakly deformed to undeformed. These include the Devonian Adavale Basin and Paka Tank Trough, the Permian to Triassic Cooper Basin (Radke, Citation2009), and the Triassic to Cretaceous Eromanga Basin (Wecker, Citation1989). The latter forms part of the Great Artesian Basin and covers the entire central and southern Thomson Orogen, resulting in ≪1% of exposure in the southern Thomson Orogen.
Methods and approach
Reflecting the very poor exposure (≪1% of the area), the current understanding of the southern Thomson Orogen is largely informed by geophysical datasets, such as potential field and reflection seismic, and hence addresses predominantly the meso- to regional-scale (e.g. Abdullah & Rosenbaum, Citation2017; Spampinato, Ailleres, Betts, & Armit, Citation2015). The structural maps and descriptions of the southern Thomson Orogen presented here have been generated through multi-method integration of geological constraints with new interpretations of potential field data, available deep seismic reflection data, and industry seismic reflection data over the sedimentary basin cover.
This approach allowed us to constrain the positioning of major structures and to provide new information on their geometry (i.e. dip direction). The resulting line work of major faults complements our work on the basement geology of the southern Thomson Orogen (see Purdy et al., Citation2018) and provides a structural context. The interpretation approach used here is less conservative in the sense that it gives preference to the lateral continuity of faults and/or fault segments through areas where they are not well constrained. As this map aims to synthesise the major structures at regional scale, the line work has been slightly simplified through upscaling.
Potential field data
The structural interpretation has been guided by aeromagnetic data, mainly reduced to pole first vertical derivative (RTP1VD), total magnetic intensity (TMI), and tilt filter images, which allowed for the identification of structural trends, breaks and folds, complemented by gravity data (Bouguer and isostatic residual images). All of the data are available from the Geophysical Archive Data Delivery System (GADDS; at Geoscience Australia http://www.geoscience.gov.au/geophysical-data-delivery).
Geological information
Field observations from sparse outcrops such as Granite Springs, Queensland (Purdy et al., Citation2016), the Tibooburra Inlier, NSW (Brown & Vickery, Citation2010; Brown, Vickery, & Greenfield, Citation2006; Thalhammer, Stevens, Gibson, & Grum, Citation1998), and the Yancannia Formation ∼100 km to the southeast of Tibooburra (Wong, Collins, Hack & Huang, Citation2018), and basement drill cores, are integrated into the interpretation where available and relevant (see Purdy et al., Citation2018, for an overview of relevant drill cores and outcrop). Also included are 12 new basement drill cores collected in 2016 and 2017 in Queensland and NSW as part of the Southern Thomson Project collaborative stratigraphic drilling program between Geoscience Australia, the Geological Survey of New South Wales and the Geological Survey of Queensland (e.g. Roach et al., Citation2017), as well as two Geological Survey of Queensland cofunded industry drill cores. Some drill cores are oriented and these represent the only physical constraint on fabric orientation.
Deep seismic reflection data
Deep seismic reflection lines 05GA-TL2, 05GA-TL3 and parts of BMR84-14 have been re-interpreted using techniques described in Doublier et al. (Citation2015), which combine traditional hardcopy interpretation on large paper plots of both processed and field stack seismic images with interpretation in a digital (ArcGIS) environment. Care was taken implementing the position of structures interpreted from the potential field data into the seismic interpretation. Geoscience Australia seismic data are available from the Geoscience Portal (http://www.geoscience.gov.au/).
Basin seismic
In order to further constrain the position and orientation of major structures, public-domain basin seismic data, accessible through the state geological surveys, have been examined. The seismic data have been predominantly acquired for hydrocarbon exploration, e.g. in the Adavale Basin (Hoffmann, Citation1989) and the Cooper Basin (Radke, Citation2009). Basement structures are typically not directly imaged in basin seismic, because data acquisition and processing are optimised for basin geology, but also because only the uppermost part of the basement is imaged. Nevertheless, basement structures that are reactivated during or following basin deposition may be assessed via these basin seismic images. In these cases, it is possible to (i) locate the position of the basement structure at the basement–basin interface and (ii) gain information of the geometry of the reactivated structure.
The effect of these structures in the basin seismic data may be subtle, in particular if displayed with normal aspect ratio; however, displaying the data with high vertical exaggeration (a technique common in basin seismic interpretation) allows the structures to be mapped out in greater detail ().
Figure 5. Examples of basin seismic lines (see for locations) used to constrain the position and (apparent) dip direction of major faults (a) line 95GDJ (vertical exaggeration ∼2); (b) squeezed part of line 95GDJ imaging the Tennapera Fault and Tooley Wooley Fault Zone (vertical exaggeration ∼10); (c) line EH84-36 intersecting the Kooroogooro Creek Fault (vertical exaggeration ∼2); (d) line 95FWT showing reactivation of the Orientos and Willara faults. Note that the Tooley Wooley Fault Zone intersected at CDP ∼1500 is not reactivated in this line; and (e) line 84TYN showing the Currawinya Fault Zone with a minor back thrust. Basin seismic lines have been accessed via the Geological Survey of Queensland.
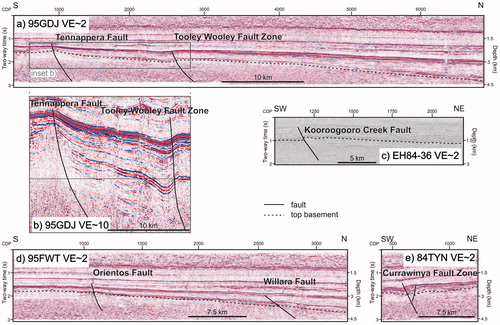
Using this approach, over 250 basin seismic lines, most located in Queensland, have been systematically assessed, and results have been used to constrain the position of major structures, with high precision in plan-view (), and to estimate an (apparent) dip direction ().
Table 1. Major faults of the southern Thomson Orogen.
Results
Major faults
Our interpretation shows that the southern Thomson Orogen contains a significant number of major faults and shear zones, many of which can be traced for several hundred kilometres, within the ∼700 × 500 km study area. These structures are displayed on potential field data (; Supplementary paper, Figure S1) and on a simplified basement geology map (; after Purdy et al., Citation2018). Complementary information such as the full names, geometry (where known), intersecting deep seismic lines and the datasets used for interpretation for each structure are provided in . Overall about 50 major structures have been identified; with very few exceptions, they have a length of at least 100 km, and many can be traced for over 200 km.
While care has been taken to establish and represent consistent cross-cutting relationships between structures, this has not always been possible. The main reasons include lack of constraining data in critical areas, or overprint through (segmental) reactivation.
There are several sets of structures that share major characteristics with respect to (i) spatial orientation, (ii) geographic distribution and (iii) in some cases timing. They have been grouped for ease of description ().
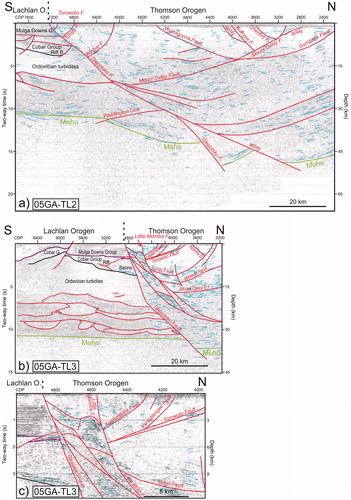
Structures assigned to Group 1 (green in ) are located in the western part of the southern Thomson Orogen and are largely confined to the Warratta Group and the Gumbalara and Nangunyah zones. Faults in this group are broadly subparallel and mimic the trend of the Olepoloko Fault. Most Group 1 structures are intersected by deep seismic reflection lines 05GA-TL2 and 05GA-TL3, where an integrated interpretation with the magnetic data suggest that structures dip southwards towards the north-dipping Olepoloko Fault, excluding the Wuttagoona Fault (). A set of somewhat smaller-scale, more closely spaced structures (Little Momba Fault, Keelambara Fault and Yantabangee Fault), not annotated in and , is also intersected by line 05GA-TL3, and is shown in greater detail in . The Little Momba Fault shows an apparent dip subparallel to the Olepoloko Fault and defines, together with the latter, a north-dipping corridor showing some lozenge-type shear zone and seismic reflection geometries. In the top 3 km of the crust, it marks the southern boundary of a more reflective package, the northern boundary of which is the Keelambara Fault. The Keelambara Fault and the Yantabangee Fault to the north are restricted to the uppermost crust and dip towards the south ().
Figure 6. Reinterpretation of deep seismic reflection lines (a) 05GA-TL2, (b) 05GA-TL3, and (c) detailed view of the Lachlan–Thomson boundary in line 05GA-TL3. Interpretation of the middle and upper crust in the Lachlan Orogen is after Glen et al. (Citation2013). See and for the position of seismic lines.
A set of three west-trending structures in the central western part of the map have been summarised under Group 2 (yellow in ). Owing to the increase in cover thickness and the related dampening of the high-frequency magnetic signal in the northwest part of the map area, but also owing to the masking effect of granitic intrusions and their contact aureoles, which are common within the corridor defined by Group 2 structures, these structures are less clear in magnetic images, but all are in part delineated by elongate plutons (; Supplementary papers, Figure S1).
Further constraint on the geometry of Group 2 structures is provided by several basin seismic reflection lines including line 95GDJ (see for location), which intersect the Tennappera Fault and the Tooley Wooley Fault Zone (). , with a vertical exaggeration of ∼10, allows for a more detailed interpretation and suggests a northerly (apparent) dip of both structures.
The northwest-trending Group 3 structures (red in ) extend under the deep cover of the Cooper and Eromanga basins in the northwest part of the map and are not intersected by deep seismic reflection lines. Similar to the majority of structures shown here, they do not represent surface structures, but the interpretation shows their position on the top of the basement as interpreted from magnetic and basin seismic data. Here, basin seismic data suggest an overall (apparent) dip towards the northeast (), although the geometry is not always well constrained (e.g. in the northwest part of the Kooroogooro Creek Fault; ).
Group 4 structures (blue in ) are located in the northeast part of the map area and show a northeast trend. Our reinterpretation of deep seismic reflection line BMR84-14 suggests that all but the Mount Young Fault have an apparent dip towards the east (). In the southwest part of the Group 4 structures, in the vicinity of the Granite Springs Granite (), there is evidence for dextral ductile shearing (Abdullah & Rosenbaum, Citation2017). Further to the northeast, the seismic data also show significant thrusting along some of these structures (e.g. Aldville Fault; ), with throws of at least 1 s two-way-time (TWT; ∼3 km) prior to deposition of the Eromanga Basin. This thrusting controls the distribution of remnants of Devonian basins such as the Cooladdi Trough () and likely represents reactivation of pre-existing ductile shear zones.
Figure 7. Westernmost part of deep seismic reflection line BMR84-14 (see for location) showing the upper crustal configuration of the Group 4 major faults defining the Boondoona Creek Corridor.
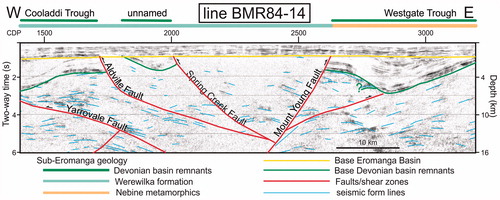
Figure 8. Structural interpretation of the ESD on grey-scale 1VD RTP magnetic intensity image (white corresponds to high magnetic intensity); see for position; RHF: Rose Hill Fault.
Other major structures have not been assigned to groups, largely to avoid potentially misleading timing connotations. A set of such structures with west-northwest to northwest trends is intersected by the northern part of line 05GA-TL2 (). Some of these structures (Orientos Fault, Kulkyne Fault; ) have the same apparent dip as the Olepoloko Fault. Others show an antithetic relationship, including the south-dipping Mount Oxley Fault, which is a major regional structure that other faults are interpreted to sole into. Further east, the Mount Oxley Fault is interpreted to continue as a major structure and represents the northern margin of the Louth-Eumarra Shear Zone (). Together with the eastern Mount Oxley Fault, several east- to northeast-trending structures (purple in ) collectively form the Louth-Eumarra Shear Zone (Glen et al., Citation1996), a complex dextral shear zone (Dunstan et al., Citation2016), the northern margin of which marks the southern boundary of the southern Thomson Orogen (Glen et al., Citation2010).
To the north of line 05GA-TL2, the dips of the Burkano Fault and the Dungarvon Fault (labelled as DF) are unconstrained, but there is evidence for sinistral dragging of magnetic bodies along the latter (Abdullah & Rosenbaum, Citation2017; ).
Structural elements
Complementing the major faults, an interpretation of other structures such as folds and minor faults and fractures has been carried out in selected areas (see for positioning). This serves to illustrate the structural elements at the mesoscale in different parts of the southern Thomson Orogen. For contextualisation, and to avoid duplication, description of these maps has been integrated into the discussion below.
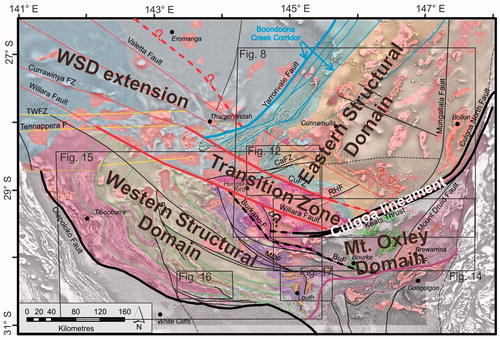
Figure 9. Composite image of basement geology of the southern Thomson Orogen and RTP TMI magnetic data showing the structural domains of the southern Thomson Orogen and their proposed boundaries (thick lines); same legend as . Also shown is the position of . BuF: Burkano Fault; CaFZ: Caiwarro Fault Zone; CuFZ: Currawinya Fault Zone; MOF: Mount Oxley Fault; RHF: Rose Hill Fault; TWFZ: Tooley Wooley Fault Zone.
Discussion
Structural domains
A systematic geographical variation of structural trends is apparent when comparing the different groups (and unassigned structures) described above (). The variation is mirrored by differences in the large-scale map pattern delineated by the main lithological trends and contacts, and the spatial distribution of the main stratigraphic units ( Purdy et al., Citation2018). This allows subdivision of the southern Thomson Orogen into different litho-structural domains, which as detailed below show differences in their structural style, fold pattern and deformation history. The recognition and definition of these domains is important, as they represent the first-order reference framework for understanding the tectono-metamorphic history (and differences therein) of the southern Thomson Orogen. After a brief definition of these domains and their boundaries, their main characteristics are described in greater detail below. As there is a lack of absolute timing constraints, the assignment of structures to deformation events (i.e. F1, F2) throughout this discussion should be considered local only, and these events do not necessarily correlate between different structural domains.
The two largest domains are the ‘Eastern Structural Domain’ (ESD) in the northeast and the ‘Western Structural Domain’ in the southwest (WSD; ), which are separated by the west-northwest-trending corridor referred to as ‘Transition Zone’ (TZ). The ESD is bounded by the Yarronvale Fault in the northwest and the Culgoa North Fault in the southeast (). The domain is recognised by predominantly northeast-trending geology and structural grain, as delineated, for example, by the Group 4 structures (blue in ), in addition to a megascopic fold structure. In contrast, the WSD is characterised by stratigraphic boundaries, major structures, and the axial planes of tight mesoscopic folds that broadly mimic the trend of the bounding Olepoloko Fault, and major northeast-trending structures are rare ().
In the northwest part of the map area (i.e. north of the Tennappera Fault), the increase in cover thickness and the consequent dampening of the high-frequency content in the magnetic data make it difficult to map out domains with confidence. Nevertheless, broad northwest-oriented magnetic trends are akin to the WSD (; Supplementary papers, Figure S1).
In the southeast, the smaller Mount Oxley Domain (MOD) is bounded by the northern margin of the Louth-Eumarra Shear Zone in the south (). The boundary with the WSD is not discrete and is tentatively assigned to the Burkano Fault. The MOD contains the Devonian Paka Tank Trough and exhibits some large-scale northeast-trending geology such as the orientation of the southern occurrence of the Warraweena Volcanics and the Mount Druid Fault, setting it apart from the adjacent WSD. The northern boundary of the MOD is the Keats Thrust ( and ), which we interpret as the southern bounding fault of the Culgoa Shear Zone, contains the Culgoa Lineament (e.g. Glen et al., Citation2010). Although the Culgoa Lineament does not represent a structural domain sensu stricto, it is a distinct feature in the geology of the southern Thomson Orogen.
Culgoa Lineament and Culgoa Shear Zone
The Culgoa Lineament is a < 5 km wide, east-northeast-trending, highly magnetic feature that can be traced for at least 280 km. Borehole intercepts indicate a range of rock types including magnetite quartzite and schist in the more coherent central and eastern part, and calcsilicate rocks and (serpentinised) pyroxenite further to the west (see Purdy et al., Citation2018, and references therein).
From a structural point of view, the Culgoa Lineament forms part of a structural corridor/shear zone with a width of 5–10 km that we refer to as Culgoa Shear Zone. It is intersected by upper crustal seismic line DMR98-02, which indicates an apparent northerly dip down to a depth of ∼10 km (; Abdullah & Rosenbaum, Citation2017; Hegarty & Doublier, Citation2015). The northern margin of the Culgoa Shear Zone is mapped as the Culgoa North Fault and is characterised by dextral dragging of high-frequency magnetic features, which rotate into a subparallel trend in proximity to the fault (). The dragging is observed at least 10 km into the hanging wall, indicative of an overall semi-ductile to ductile deformation style ().
Figure 10. Interpretation and potential field modelling of seismic line DMR98-02 transecting the Culgoa Shear Zone and the Paka Tank Trough (after Hegarty & Doublier, Citation2015). Numbers in the lower panel correspond to density (upper, in gm/cm3) and magnetic susceptibility (lower, in SI) values used for the modelling. See and for position of seismic line DMR98-02.
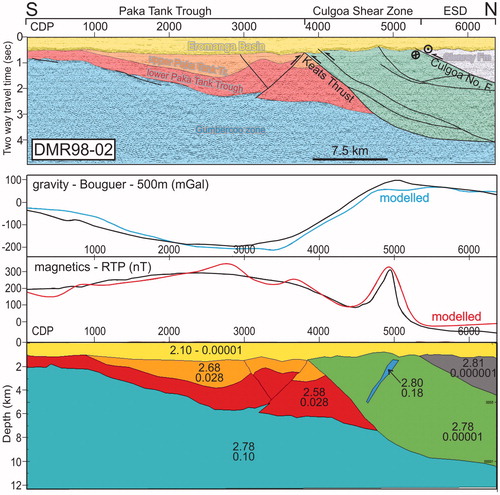
This contrasts with the Keats Thrust (Fitzpatrick, Johnson & Associates, Citation1965), which represents the southern boundary of the Culgoa Shear Zone. In seismic line DMR98-02 () it is imaged as a top-to-the-south listric thrust fault, along which rocks of the Culgoa Zone and the ESD further to the north are thrust onto the diagenetic grade Devonian Paka Tank Trough. The thrusting may be syndepositional (Abdullah & Rosenbaum, Citation2017), or later, in which case the initial growth fault would have been exhumed by the thrusting and eroded (). An argument for the latter is a pop-up structure between common depth points (CDP) 3000 and 3800, which could be related to post-depositional thrusting. In each case, the Keats Thrust likely represents an upper crustal, brittle structure, consistent with the observation that the contact with the Gumbercoo Zone, which underlies the Paka Tank Trough, shows no evidence for (ductile) strike-slip kinematics in magnetic images ().
In summary, it is possible that the Culgoa Shear Zone has a protracted history with an older ductile stage involving at least a component of dextral shearing, and a later, brittle stage with top-to-the-south thrusting.
Eastern structural domain
shows a structural interpretation of the ESD emphasising the key structural features. In the northwest part of the map, a northeast-trending corridor, referred to as the Boondoona Creek Corridor, is defined by several major structures. Dragging of magnetic features along the Willies Range and Mount Young faults indicates a component of ductile dextral shearing (Abdullah & Rosenbaum, Citation2017). As outlined above, seismic line BMR84-14 indicates thrusting along the Mount Young Fault and adjacent structures (), and it is suggested that this indicates two separate deformational events.
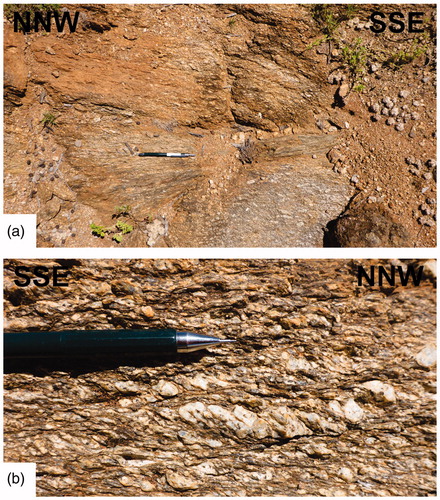
The Elverston Fault shows some dragging of magnetic horizons indicative of sinistral shearing. Sinistral shearing is also observed in the only outcrop with deformed rocks in the whole ESD, the Granite Springs Granite to the southeast of the Willies Range Fault (see for location), which shows numerous steep north- and northeast-trending shear- and high strain-zones with consistent sinistral shear sense ( Purdy et al., Citation2016). The north-trending Mungallala Fault in the eastern ESD also shows sinistral dragging of magnetic bodies to the north of the map area (Supplementary papers, Figure S2).
Figure 11. (a) Photo of a high strain zone in the Granite Springs Granite outcrop; and (b) feldspar phenocrysts showing sinistral shearing. See for location.
The Boondoona Creek Corridor is segmented by second-order faults and shear zones defining, in parts, an anastomosing pattern and revealing the corridor as an area of relatively high strain. It contains numerous tight to isoclinal folds with northeast-trending axial planes that are delineated by the high-frequency magnetic striping pattern characteristic of the Werewilka Formation (; Purdy et al., Citation2018). These folds are mesoscale structures with wavelengths of several kilometres, and some can be traced along the hinge line for up to 30 km. In the structural interpretation (), these tight folds have been interpreted to represent F1 for the ESD, because there is clear evidence for later refolding (e.g. ). Nevertheless, it is quite possible that some of the isolated fold hinges shown in form part of a separate (?older) deformation event.
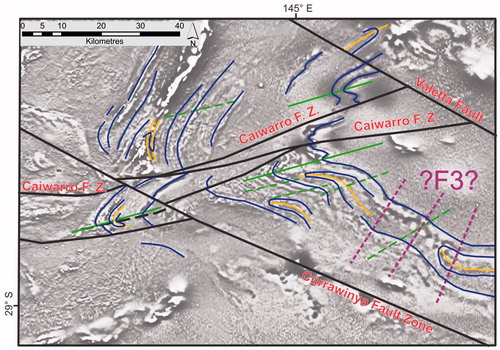
Figure 12. Structural interpretation of the hinge area of the Wyuna Megafold on a grey-scale 1VD RTP magnetic intensity image (white corresponds to high magnetic intensity); see for location, and for legend.
Owing to the lack of outcrop, the only quantitative constraints on fabric orientation in the ESD come from oriented drill cores. While these drill cores represent an invaluable source of information, care must be taken during the interpretation and upscaling of fabric elements and measurements as the interpolation from drill core to regional scale is not necessarily straightforward. Things to consider include that (i) a deformation event may not produce structures across different scales; and (ii) boreholes may be located in zones of complexity such as high order fold hinges and/or shear zones, which may not be recognisable in the potential field data.
Borehole ERE Boon 1 () has been drilled in proximity to a southwest-ward-closing F1 hinge and intersected siliciclastic and calcsilicate schist. The rocks contain one main foliation, and both foliation and bedding align well with the northeast-trending magnetic striping of the Werewilka Formation and the F1 axial planes in the Boondoona Creek Corridor. Hence, it appears that the fabric orientation within ERE Boon 1 core may be representative of the larger scale geology, suggesting that bedding and foliation in the Boondoona Creek Corridor dip steeply to the northwest (). Small-scale folds in the core are tight to open and may represent small-scale F1 folds, with fold axes plunging shallowly to the southwest (). In contrast, borehole GSQ Eulo 1 (Roach et al., Citation2017), west of Cunnamulla, does not lend itself to larger scale interpolation as it is situated in a somewhat anomalous area of westerly trending magnetic highs and shear zones unrepresentative of the regional northeast trend. GSQ Eulo1 intersected quartz–muscovite–biotite–chlorite schist, which is, in parts, strongly sheared and has a moderately to steeply north-dipping foliation consistent with the local westerly trends (). As observed in ERE Boon 1 (?F1) fold axes are shallowly plunging (), but are not representative of the wider region. The core contains rare tight, centimetre-scale refolded folds that may represent pre-F1 structures.
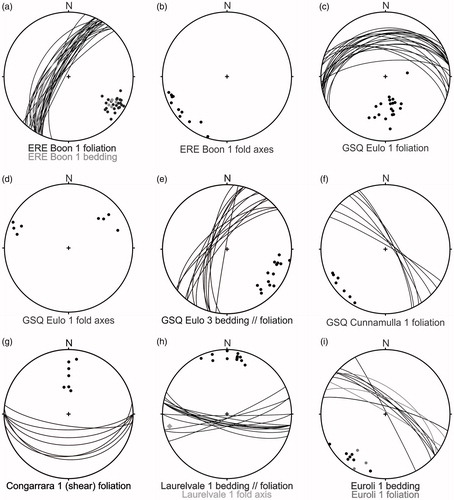
Figure 13. Schmidt net plots from oriented drill core, with locations given in and . (a) ERE Boon 1 bedding and main foliation (S1), (b) ERE Boon F1 fold axes, (c) GSQ Eulo 1 foliation, (d) GSQ Eulo 1 F1 fold axes, (e) GSQ Eulo 3 foliation (S1) and bedding, (f) GSQ Cunnamulla 1 foliation (?S1), (g) Congararra 1 (shear) foliation, (h) Laurelvale 1 bedding subparallel foliation (S1), and F1 fold axes, and (i) Euroli 1 bedding and foliation (?S1); all measurements were taken using a rocket launcher core orientation device (all plots lower hemisphere).
Wyuna Megafold
The ESD map pattern is controlled by a large fold structure, which possibly affects all stratigraphic units ( and ). With a wavelength of >130 km, its size is comparable with that of oroclines recognised in different parts of the Tasmanides (Musgrave, Citation2015), such as the New England Orogen to the east (e.g. Rosenbaum, Citation2012; Glen & Roberts, Citation2012), and is referred to here as the Wyuna Megafold. The structure opens towards the east, and a more detailed interpretation of the hinge zone, as developed in the Werewilka Formation, is presented in . Here, it contains a northern northeast-trending limb and a southern southeast-trending limb. The tight F1 folds somewhat resemble intrafolial folds and are refolded by the D2 Wyuna Megafold with west-southwest-trending axial planes. Second-order F2 folds, showing opposing asymmetry across the hinge zone, are also developed. On the southern limb, there is also some indication for an open refolding with northeast to north-northeast-trending axial planes, which we tentatively interpret as F3. The Caiwarro Fault Zone is a network of structures that, as a whole, facilitate the east-southeast-ward displacement of a segment of the Wyuna Megafold hinge ().
At the more regional scale, the fold geometry further to the east, as delineated by the Minoru Plains zone appears more open, which may be due to disharmonic effects related to rheological contrast, or due to the eastern extension of the Caiwarro Fault Zone suppressing the hinge while juxtaposing the twofold limbs. The geometry is also more suggestive of a northeast-trending axial plane. We interpret this to reflect a gradual change in orientation of the Wyuna Megafold axial plane into a northeasterly direction (). However, it cannot be ruled out that the fold pattern delineated by the Minoru Plains zone represent a later, open refolding (?D3), with northeast-trending axial planes, possibly linked to the open refolding of the southern limb of the Wyuna Megafold (F3 in ).
The map pattern also hints to a second large hinge opening towards the west-southwest in the area of the Rose Hill Fault and to the north of drill-hole GSQ Cunnamulla 1.
The geometry of the Wyuna Megafold is not easy to constrain. Borehole GSQ Eulo 3 is located in the northern fold limb close to the hinge zone and intersected clastic sedimentary rocks. Bedding is subparallel to one main foliation, with both dipping steeply towards the west-northwest (). This is consistent with the observations from ERE Boon 1 (), suggesting a steeply west-northwest-to-northwest dipping northern limb of the Wyuna Megafold. The orientation of the southern limb is poorly constrained by boreholes. The foliation in borehole GSQ Cunnamulla 1, which intersected pelitic schist, dips steeply to the northeast (), but is difficult to evaluate because the borehole is located in a locally complex area and also may be influenced by deformation related to the Culgoa North Fault. This is also true for borehole Congararra 1, which is located in an area strongly affected by dextral dragging along the Culgoa North Fault () on the interpreted margin of the Hungerford Granite, a large granite pluton extending from the area around Hungerford to the south and southeast (). The borehole intersected sheared granite and altered country rock, showing a (shear-related) foliation dipping moderately to steeply to the south ().
Current geochronological constraints outlined by Purdy et al. (Citation2018) suggest an overall eastward stratigraphic polarity, with the Glenroy Formation and the Minoru Plains zone potentially being of Siluro-Devonian age ( and ). Assuming an overall upright stratigraphy, this would require the Wyuna Megafold to be a syncline. This is only possible if the southern limb dips north-northeast, and the northern limb is overturned. In this scenario, a moderately dipping southern limb (i.e. ∼030/45–60°; dip direction/dip angle) would suggest a moderately north- to north-northeast-dipping fold axes, a fold axial plane oriented ∼335–345/50–60° (dip direction/dip angle), that is, consistent with the interpreted trend of the S2 axial planes within the Werewilka Formation (), and an interlimb angle of ∼70°. As described above, further to the east the axial plane progressively rotates into a northeasterly trend.
In summary, based on the limited data, we tentatively interpret the Wyuna Megafold to represent a moderately inclined and moderately (to steeply) plunging syncline. Geochronological work currently undertaken on new drill cores will provide important constraints on the stratigraphic facing that may warrant a reinterpretation. The size and moderately to steeply plunging fold axes, axial plane and limbs of the Wyuna Megafold, and the fact that it is superimposed on a pre-existing pervasive deformation (i.e. D1), resemble characteristics of oroclines elsewhere in the Tasmanides (e.g. Rosenbaum, Citation2012; Glen & Roberts, Citation2012), and may suggest that the Wyuna Megafold does in fact represent an orocline.
Mount Oxley Domain
Basement outcrop in the MOD is very poor. The S-type Brewarrina Granite (; Blevin & Jones, Citation2004) is exposed in a quarry southwest of Brewarrina, where it appears undeformed in outcrop (Bodorkos et al., Citation2013). Clastic sedimentary rocks of the Booda Formation crop out on the flanks of Mount Oxley (Fraser et al., Citation2014). They contain a west-trending, bedding parallel foliation, overprinted by a north-trending crenulation cleavage (Burton, Citation2010).
Figure 14. Structural interpretation of the Mount Oxley Domain on a grey-scale 1VD RTP magnetic intensity image (white corresponds to high magnetic intensity); see for position. MOF: Mount Oxley Fault. Also shown is the position of seismic line DMR98-02.
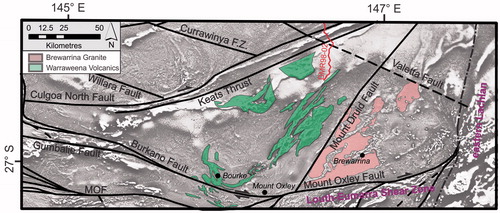
To the south of the bounding Keats Thrust and the Paka Tank Trough, the main characteristic of the MOD is the prevalence of northeast trends. These are delineated by the Mount Druid Fault, which constrains the western boundary of the Brewarrina Granite, and also by the trend of the southeastern occurrence of the Warraweena Volcanics, recognised by their strongly magnetic character ( and ). Although these appear essentially undeformed in drill core, their southwest part shows some evidence for dextral dragging along the Burkano Fault, or alternatively, folding.
Western structural domain
The WSD is characterised by predominantly west- to north-northwest-trending geology. It shows a ‘fault/shear dominated’ structural style as opposed to the ‘fold-dominated’ ESD, with many faults and shear zones occurring throughout the domain (). Cross-cutting and overprinting relationships indicate several generations of major structures. Group 1 structures (green lines in ) are overprinted by the northeast-trending Cobham Kink Zone trend () (Stevens, Citation1985; Thalhammer et al., Citation1998), suggesting that they are relatively early structures. This is consistent with the Group 1 structures being truncated by younger faults, such as the northwest-trending Orientos Fault, which is not affected by the Cobham Kink Zone deformation. The Willara Fault marks the boundary with the TZ () and postdates most structures.
Figure 15. Structural interpretation of the WSD on a grey-scale 1VD RTP magnetic intensity image (white corresponds to high magnetic intensity); see for position. Also shown is the position of . BF: Bundarra Fault; MOF: Mount Oxley Fault; PF: Purnanga Fault.
Another type of fault/shear zone developed in most parts of the domain is mapped as ‘minor faults and fractures,’ most of which are laterally continuous for 10–40 km (). They typically form locally subparallel sets, the trend of which varies across the WSD. This seems in part related to folding/kinking, but also to differences in timing and it is likely that several generations of these minor fault and fracture sets exist. In some areas, e.g. ∼100 km east of Tibooburra, these fractures show high intersection angles and may represent conjugate sets.
Although folds are not rare in the WSD south of the Titheroo Fault (), wavelengths are typically <10 km. These folds are generally tight, and their axial planes are subparallel to the main lithological trends, Group 1 structures and the Olepoloko Fault ( and ). A small part of the WSD is exposed in the Tibooburra Inlier, where the regional trend is north-northwest (Brown & Vickery, Citation2010). This allows for integration and correlation of the large-scale structural interpretation with field observations. These suggest that the tight folds represent F1 in the WSD (Brown et al., Citation2006; Thalhammer et al., Citation1998), although folds at Tibooburra represent second-order folds with wavelengths of between 200 m and 2 km (Brown et al., Citation2006). In the Tibooburra Inlier, F1 axes are predominantly shallowly plunging to the south-southeast, and the folds are upright and accompanied by a steeply dipping, slaty cleavage. Overall, D1 deformation is complex and has been described as either a progressive, long-lasting event (Thalhammer et al., Citation1998), or, alternatively, as including a post D1 transpressive overprint where northeast–southwest-oriented shortening resulted in dextral shearing along north-northwest-trending structures (Greenfield, Citation2010). Evidence for dextral transpressive deformation after D1 is also provided by field observations from the Yancannia area, located about 120 km to the southeast of the Tibooburra Inlier (Wong et al., Citation2018). In both the Tibooburra Inlier and the Yancannia Formation, D1 has been related to the Benambran orogeny (Greenfield, Citation2010; Wong et al., Citation2018). The later deformation at Tibooburra produced east-northeast-trending kink bands and mesoscopic folds with predominantly west-southwest-plunging fold axes (Thalhammer et al., Citation1998), which we interpret as a smaller-scale expression of the Cobham Kink Zone deformation, whose domain-scale effect is recognised in the magnetic data ().
shows a more detailed interpretation of the structural elements further to the south, where the major faults trend west-northwest to west. North of the Tongo Fault, which shows some evidence for sinistral dragging in this area (Abdullah & Rosenbaum, Citation2017), first- and second-order F1 structures are delineated by sedimentary rocks of the Warratta Group and Tongo Formation with a stripy magnetic character, with F1 axial planes showing some gentle undulations. The oriented drill core from Laurelvale 1 contains fine-grained clastic sedimentary rocks showing an upright stratigraphic polarity. The rocks contain a slaty cleavage (S1) subparallel to the bedding, which dip steeply towards the south to south-southwest (). Steeply dipping bedding and foliation have also been observed in drillhole Euroli 1, located in proximity to the Willlara Fault ( and ). In Laurelvale 1, there is evidence of soft-sediment deformation such as slumping, and only one F1 fold could be identified in the drill core, plunging shallowly to the west, consistent with the shallow plunges of F1 axes observed at Tibooburra (Thalhammer et al., Citation1998), and in the Yancannia Formation (Wong et al., Citation2018).
Figure 16. Structural interpretation of the southwest part of the WSD on a grey-scale 1VD RTP magnetic intensity image (white corresponds to high magnetic intensity); see and for position.
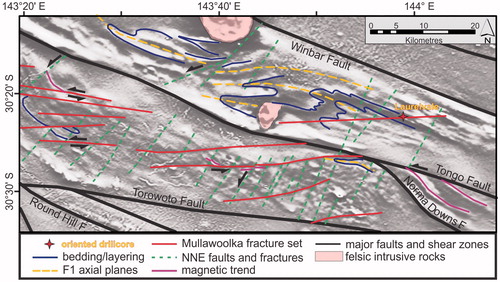
In the area covered by , two sets of minor fault structures are developed. The west-striking Mullawoolka fracture set (red lines in ) is confined to the southwest part of the WSD. Some Mullawoolka structures show evidence for dragging of magnetic horizons with an apparent sinistral sense of movement, interpreted as synthetic Riedel shears related to sinistral shearing along the Tongo Fault by Abdullah and Rosenbaum (Citation2017). The second set strikes north-northeast and belongs to the overall most prominent type of minor faults and fractures in the WSD, all of which are oriented at a high angle to the main lithological trends and Group 1 structures (). This set is interpreted to postdate the Mullawoolka fracture set, with some structures showing minor sinistral offset of magnetic features (). This kinematic indicator is consistent with field observations from the Tibooburra Inlier, where Thalhammer et al. (Citation1998) described sinistral strike-slip movement along northeast-striking brittle faults in the Tibooburra Granite and adjacent Warratta Group sedimentary rocks.
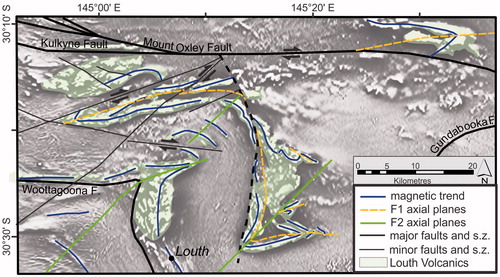
Apart from the apparent sinistral movement along the Tongo Fault, the dominant ductile kinematic in the hanging wall of the Olepoloko Fault is dextral. This is evident, for example, in the Louth area (). Kinematic indicators at the mesoscale are the dextral offset of the Louth Volcanics by the Mount Oxley Fault (Abdullah & Rosenbaum, Citation2017) and other minor faults, and dextral deflection of the northeast-striking axial planes of folds. These folds are interpreted as the local F2, refolding a generation of tight local F1 folds (). Although the geometry of these local F1 folds mimics that of the F1 folds in the Tibooburra Inlier, they occur in younger rocks of the Louth Volcanics (e.g. Purdy et al., Citation2018), and the timing relationship with the folds further to the west is unconstrained.
Figure 17. Structural interpretation of the Louth area (WSD) on a grey-scale 1VD RTP magnetic intensity image (white corresponds to high magnetic intensity); see for position.
Continuation of the WSD to the north
The east–west-trending corridor defined by the Group 2 faults shows numerous granitic intrusions (), which overprint and mask the linear magnetic character of the Warrata Group metasediments (). The cover thickness also increases to the north of these faults causing a dampening of the high-frequency content in the magnetic data making the continuation of the WSD into the central Thomson difficult to assess.
Figure 18. Structural interpretation of the northern part of the WSD, and its continuation to the north into the central Thomson Orogen. (a) Major faults and shear zones with interpreted magnetic trendlines on a semitransparent tilt derivative magnetic image (in colour), draped over a grey-scale 1VD RTP magnetic intensity image. Also shown are granitic intrusions (in pink) overprinting and masking the regional magnetic pattern related to Warrata Group sediments and equivalents in the corridor defined by Group 2 faults (yellow). (b) Interpretation Model A (after Abdullah & Rosenbaum, Citation2017) of the linework presented in (a), emphasising dextral shearing and dragging along the Currawinya Fault Zone, which forms part of the Group 3 faults (in red). (c) Interpretation Model B of the linework presented in (a), relating the observed pattern to dextral shearing along the Tooley Wolley Fault Zone and the Tennappera Fault (solid yellow lines). (d) Interpretation Model C of the linework presented in (a), suggesting a pre-existing southeast-ward closing fold, which is intersected by Group 2 (in yellow) and Group 3 (in red) faults without shear-related dragging of magnetic units. BF: Bundarra Fault; CaFZ: Caiwarro Fault Zone; MOF: Mount Oxley Fault; see for position.
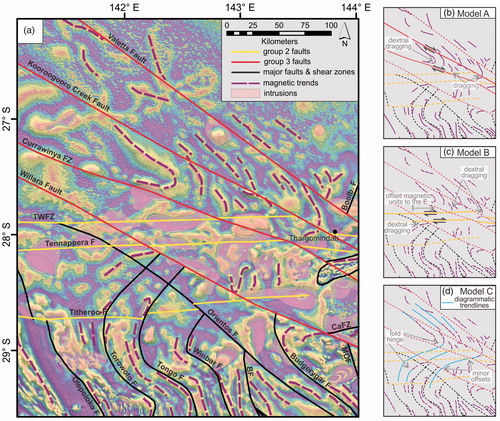
The magnetic data provide structural constraints (). A lower frequency, stripy magnetic pattern can be observed to the north of the Currawinya Fault Zone, which is similar to the magnetic character of the Warrata Group but occurs several tens of kilometres further to the northeast (). In this area, the magnetic features show broad northwest trends, and also some large folds closing to the southeast to east-southeast (; Abdullah & Rosenbaum, Citation2017). This contrasts with the area to the north of the Titheroo Fault, where the regional geology of the WSD swings into a northeast trend, delineated by magnetic features and fault traces ().
Several scenarios may be invoked to explain the magnetic pattern (). Abdullah and Rosenbaum (Citation2017) related the southeast-ward closing folds to dextral shearing and dragging along the Currawinya Fault Zone, which forms part of the Group 3 faults (‘Model A’ in ). An alternative proposal (Model B, ) could invoke dextral shearing and dragging along the Tooley Wooley Fault Zone and the Tennappera Fault to account for the northeast trends of the regional geology north of the Titheroo Fault (). Another possibility and the one favoured here is shown in (Model C), where the initial configuration is a megafold-pair with east-southeast-trending axial planes, comparable in size to the Wyuna Megafold of the ESD. In this model, both Group 2 and Group 3 structures postdate the megafold formation. Segmentation of the megafold by these structures occurs largely by brittle vertical offset, with lateral shearing being minor to negligible. We favour Model C mainly because there is no real evidence for an increase in strain that shear-related dragging at this scale (∼100 km) would require towards either of the fault structures that are called upon as dextral shear zones in models A and B. Also, there is no evidence for shear-related dragging along the Currawinya Fault further to the south under shallower cover (), where it appears as a late-stage fault, bounding the TZ (see below).
While the west-northwest-ward closing hinge of the megafold is partly inferred through the area with numerous granitic intrusions ( and ), the east-southeast closing hinge is reasonably intact, and we refer to this structure as the Thargomindah Megafold.
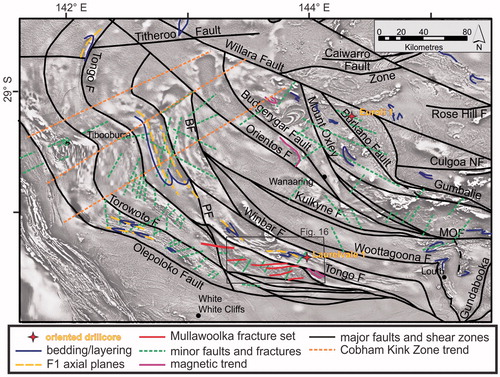
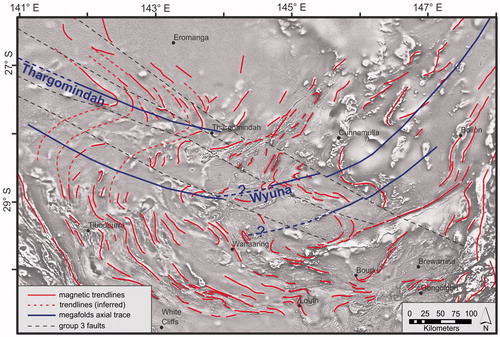
Figure 19. Structural interpretation of the southern Thomson Orogen showing magnetic trendlines of stratigraphic units. The figure illustrates the existence of large-scale megafolds in the southern Thomson, most prominent the Wyuna Megafold and the Thargomindah Megafold. Also shown are interpreted axial planes of these structures.
Transition zone
The TZ is a northwest-trending corridor bounded by the Willara Fault and the Currawinya Fault Zone (). The geology is not exposed but is interpreted to be dominated by magmatic rocks of the Hungerford Granite and its country rocks.
The Currawinya Fault Zone postdates the late Silurian Hungerford Granite in the northeast, and also cuts structures of the Boondoona Creek Corridor, some of which bound Devonian basins (). The Willara Fault postdates structures of the WSD such as the Burkano and Mount Oxley faults. Deformation related to the Cobham Kink Zone is not recognised to the east of this fault. These factors suggest that at least the final movement of the bounding structures to the TZ, which largely mask or suppress the pre-existing primary contact relationship with the ESD and WSD, is late in the structural evolution. This primary relationship may be in part preserved in the westernmost part of the Caiwarro Fault Zone corridor that can be traced across the Currawinya Fault Zone into the TZ. In this area the contact between the Werewilka Formation of the ESD and the Hungerford Granite of the TZ appears at least in part intrusive ( and ).
Olepoloko Fault and its continuation to the west
The Olepoloko Fault—or, more precisely, the structural discordance it forms part of—has undergone a complex history, which is revealed by geophysical data. Interpretation of deep seismic reflection lines 05GA-TL2 and 05GA-TL3 (), in combination with potential field data, illustrates several stages of the evolution. Neglecting possible minor reactivation, the latest stage is represented by the Olepoloko Fault sensu stricto, which is interpreted in the reflection seismic as a north-dipping structure along which rocks of the southern Thomson Orogen are thrust to the south onto the upper Lower to Upper Devonian Mulga Downs Group (; Abdullah & Rosenbaum, Citation2017; Folkes, Citation2017; Glen et al., Citation1996, Citation2013). This suggests that thrusting has to be late- to post-Devonian. The seismic data further suggest that this faulting, at least in the upper crust, occurs along a discrete, brittle fault with only a minor effect on the hanging-wall rocks of the southern Thomson Orogen. The base of the Mulga Downs Group is imaged between 1.5 and 2 s TWT, corresponding to an overall thickness of 3.8–5 km (Glen et al., Citation2013), which represents a minimum value for the vertical throw along the fault.
In plan-view, the Olepoloko Fault as a discrete structure is reasonably well defined in potential field data in the form of a steep gravity gradient (Glen et al., Citation2013; Murray & Kirkegaard, Citation1978; Stevens, Citation1991), and further to the west where it is the western boundary to the Warratta Group rocks recognised by their high-frequency character in magnetic images (Purdy et al., Citation2018). To the west of seismic line 05GA-TL3 it swings into a west-northwest trend where it is intersected by deep seismic reflection line 99AGS-C1 (; Glen et al., Citation2013). The interpretation of the Olepoloko Fault geometry in line 99AGS-C1 is less clear, largely owing to the fact that it is intersected very close to the northeast end of the line. Here, we follow the interpretation of Greenfield et al. (Citation2011) and Korsch and Doublier (Citation2016), suggesting an apparent dip towards the east-northeast in this seismic transect, which is most consistent with the well-constrained northerly dip further along to the east. Nevertheless, it is important to note the existence of a large, west-dipping structure in this seismic profile (Abdullah & Rosenbaum, Citation2017; Mills & David, Citation2004), whose relationship with the Olepoloko Fault at depth is unknown.
Further to the north, the Olepoloko Fault trends north-northwest, paralleling the structural grain of the Koonenberry Belt adjacent to the west. The north-northwest-trending segments of the Olepoloko Fault resemble a lateral ramp setting during the Late to post-Devonian southward thrusting. However, it is not clear to what degree these fault segments have been active during that time. North of the known extent of the Koonenberry Belt, the position of the Olepoloko Fault is poorly constrained (Glen et al., Citation2013; Korsch & Doublier, Citation2016).
Interpretation of reflection seismic and potential field data suggest that the Olepoloko Fault resembled a broad ductile shear zone early in its evolution, which affected significant parts of its present-day hanging wall. In seismic line 05GA-TL3, the corridor between the Olepoloko Fault and the Little Momba Fault shows segmented packages of coherent reflectivity, in part defining lozenge-shaped geometries, which we interpret as a high strain zone (). Further to the north, upper crustal structures with an overall antithetic geometry to the Olepoloko Fault, such as the Tongo Fault and the Winbar Fault (), appear to dip to the north in proximity to the Little Momba Fault (), resembling an extensional geometry. We attribute this apparent extensional geometry to the out-of-plane shearing causing apparent offsets similar to those observed in flower structures. The overall dominant kinematic indicator as observed in the Louth area appears to be dextral (), which is consistent with the dextral shearing along the Louth-Eumarra Shear Zone to the east (Dunstan et al., Citation2016), and observations from the Koonenberry Belt (Greenfield, Citation2010). Based on rocks affected by this event (i.e. Louth Volcanics, Brewarina Granite), at least part of this dextral shearing must be younger than ca 420–415 Ma. Nevertheless, it is not clear how the sinistral shearing in the southwest part of the southern Thomson Orogen (Abdullah & Rosenbaum, Citation2017; ) relates to the dextral shearing.
Finally, our interpretation of seismic line 05GA-TL2 shows some evidence for downward dragging of mid- to lower-crustal shear zones and reflective packages, and down-stepping of the Moho along an Olepoloko splay fault, resulting in significant crustal thickness observed to the north of the Olepoloko Fault (). These geometries are restricted to the middle and lower crust, and therefore may be related to an event early in its history. As the downward dragging may be due to normal movement along the fault, it could be related to an extensional event such as the post-Delamerian Larapinta Extension, which has accommodated the deposition of the sedimentary rocks of the Warratta Group (Greenfield, Citation2010). It is also possible that the dragging is related to out-of-plane (i.e. strike-slip) movement, rather than extension. Alternatively, an early episode of north-to-south thrusting has been proposed to explain the crustal thickening (Glen et al., Citation2013).
Overall the evolution of the Olepoloko Fault through time shares some commonalities with the Culgoa Shear Zone and its bounding structures:
a late-stage, brittle, southward thrusting with significant vertical throw onto Middle to Upper Devonian sedimentary rocks of the Mulga Downs Group, which may indicate synchronism and a linked system during the time of thrusting postdating sedimentation; and
an older stage of dextral shearing, whereas the timing in the hanging wall of the Culgoa Shear Zone is unconstrained.
Structural model of the southern Thomson Orogen
Given the size of the southern Thomson Orogen, the existence of different litho-structural domains is not surprising. In order to understand the geological evolution of the area as a whole, it is important to reintegrate the more detailed interpretations of the different domains into the regional frame. This is shown in , which provides a map of the main magnetic trends related to stratigraphic units, i.e. ignoring magnetic features interpreted to relate to intrusions. With the exception of the late west-northwest to northwest-trending Group 3 faults, no major faults and shear zones are displayed.
The emerging picture allows interpretation of the southern Thomson Orogen as a set of megafolds or oroclines, with axial planes oriented west-northwest in the western part, and east-northeast to northeast in the eastern part. Most prominent is the Wyuna Megafold, which, assuming our preferred interpretation of the northern part of the WSD is correct (Model C, ), may be traced from the ESD into the WSD, forming the complementary hinge to the Thargomindah Megafold. As the Wyuna Megafold is interpreted to be a syncline, the Thargomindah Megafold could represent an anticline.
The Thargominda Megafold hinge seems to end north of the Boondoona corridor, and hence is restricted to the WSD, or more exactly its northern extension. The hinge developed to the south of the Wyuna Megafold is difficult to trace into the WSD and possibly dies out or is overprinted by the Cobham Kink Zone deformation (). In this interpretation, wide parts of the WSD lie to the south of the Wyuna Megafold axial plane.
It is likely that the megafolds formed after the Benambran orogeny, because the Wyuna Megafold refolds tight, older F1 folds, which resemble the Benambran F1 folds described in the WSD (e.g. Greenfield, Citation2010; Wong et al., Citation2018). The formation of these megafolds is most likely related to the Bindian Orogeny, predating formation of the late Lower to Upper Devonian basins of the area (the Adavale Basin and the Paka Tank Trough).
Conclusions
A structural interpretation based on the combination of geological constraints with new interpretations of potential field data, deep seismic reflection data and basin seismic reflection data reveals that the southern Thomson Orogen can be subdivided into different structural domains. These domains are characterised, and can be distinguished, by differences in: (i) spatial orientation, (ii) geographic distribution and (iii) partly, the timing of major faults. They also differ with regard to the evolution and spatial orientation of other structural elements, such as folds, and minor faults and fractures, in addition to broader lithological trends, stratigraphy and structural style.
The two largest and most prominent domains are the ESD and the WSD. Whereas the WSD contains numerous faults and shear zones, the ESD is dominated by the map-scale Wyuna Megafold, which possibly represents an orocline. In comparison, the ESD is more strongly affected by younger deformational events, including Late- to post-Devonian thrusting, for example in the Boondoona Creek Corridor, which bounds the domain to the northwest.
Despite these differences, it is possible to integrate the different domains into a coherent structural framework, and our interpretation suggests that the southern Thomson Orogen as a whole represents a set of megafolds or oroclines, with axial planes oriented west-northwest in the western part, and east-northeast to northeast in the eastern part.
The area is prone to reactivation, and several of the major structures show evidence for a polyphase history, where a stage of Late- to post-Devonian brittle thrusting follows an earlier stage of ductile shearing, commonly with apparent dextral kinematics.
Supplemental Material
Download PDF (6.7 MB)Acknowledgements
We acknowledge discussions with colleagues Dominic Brown, David Champion, Geoff Fraser, John Greenfield and Phil Gilmore. We are particularly grateful to Ajay V. Kulkarni (Geological Survey of India) for the potential field modelling of seismic line DMR98-02 (). The authors gratefully acknowledge reviews from Russell Korsch and Ian Roach of an earlier version of the manuscript, very detailed and constructive journal reviews by Gideon Rosenbaum and Dick Glen, and editorial comments by Bill Collins all of which helped to clarify aspects of the manuscript. This paper is published with the permission of the CEO, Geoscience Australia.
Disclosure statement
No potential conflict of interest was reported by the authors.
Related Research Data
References
- Abdullah, R., & Rosenbaum, G. (2017). Orogen-perpendicular structures in the central Tasmanides and implications for the Paleozoic tectonic evolution of eastern Australia. Tectonophysics, 694, 444–463.
- Blevin, P. L., & Jones, M. (2004). Chemistry, age and metallogeny of the granites and related rocks of the Nymagee region, N.S.W. In K.G. McQueen, & K.M. Scott (Eds.), Proceedings exploration field workshop cobar region 2004, (pp. 15–19). Perth, WA: Cooperative Research Centre for Landscape Evolution and Mineral Exploration.
- Bodorkos, S., Blevin, P. L., Simpson, C. J., Gilmore, P. J., Glen, R. A., Greenfield, J. E., … Quinn, C. D. (2013). New SHRIMP U–Pb zircon ages from the Lachlan, Thomson and Delamerian orogens, New South Wales: July 2009–June 2010. Canberra, ACT: Geoscience Australia (Record 2013/29), and Maitland, NSW: Geological Survey of New South Wales (Report GS2013/0427).
- Brown, R. E., & Vickery, N. M. (2010). Tibooburra inlier 1:25000 geological sheet. Armidale, NSW: Geological Survey of New South Wales.
- Brown, R. E., Vickery, N. M., & Greenfield, J. E. (2006). Geology and mineralisation of the Cambrian to Devonian inliers of the Tibooburra area. In R. J. Korsch & R. G. Barnes (Compilers), Broken Hill Exploration Initiative, Abstracts for the September 2006 Conference (pp. 16–21). Canberra, ACT: Geoscience Australia Record 2006/21.
- Burton, G. R. (2010). Structural model to explain geophysical features in northwestern New South Wales: Implications for the tectonic framework of the Tasmanides. Australian Journal of Earth Sciences, 57(1), 23–49.
- Burton, G. R., & Trigg, S. J. (2014). Geodynamic significance of the boundary between the Thomson Orogen and the Lachlan Orogen, northwestern New South Wales and implications for Tasmanide tectonics: Discussion. Australian Journal of Earth Sciences, 61(4), 639–641.
- Cawood, P. A. (2005). Terra Australis Orogen: Rodinia breakup and development of the Pacific and Iapetus margins of Gondwana during the Neoproterozoic and Paleozoic. Earth-Science Reviews, 69(3–4), 249–279.
- Cayley, R. A. (2015). The giant Lachlan orocline – a powerful new predictive tool for mineral exploration under cover across eastern Australia. In P. C. Lewis (Compiler), Mines and Wines Conference 2015, Orange (pp. 29–38). Crows Nest NSW: Australian Institute of Geoscientists Bulletin 62.
- Cayley, R. A., Korsch, R. J., Moore, D. H., Costelloe, R. D., Nakamura, A., Willman, C. E., … O'Shea, P. J. (2011). Crustal architecture of central Victoria: Results from the 2006 deep crustal reflection seismic survey. Australian Journal of Earth Sciences, 58(2), 113–156.
- Champion, D. C. (2016). Geodynamic synthesis of the phanerozoic of eastern Australia (2nd ed.). Canberra, ACT: Geoscience Australia, Record 2016/07.
- Collins, W. J. (2002). Hot orogens, tectonic switching, and creation of continental crust. Geology, 30(6), 535–538.
- Collins, W. J., & Vernon, R. (1992). Palaeozoic arc growth, deformation and migration across the Lachlan Fold Belt, southeastern Australia. Tectonophysics, 214(1–4), 381–400.
- Doublier, M. P., Dutch, R. A., Clark, D., Pawley, M. J., Fraser, G. L., Wise, T. W., … Holzschuh, J. (2015). Interpretation of the western Gawler section of seismic line 13GA-EG1. In R. A. Dutch, M. J. Pawley, & T. W. Wise (Eds.), What lies beneath the western Gawler Craton? 13GA-EG1E Seismic and Magnetotelluric Workshop 2015 (pp. 28–40). Adelaide, SA: Department of State Development, South Australia, Report 2015/00029
- Doublier, M. P., Brennan, T., Korsch, R. J., & Nicoll, M. G. (2016). 3D Model of the Major Crustal Boundaries of Australia [Digital Dataset]. Canberra: Geoscience Australia, Commonwealth of Australia.
- Dunstan, S., Rosenbaum, G., & Babaahmadi, A. (2016). Structure and kinematics of the Louth-Eumarra Shear Zone (north-central New South Wales, Australia) and implications for the Paleozoic plate tectonic evolution of eastern Australia. Australian Journal of Earth Sciences, 63(1), 63–18.
- Fergusson, C. L. (1991). Thin-skinned thrusting in the northern New England Orogen, central Queensland, Australia. Tectonics, 10(4), 797–806.
- Fergusson, C. L. (2017). Mid to late Paleozoic shortening pulses in the Lachlan Orogen, southeastern Australia: a review. Australian Journal of Earth Sciences, 64(1), 1–39.
- Fergusson, C. L., & Henderson, R. A. (2015). Early Palaeozoic continental growth in the Tasmanides of northeast Gondwana and its implications for Rodinia assembly and rifting. Gondwana Research, 28(3), 933–953.
- Finlayson, D. M., Wake-Dyster, K. D., Leven, J. H., Johnstone, D. W., Murray, C. G., Harrington, H. J., … Wellman, P. (1990). Seismic imaging of major tectonic features in the crust of Phanerozoic Australia. Tectonophysics, 173(1-4), 211–230.
- Fitzpatrick, A., Johnson, W., & Associates (consultants). (1965). Exploration of an aeromagnetic anomaly on authority to prospect 2457. Maitland, NSW: Geological Survey of New South Wales, Report File GS1965/063.
- Foden, J., Elburg, M. A., Dougherty-Page, J., & Burtt, A. (2006). The timing and duration of the Delamerian Orogeny: Correlation with the Ross Orogen and implications for Gondwana assembly. The Journal of Geology, 114(2), 189–210.
- Folkes, C. B. (2017). An integrative approach to investigating crustal architecture and cover thickness in the Southern Thomson region: modelling new geophysical data. Canberra, ACT: Geoscience Australia, Record 2017/01.
- Fraser, G. L., Gilmore, P. J., Fitzherbert, J. A., Trigg, S. J., Campbell, L. M., Deyssing, L., … Simpson, C. J. (2014). New SHRIMP U–Pb zircon ages from the Lachlan, southern Thomson and New England orogens, New South Wales: February 2011–June 2013. Canberra, ACT: Geoscience Australia, Record 2014/53, and Maitland, NSW: Geological Survey of New South Wales, Report GS2014/0829.
- Glen, R. A. (2005). The Tasmanides of eastern Australia. In A. P. M. Vaughan, P. T. Leat, & R. J. Pankhurst (Eds.), Terrane processes at the margins of Gondwana (pp. 23–96). London, UK: Geological Society, London, Special Publication 246.
- Glen, R. A. (2013). Refining accretionary orogeny models for the Tasmanides of eastern Australia. Australian Journal of Earth Sciences, 60(3), 315–370.
- Glen, R. A., & Roberts, J. (2012). Formation of oroclines in the New England Orogen, eastern Australia. Journal of the Virtual Explorer, 43, paper 3.
- Glen, R. A., Clare, A., & Spencer, R. (1996). Extrapolating the Cobar Basin model to the regional scale: Devonian basin-formation and inversion in western New South Wales. In W. G. Cook, A. J. H. Ford, J. J. McDermott, P. N. Standish, C. L. Stegman, & T. M. Stegman (Eds.), The Cobar Mineral Field–1996 (pp. 43–83). Melbourne, VIC: Australasian Institute of Mining and Metallurgy, Spectrum Series 3/96.
- Glen, R. A., Korsch, R. J., Direen, N. G., Jones, L. E. A., Johnstone, D. W., Lawrie, K. C., … Shaw, R. D. (2002). Crustal structure of the Ordovician Macquarie Arc, Eastern Lachlan Orogen, based on seismic reflection profiling. Australian Journal of Earth Sciences, 49(2), 323–348.
- Glen, R. A., Korsch, R. J., Hegarty, R., Saeed, A., Poudjom Djomani, Y., Costelloe, R. D., & Belousova, E. (2013). Geodynamic significance of the boundary between the Thomson Orogen and the Lachlan Orogen, northwestern New South Wales and implications for Tasmanide tectonics. Australian Journal of Earth Sciences, 60(3), 371–412.
- Glen, R. A., Meffre, S., & Scott, R. J. (2007a). Benambran Orogeny in the Eastern Lachlan Orogen, Australia. Australian Journal of Earth Sciences, 54(2–3), 385–415.
- Glen, R. A., Poudjom Djomani, Y., Korsch, R. J., Costello, R. D., & Dick, S. (2007b). Thomson–Lachlan seismic project – results and implications. In P. C. Lewis (Compiler), Mines & Wines 2007 Orange, (pp. 73–78). Crows Nest NSW: Australian Institute of Geoscientists Bulletin 46.
- Glen, R. A., Poudjom Djomani, Y. H., Belousova, E., Hegarty, R., & Korsch, R. J. (2014). Geodynamic significance of the boundary between the Thomson Orogen and the Lachlan Orogen, northwestern New South Wales and implications for Tasmanide tectonics: Reply. Australian Journal of Earth Sciences, 61(4), 643–657.
- Glen, R. A., Saeed, A., Hegarty, R., Percival, I. G., Bodorkos, S., & Griffin, W. L. (2010). Preliminary zircon data and tectonic framework for the Thomson Orogen, north-western NSW. Maitland, NSW: Geological Survey of New South Wales, Report GS2010/0379.
- Greenfield, J. E. (2010). Structure. In J. Greenfield, P. J. Gilmore & K. Mills (Compilers). Explanatory notes for the Koonenberry Belt geological maps (pp. 341–370). Maitland, NSW: Geological Survey of New South Wales, Bulletin 35.
- Greenfield, J. E., Musgrave, R. J., Bruce, M. C., Gilmore, P. J., & Mills, K. J. (2011). The Mount Wright Arc: a Cambrian subduction system developed on the continental margin of East Gondwana, Koonenberry Belt, eastern Australia. Gondwana Research, 19(3), 650–669.
- Hegarty, R., & Doublier, M. P. (2015). Defining major structures and their depth extend under cover in the southern Thomson Orogen, New South Wales. ASEG Extended Abstracts, 2015(1), 1–5.
- Hoffmann, K. L. (1989). Tectonic setting and structural analysis of the southern Eromanga Basin, Queensland. Brisbane, QLD: Geological Survey of Queensland, Record 1989/15
- Holcombe, R. J., Stephens, C. J., Fielding, C. R., Gust, D., Little, T. A., Sliwa, R., … Ewart, A. (1997). Tectonic evolution of the northern New England Fold Belt: The Permian–Triassic Hunter–Bowen event. In P. M. Ashley & P. G. Flood (Eds.), Tectonics and metallogenesis of the New England Orogen (pp. 52–65). Sydney, NSW: Geological Society of Australia Special Publication 19.
- Klootwijk, C. (2013). Middle–late Paleozoic Australia–Asia convergence and tectonic extrusion of Australia. Gondwana Research, 24(1), 5–54.
- Korsch, R. J., & Doublier, M. P. (2016). Major crustal boundaries of Australia, and their significance for mineral systems targeting. Ore Geology Reviews, 76, 212–228.
- Korsch, R. J., Barton, T. J., Gray, D. R., Owen, A. J., & Foster, D. A. (2002). Geological interpretation of a deep seismic‐reflection transect across the boundary between the Delamerian and Lachlan Orogens, in the vicinity of the Grampians, western Victoria. Australian Journal of Earth Sciences, 49(6), 1057–1075.
- Mills, K. J., & David, V. (2004). The Koonenberry deep seismic reflection line and geological modelling of the Koonenberry region, in western New South Wales. Maitland: Geological Survey of New South Wales, Report GS2004/185
- Moresi, L., Betts, P. G., Miller, M. S., & Cayley, R. A. (2014). Dynamics of continental accretion. Nature, 508(7495), 245–248.
- Murray, C. G., & Kirkegaard, A. G. (1978). The Thomson Orogen of the Tasman Orogenic Zone. Tectonophysics, 48(3–4), 299–325.
- Musgrave, R. J. (2015). Oroclines in the Tasmanides. Journal of Structural Geology, 80, 72–98.
- Purdy, D. J., Carr, P. A., Brown, D. D., Cross, A. J., Bultitude, R. J., Lee, M. S., & Verdel, C. (2016). The Granite Springs Granite. Brisbane, QLD: Geological Survey of Queensland, Record 2016/02
- Purdy, D. J., Hegarty, R., & Doublier, M. P. (2018). Basement geology of the southern Thomson Orogen. Australian Journal of Earth Sciences, 65, 893–916. https://doi.org/10.1080/08120099.2018.1453547.
- Quinn, C. D., Percival, I. G., Glen, R. A., & Xiao, W.-J. (2014). Ordovician marginal basin evolution near the palaeo-Pacific east Gondwana margin, Australia. Journal of the Geological Society, 171(5), 723–736.
- Radke, B. (2009). Hydrocarbon and geothermal prospectivity of sedimentary basins in Central Australia; Warburton, Cooper, Perdirka, Galilee, Simpson and Eromanga Basins. Canberra, ACT: Geoscience Australia, Record 2009/2
- Roach, I. C., Brown, D. D., Purdy, D. J., McPherson, A. A., Gopalakrishnan, S., Barton, T. J., … Cant, R. (2017). GSQ Eulo 1 borehole completion record: Southern Thomson Project. Canberra, ACT: Geoscience Australia, Record 2017/07, and Brisbane Qld: Geological Survey of Queensland, Record 2017/03.
- Rosenbaum, G. (2012). Oroclines of the southern New England Orogen, eastern Australia. Episodes, 35, 187–194.
- Rosenbaum, G. (2018). The Tasmanides: Phanerozoic tectonic evolution of eastern Australia. Annual Review of Earth and Planetary Sciences, 46(1), 291–325.
- Shaanan, U., Rosenbaum, G., & Sihombing, F. M. H. (2018). Continuation of the Ross–Delamerian Orogen: insights from detrital-zircon data. Australian Journal of Earth Sciences, 65, 1123–1131. doi:10.1080/08120099.2017.1354916.
- Scheibner, E., & Basden, H. (1996). Geology of New South Wales—Synthesis. Volume 1: Structural Framework (295 pp). Sydney, NSW: Geological Survey of New South Wales Memoir Geology, 13.
- Spampinato, G. P. T., Ailleres, L., Betts, P. G., & Armit, R. J. (2015). Crustal architecture of the Thomson Orogen in Queensland inferred from potential field forward modelling. Australian Journal of Earth Sciences, 62(5), 581–603.
- Stevens, B. P. J. (1985). Preliminary interpretation of regional basement geology in northwestern New South Wales. Quarterly Notes Geological Survey of New South Wales, 61, 9–21.
- Stevens, B. P. J. (1991). Northwestern New South Wales and its relationship to the Lachlan Fold Belt. Geological Society of Australia, Abstracts, 29, 50.
- Stevens, B. P. J., & Crawford, A. J. (1992). Early to Middle Cambrian geochemistry and tectonics of northwestern New South Wales. Geological Society of Australia, Abstracts, 32, 25.
- Thalhammer, O. A. R., Stevens, B. P. J., Gibson, J. H., & Grum, W. (1998). Tibooburra Granodiorite, western New South Wales; emplacement history and geochemistry. Australian Journal of Earth Sciences, 45(5), 775–787.
- Wecker, H. R. B. (1989). The Eromanga basin. The APEA Journal, 29, 379–397.
- Wong, S. C. T., Collins, W. J., Hack, A. C., & Huang, H.-Q. (2018). Provenance and structure of the Yancannia Formation, southern Thomson Orogen: implications for the tectono-stratigraphic evolution of the Cambro-Ordovician western Tasmanides. Australian Journal of Earth Sciences, 65, 1097–1121. https://doi.org?10.1080/08120099.2018.1464062