
 ?Mathematical formulae have been encoded as MathML and are displayed in this HTML version using MathJax in order to improve their display. Uncheck the box to turn MathJax off. This feature requires Javascript. Click on a formula to zoom.
Abstract
A fully cored sequence of Hesse Clay, Port Campbell Limestone and uppermost Gellibrand Marl in the onshore Otway Basin, southeastern Australia, offers new insight into the evolution of the middle Miocene Port Campbell Limestone. The Port Campbell Limestone comprises grey unconsolidated to semi-consolidated and rarely lithified bioclastic muddy carbonate sands in a stack of thin repetitive cycles within cycles of predominantly shoaling-upward character. A glauconitic band with a distinctive mollusc–echinoderm–bryozoan fauna provides a distinctive marker interval in the sequence. In mineralogy, the Port Campbell Limestone is predominantly calcite with traces of remnant aragonite in muddier low-permeability sands, and with dolomitic zones in permeable intervals. The small non-carbonate component of the Port Campbell Limestone is between 3 and 15 wt% and comprises quartz silt with minor clay, feldspar and mica. Dissolution overprints are prominent throughout the carbonate sequence. Three distinct geochemical signatures of provenance are evident in the Port Campbell Limestone sequence, including possible volcanogenic contributions with felsic sources. Foraminifera are common and generally well preserved. Foraminiferal data suggest a depositional transition from outer shelf conditions in the Gellibrand Marl at ca 15 Ma to middle shelf environments in the lower part of the Port Campbell Limestone during the Middle Miocene Climatic Optimum (MMCO) at ca 14.24 Ma. Shallowing after 14 Ma indicates variable paleodepths of <70 m during and following the end of the Middle Miocene Climatic Transition (MMCT) at ca 13.2 Ma when the sequence was emergent for a brief but undetermined period, corresponding with sharp changes in geochemical ratios. Observed cyclicity in these mid-shelfal, cold-water carbonates is strongly correlated with orbital forcings—eccentricity and obliquity. Sedimentation rates determined from cyclostratigraphic analysis indicate 4–6 cm/kyr at the end of the MMCO, diminishing to 1.5–3 cm/kyr during the MMCT and the subsequent accumulation of the Port Campbell Limestone.
The Port Campbell Limestone is a stack of thin repetitive depositional cycles within cycles. The cyclicity is strongly correlated with orbital forcings—eccentricity and obliquity—and this is reflected in the geochemistry.
Foraminiferal data suggest a depositional transition from outer shelf conditions in the Gellibrand Marl at ca 15 Ma to middle shelf environments in the lower part of the Port Campbell Limestone during the Middle Miocene Climatic Optimum (MMCO) at ca 14.24 Ma.
The sequence was emergent for a brief but undetermined period at ca 13.2 Ma, corresponding with sharp changes in geochemical ratios.
Three distinct geochemical signatures of provenance are evident in the Port Campbell Limestone sequence, including possible volcanogenic contributions with felsic sources.
KEY POINTS
Introduction
The middle to upper Miocene Port Campbell Limestone is perhaps best known internationally as the host sequence that forms the Twelve Apostles, the iconic tourist attraction on the southern coastline of Victoria. Groundwater from the Port Campbell Limestone supports regional agriculture, industry and town water supplies, and the aquifer has been the subject of extensive monitoring and hydrogeological studies (e.g. Bush, Citation2009). Despite the abundance of coastal outcrop and substantial subsurface investigation of these middle to upper Miocene units in the region, cores are rare for the Port Campbell Limestone.
Two fully cored shallow drillholes were completed in 2019 on the eastern flank of the Port Campbell Embayment at the CO2CRC Otway International Test Centre (). This facility hosts a carbon capture and storage demonstration project that has, to date, injected over 80 000 tonnes of CO2 into two separate deep reservoirs (Jenkins et al., Citation2012; Pevzner et al., Citation2017). While the geology of these deeper reservoirs is well understood through seismic and other investigations, relatively little was known about the near-surface geology, particularly within the Port Campbell Limestone (Bailey et al., Citation2017).
Figure 1. Location of the CO2CRC Otway Facility at South Nirranda, Victoria.
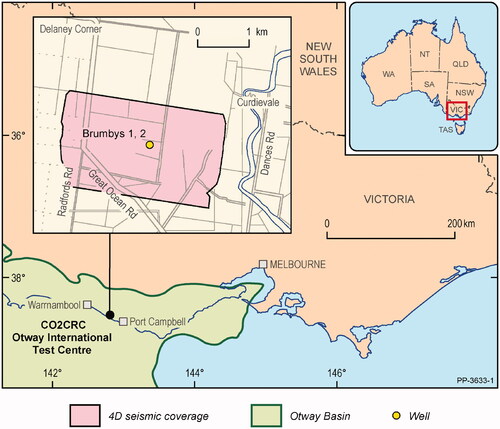
CO2CRC is undertaking a feasibility study for a planned controlled release and monitoring experiment at a shallow geological fault on this site (Feitz et al., Citation2017, Citation2021; Feitz, Tertyshnikov, et al., Citation2018). Drilling was undertaken to characterise the near-surface geology and to provide a basis for understanding the influence of faulting on CO2 migration behaviour. The main objectives of the drilling of Brumbys 1 and 2 bores, as well as two sets of co-located dual piezometers, were to: obtain a cored section of the Port Campbell Limestone, confirm the position and vertical displacement on the fault; investigate the character of the fault zone; establish the geotechnical and hydrogeological properties of the sequence; install fibre optics and geophones for later monitoring; and to complete the holes as piezometers and groundwater monitoring wells. Sonic drilling was employed to ensure excellent recovery of the mostly friable carbonate and to minimise fluid contamination of the sequence.
This paper describes the lithostratigraphy, mineralogy, diagenesis, geochemistry and micropaleontology of the stratigraphy intersected by the Brumbys 1 drillhole, and interprets age, environments and influences on deposition of the Port Campbell Limestone. Some comparisons are made with coastline outcrops and with the Nullawarre 3 well.
Regional geology
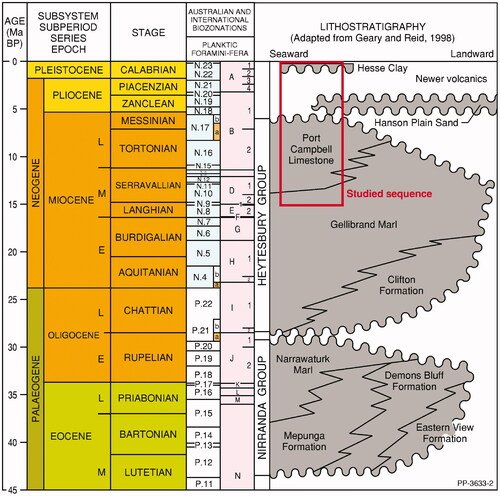
The coastal Otway Basin in southeastern Australia has an area of ∼150 000 km2 onshore and offshore and is characterised by a thick succession of Mesozoic to Cenozoic terrestrial to marine strata that were deposited as Australia rifted away from Antarctica and drifted northward (Laing et al., Citation1989; McLoughlin, Citation2001). Its Paleogene to Neogene history is characterised by increasingly fully marine carbonate sequences that were deposited in neritic to upper slope conditions (Gallagher & Holdgate, Citation2000; Holdgate & Gallagher, Citation2003). The Oligocene to Miocene Heytesbury Group forms a significant portion of the Cenozoic Otway Basin succession () representing the final megacycle of sediment accumulation in the Otway Basin. The region was covered by extensive alluvial outwash deposits of the Hanson Plain Sand during the Pliocene and aerial exposure led to the development of the Timboon Surface with karstic topography on Port Campbell Limestone (Edwards, Tickell et al., Citation1996). Large outpourings of basalt covered the northern margin of the basin, and younger, explosive volcanism (Newer Volcanics) produced numerous scoria cones and maar craters (Edwards, Leonard, et al., Citation1996). A derivative of this volcanism appears to be the thin Hesse Clay that caps the Timboon Surface across the region.
Figure 2. Stratigraphic context of the Port Campbell Limestone in the Otway Basin.
Site stratigraphy and geomorphology
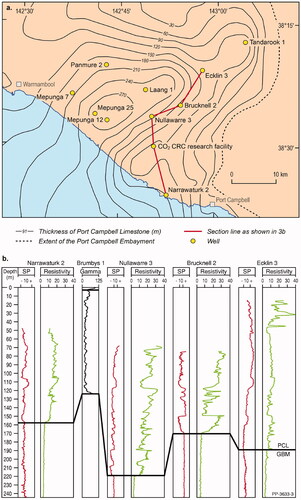
The CO2CRC Otway International Test Centre is located at South Nirranda, Victoria, on a private farming property ∼35 km southeast of Warrnambool (). The stratigraphy of interest is the sequence intersected by the Brumbys 1 drillhole, namely the uppermost Gellibrand Marl, Port Campbell Limestone and Hesse Clay. Within the Port Campbell Embayment, the Port Campbell Limestone reaches a thickness of 297 m in Mepunga-25 (Tickell et al., Citation1992), whereas at the CO2CRC site (Brumbys 1), it is only 120 m thick. In a north-to-south section line of this part of the embayment (), the regional cyclic character of the Port Campbell Limestone is indicated in resistivity logs. This character is attributed to cycles at various scales, of upward diminishment of clays and fine-grained siliclastics, with corresponding increased porosity and permeability. In Brumbys 1, only a continuous gamma log is available, and this larger-scale cyclicity is not readily evident. However, the entire formation comprises thin carbonate cycles (third order), each with a predominant upward decrease in total silicate content.
Figure 3. (a) Isopach map of the Port Campbell Limestone in the Port Campbell Embayment (Bush, Citation2009). (b) Character of the Port Campbell Limestone is defined by SP (LHS) and Resistivity (RHS) logs in all wells except Brumbys 1 (Vcl gamma only). Shoaling-upward cyclicity (Resistivity) appears to be characteristic. Resistivity cycles suggest both decreasing salinity of porewaters and/or increased porosity in cleaner carbonates upcycle. The thick black line indicates the boundary between the Port Campbell Limestone (PCL) and Gellibrand Marl (GBM) based on resistivity/gamma signal and well logs. In Brumbys 1, the boundary between the Hesse Clay and Port Campbell Limestone is also shown.
The CO2CRC site lies within flat black soil terrain with Brumbys 1 at 43.90 m AHD (Australian Height Datum) and Brumbys 2 at 43.95 m AHD. Subtle swale features align northeast in the direction of local drainage (). There is a gentle rise in elevation southwards to a dune crest at 50 m AHD. This broad dune complex of southeast alignment adjoins immediately to the south of the study area. The feature was mapped as coastal dune deposits of mixed quartz and calcareous sand, and ascribed a Quaternary age (Edwards, Tickell et al., Citation1996). The substrate to this feature may be much older, predating the development of the Timboon Surface as inferred from atypically deeper oxidation of the Port Campbell Limestone sequence adjoining this complex. To the south of the dune, subtle undulating karst topography suggests erosional loss of the Hesse Clay ().
Figure 4. View northwards of CO2CRC Otway site adjoining a prominent dune system. The Otway site has a terrain of subtle swale features aligned northeast. South of the dune system features of similar alignment have exaggerated relief suggestive of karst enhancement on the Port Campbell Limestone, probably due to erosional loss of the capping Hesse Clay. LIDAR image. Note that regional seismic suggests that Brumbys Fault is ∼1.2 km long and only the portion imaged using high-resolution seismic (top of Port Campbell Limestone) is shown here.
Methods
Brumbys 1 drillhole and reference depth measurements
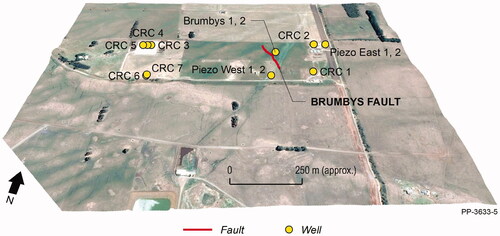
Brumbys 1 was drilled in February 2019 as part of near-surface characterisation drilling campaign at the CO2CRC Otway research site. Two inclined groundwater observation wells (Brumby 1 at 80° to 126.6 m and Brumby 2 at 45° to 36 m) were successfully drilled through Brumbys Fault. Core material was collected for geochemical and geomechanical testing (Feitz et al., Citation2020). Depths cited are downhole core depth unless otherwise stated; because of the 80° inclination of Brumbys 1, true depths are 0.985 of core depth. The two fully cored boreholes intercept Brumbys Fault at two different depths within the Port Campbell Limestone. Brumbys 2 was designed for a shallow intercept of the fault, just below the Hesse Clay, intercepting the fault at ∼4.7 m downhole. Brumbys 1 intercepted the fault deeper at 91 m depth (). The bores were cored/drilled using a Sonic Boart Longyear LS600 coring rig. Two pairs of groundwater piezometers (one of each pair in the upper clay layer 2–3 m, the other 24 m into the Port Campbell Limestone) were also installed ().
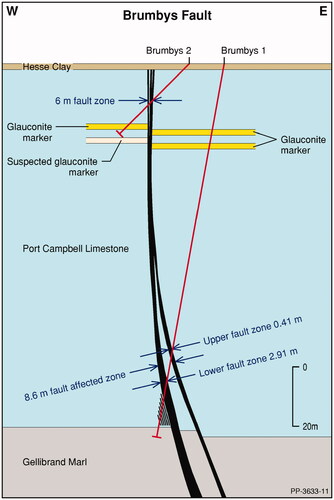
Figure 5. Schematic of Brumbys Fault and drilling intercepts from Brumbys 1 and Brumbys 2, with 2 m displacement of glauconitic mud marker at 28 m depth and ∼4 m displacement at top of Gellibrand Marl (3 D seismic interpretation). Horizontal distances not to scale.
In addition to the core, a full suite of logging runs were acquired in Brumbys 1 well, and consequently this well is the focus of the present paper. The 95% core recovery from the Port Campbell Limestone at this site is a valuable addition to the few incomplete cores available for study even though 2 m of section is absent in the Brumbys 1 sequence through fault displacement. In all sonic drillholes at the CO2CRC site, the sequence of Port Campbell Limestone is undisturbed except within the fault zone, although the sequence is affected by diagenetic modification.
Wireline logs
During the drilling of Brumbys 1, loss of circulation in thin aquifers and upper fault zone necessitated steel casing of the hole below 40 m. Casing was extended to 96 m, but the deepest interval remained uncased from 96 to 126.6 m. Two runs of the full suite of wireline logs (i.e. sets of geophysical tools lowered into the drillhole) were conducted. An early run of all logs was made in the uppermost uncased 40 m. The second run was from surface to total depth. The wireline suite included calliper, density, gamma, spontaneous potential, short and long normal resistivity, neutron porosity, and sonic imaging. Analysis and interpretation of logs and their derivatives are presented in Wang et al. (Citation2020).
Sediment/rock analyses
Detailed description of sampling strategy and procedure, sample preparation, analytical procedures and data are presented in appendices of Radke et al. (Citation2020). These appendices address: thin-sectioning and petrography, X-ray diffraction, geochemistry, mercury injection capillary pressure (MICP), porosity and permeability, rock properties, surface area analysis, bulk density, carbonate content, grainsize analysis and geochemistry of major and trace elements. Further interpretation of MICP, porosity and permeability are covered by Wang et al. (Citation2020).
Lithostratigrapic subdivision of the Port Campbell Limestone using geophysical logs
With the uniform appearance of the core of the Port Campbell Limestone, it was necessary to use the geophysical logs for lithostratigraphic subdivision. The gamma log is a splice of several runs down open and cased intervals of the hole. The reduced resolution of the gamma log in the cased middle part of the sequence negated a consistent delineation of third-order units. Delineation at higher resolution of the third-order unit is based on the proportion of clean (lower gamma) carbonate over muddier and marly (higher gamma) carbonate (Radke et al., Citation2020).
Mineralogical, geochemical and permeability data indicated a need for a lower-resolution subdivision of the formation. Neural network modelling (Aliouaine et al., 2013) using a multilayer perceptron (MLP) classifier enabled an objective identification of second-order units through the integration of gamma logs, effective porosity and permeability logs (Wang et al., Citation2020). This second subdivision was also integrated with seismic data for subsequent static and dynamic modelling (Wang et al., Citation2020).
Biostratigraphy
Qualitative benthic and planktic foraminiferal analyses were carried out on 47 samples from Brumbys 1 well. Samples were processed for foraminifera by standard microfossil techniques. Each sample was water-washed and wet-sieved (>63 µm) to disaggregate the samples. The dried residue was spread on a picking tray, and foraminifera were documented for biostratigraphic and paleoenvironmental analyses.
The preservation state of the assemblages was qualitatively estimated and ranged from excellent to good to poor (where the foraminiferal tests were either broken or fully replaced by diagenetic minerals). Qualitative benthic assemblage (C = common, X = present) and presence/absence biostratigraphic data were compiled from the >63 µm fraction (). Randomised transects of parts of the residue were counted for planktic vs benthic foraminifera. For this study, >100 tests were counted to determine the %planktics.
Table 1. List of Miocene planktic foraminiferal datums used for biostratigraphic analyses in southeast Australia.
Benthic (and planktic) foraminiferal taxonomy followed that of Gallagher et al. (Citation1999, Citation2001), Gourley and Gallagher (Citation2004), Gallagher and Gourley (Citation2007) and Li and McGowran (Citation1994). The Cenozoic planktic foraminiferal taxonomy followed Bolli et al. (Citation1985) and Wade et al. (Citation2018). The Cenozoic foraminiferal biostratigraphy was calibrated to the Gradstein et al. (Citation2020) biochronology tables (). This was used to recalibrate the Taylor Zonation (Taylor, Citation1971a, Citation1971b), and extra range datums listed in Bolli et al. (Citation1985) and the Globorotalia lineage of Cifelli and Scott (Citation1986), Scott et al. (Citation1990) and Wade et al. (Citation2011, Citation2018).
The paleoenvironmental interpretation of the foraminiferal assemblages was based on regional modern analogues (Smith et al., Citation2001; Smith & Gallagher, Citation2003), where inner shelf = 0–50 m depth, middle shelf = 50–100 m and outer shelf = 100–200 m (), and comparative Otway, Murray, Port Phillip and Gippsland basin regional Miocene microfossil studies (Gallagher et al., Citation1999, Citation2001; Gourley & Gallagher, Citation2004; Gallagher & Gourley, Citation2007); Li & McGowran, Citation1994). The total percentage planktic foraminifera in marine strata is related to the proximity of the shoreline (oceanicity) and paleodepth (van der Zwaan et al., Citation1990, Citation1999). Approximate paleodepths may be calculated from the %planktic (%P) using the equation of van der Zwaan et al. (Citation1990) as follows:
(1)
(1)
The error range on this estimation is ∼± 20 m using regional southeast Australian modern analogues (Gallagher et al., Citation2013; Smith et al., Citation2001; Smith & Gallagher, Citation2003). A combination of benthic assemblage distribution with %planktics was used to determine relative paleodepths. As the benthic assemblages were established qualitatively, interpretations are deemed approximate.
Cyclostratigraphy
All spectral analyses of the gamma log in this study were carried out using the multitaper method (MTM) with three 2π-tapers (Thomson, Citation1982) and LOWSPEC background estimation (Meyers, Citation2012), as implemented in the R-package ‘astrochron’ (Meyers, Citation2014). The confidence levels were calculated applying the LOWESS-based (Cleveland, Citation1979) procedure of Ruckstuhl et al. (Citation2001). Depth-to-time conversion and bandpass filtering was carried out using functions ‘tune’ and ‘bandpass’ from the same R-package.
Results
Brumbys Fault
The Brumbys Fault has characteristics of a shallow strike slip fault of Neogene age (Feitz, Tertyshnikov, et al., Citation2018) that is not coupled to deeper faulting in the underlying Nirranda Group (Feitz et al., Citation2017). In the Brumbys 1 drillhole, the fault is identified as two zones of thixotropic muddy breccia: an upper zone 1.2 m thick from 91.3 to 92.5 m; and a thicker 6 m zone from 101.8 to 108.0 m (), in which some thin individual carbonate bands are brecciated (). Between the upper and lower fault zones, there is an intermediate 9 m interval of relatively undisturbed sequence. Despite a loss to sequence through a 2 m fault displacement, Brumbys 1 is the most completely cored sequence available to date for the Port Campbell Limestone.
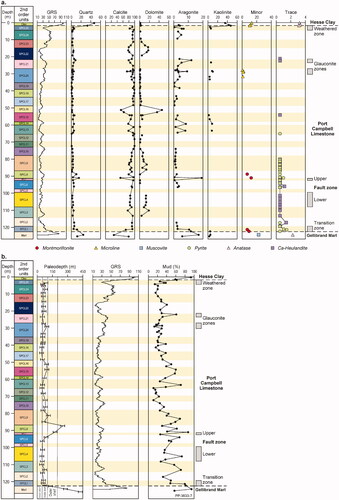
Figure 6. Port Campbell Limestone lithofacies: column 1, core log depth; column 2, second-order SPCLunits; column 3, gamma log (GRI) and graphic of inferred lithology (mud(brown)-sand (yellow)); column 4, high-resolution (GR) and smoothed gamma (GRS) logs with SP log; column 5, visually interpreted third-order depositional events. The second-order cycles were determined from integration of gamma logs, effective porosity and permeability logs with correlation to seismic data. Core log depths and SPCLunits (column 2) are used for all discussion in this paper.
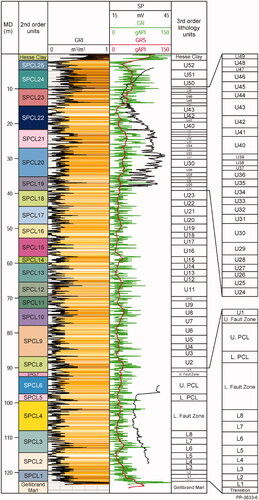
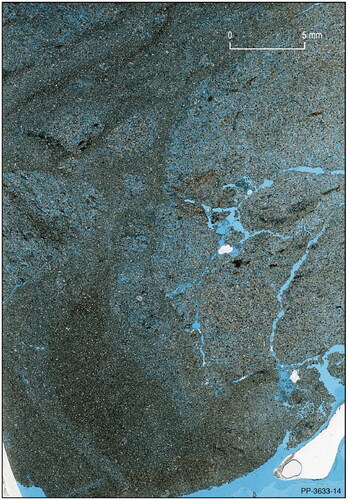
Figure 7. Limestone clasts of variably rotated orientation within a dense muddy matrix exhibiting flow laminae. Lower fault zone, NPCL 4, Brumbys 1. Horizontal field of view is 23 mm; blue denotes porosity.
Cores from shallow holes, completed as piezometers at a distance of at least 100 m from the fault zone (), indicate that the Port Campbell Limestone is undisturbed except within the fault zone. However, late diagenetic effects may be attributed to increased permeability along the fault zone.
Refraction seismic modelling (Feitz, Radke, et al., Citation2018) suggests that the fault follows a pervasive joint fabric, with intervening jogs of 30° departure (). Across the CO2CRC site, several paralleling dislocations were detected, showing the pervasive effects of stress and weathering on the sequence. The dip of Brumbys Fault plane flattens slightly downwards from near vertical at the base of the Hesse Clay, to 80° at the top of the Gellibrand Marl (122.5 m), and merges into the bedding orientation at greater depth, presumably within the Clifton Formation (Feitz et al., Citation2017).
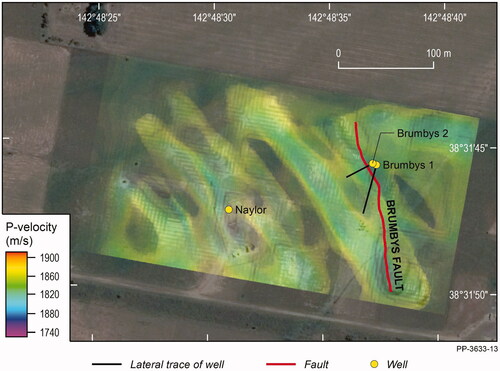
Figure 8. Brumbys Fault and intercepting boreholes Brumbys 1 and 2 within part of the CO2CRC Otway site. Variable depth and degree of weathering in the upper Port Campbell Limestone is influenced by regional jointing as indicated by refraction seismic tomography using seismic P velocities. Alignment of lower velocity zones (<1900 m/s) caused by higher porosity carbonates along apparent joint sets. The trace of the Brumbys Fault at the top of the Port Campbell Limestone shows strike slip character, both paralleling jointing and with jogs up to 30°. Note that regional seismic suggests that Brumbys Fault is ∼1.2 km long and only the portion imaged using high-resolution seismic (top of Port Campbell Limestone) is shown here.
Stratigraphy
The cored sequence in Brumbys 1 consists of a thin 1.8 m cap of Hesse Clay overlying 121 m of Port Campbell Limestone, which gradationally transitions into the uppermost part of the underlying Gellibrand Marl (). The thickness of this transition zone (SPCL1) is ∼3.2 m.
Gellibrand Marl
The Gellibrand Marl is a compact fossiliferous dark greenish grey marl, with well-preserved bryozoans, scaphopods, bivalves, foraminifera, ostracods and echinoids. Porosity is generally extremely low but variable and higher in burrow-infill sediments with up to 20% interparticle porosity. The non-carbonate content in the Gellibrand Marl is high: quartz silt 12–24 wt%, muscovite 0–22.6 wt%, kaolinite 2.9–5 wt%, and anatase 0–2.3 wt% (). The carbonate content ranges from 35 to 70 wt% CaCO3 compared with 50–97 wt% in the overlying Port Campbell Limestone. However, cement infill of grainstones is present in the heavily bioturbated parts of the Gellibrand Marl with CaCO3 content up to 79 wt%. Aragonite abundance can be as high as 17 wt% but steadily decreases upwards from the Gellibrand Marl through the transitional zone of the Port Campbell Limestone to only trace amounts. Such high aragonite content in the Gellibrand Marl indicates the minimal diagenetic alteration of skeletal carbonate, presumably because of reduced permeability in the more compact sediment.
Figure 9. (a, b) Whole-rock mineralogy determined through XRD analysis. Only the mud fraction is presented. Grainsize was determined though dry sieving into Wentworth scale fractions (wt%), with mud/silt/clay (<63 µm), sand (63–2000 µm) and gravel (2–>16 mm) proportions for each sample. Laser diffraction analysis was used for very fine-grained samples and the results are included in the ‘mud’ size fraction (converted to wt%).
Port Campbell Limestone
Near the Brumbys Fault, the Port Campbell Limestone is primarily a permeable sequence of grey unconsolidated to semi-consolidated and ‘lumpy’ bioclastic muddy carbonate sands and limey marls. The carbonates are predominantly bioclastic, yet most bioclasts are largely of indeterminate origin, likely the result of high bioturbation, comminution and micritisation.
The formation is predominantly carbonate with minor siliciclastics. Minor aragonite is present in muddier units with lower permeability. Dolomite is present as a component of cements in four intervals associated with permeable intervals (SPCL3, SPCL4, mainly SPCL10 and SPCL17, and SPCL22–SPCL33) (). The non-carbonate component is between 3 and 10 wt%, comprising quartz silt with minor clay, feldspar and mica. At the Brumbys Fault, the Port Campbell Limestone is uniform in general appearance and colour making it difficult to subdivide visually, but it has variable and incomplete induration. The most distinctive zones within the Port Campbell Limestone sequence include: the basal transition zone up from the underlying Gellibrand Marl, the fault zone, a subtle disconformity, a glauconitic mud interval and an upper weathered zone ().
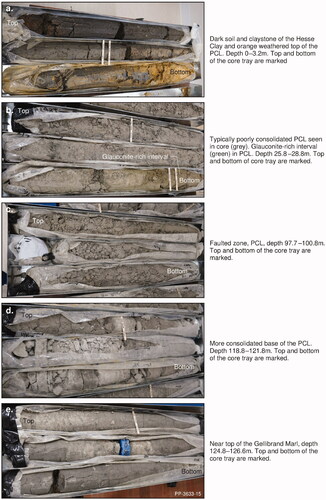
Figure 10. Key features of the Hesse Clay, Port Campbell Limestone and top of Gellibrand Marl in Brumbys 1. Core tray lengths are 1 m.
Basal transition zone
The transitional zone (SPCL1 in ) is a dark greenish grey, heavily bioturbated, calcareous muddy clay with fine sand bioclastic-pelletal grainstone infill of burrows. This marl is compact with wavy laminae and variably bioturbated. The sediment becomes increasingly compact and higher in siliciclastic content down into the Gellibrand Marl.
Fault zone
The fault zone has an upper and lower component at the level it was intersected ( and ). Between the upper thin zone (SPCL7) and a thicker lower zone (SPCL4) lies an intervening undisturbed sequence (SPCL5, SPCL6). The fault zones are recognised by bands of a soft mud matrix containing brecciated and rotated clasts of limestone.
Disconformity
A subtle disconformity at 65.5 m depth (at the top of SPCL12) is indicated by an underlying lighter colour, slight U enrichment, and rough corrugate dissolution surfaces on thin indurated carbonate bands with vuggy macroporosity exceeding 40%. There is a distinct change in geochemistry across this disconformity ().
Figure 11. (a, b) Geochemical signatures and ratios from XRF and ICP-MS analysis (note, CaCO3 analysis was completed separately). (c) Plots of Ce, Eu/Eu*, (La/Nb)N, Sr, Th and Zr/TiO2 vs depth (m). Green circles = Hesse Clay; blue squares and yellow circles = Port Campbell Limestone (high- and low-U, respectively see ); and orange diamonds = Gellibrand Marl. Values for Ce and Th for Hesse Clay are significantly higher (Ce 169–217 ppm, Th 24.6–30 ppm), than in the other units (and plot off the figures). Note the broad increase up hole (decreasing depth) in Ce, Th and ratios Eu/Eu*, (La/Nb)N, and corresponding decrease in Sr. The Zr/TiO2 ratio also shows a broad increase up hole with a pronounced increase in range above 30 m, suggesting input of a more siliceous source. Also of note are the samples from the lower part of the Port Campbell Limestone (below 115 m), which show a transition for many elements with the underlying Gellibrand Marl (most evident in Ce and Eu/Eu*). Eu/Eu* = (2*Eu/0.058)/(Sm/0.153 + Gd/0.2055), is a measure of the degree of enrichment (>1) or depletion (<1) in Eu relative to the other rare earth elements. (La/Nb)N [La/Nb ratio normalised to primitive mantle] = (La/0.687)/(Nb/0.713), and is a measure of the relative depletion of Nb relative to La.
![Figure 11. (a, b) Geochemical signatures and ratios from XRF and ICP-MS analysis (note, CaCO3 analysis was completed separately). (c) Plots of Ce, Eu/Eu*, (La/Nb)N, Sr, Th and Zr/TiO2 vs depth (m). Green circles = Hesse Clay; blue squares and yellow circles = Port Campbell Limestone (high- and low-U, respectively see Figure 20); and orange diamonds = Gellibrand Marl. Values for Ce and Th for Hesse Clay are significantly higher (Ce 169–217 ppm, Th 24.6–30 ppm), than in the other units (and plot off the figures). Note the broad increase up hole (decreasing depth) in Ce, Th and ratios Eu/Eu*, (La/Nb)N, and corresponding decrease in Sr. The Zr/TiO2 ratio also shows a broad increase up hole with a pronounced increase in range above 30 m, suggesting input of a more siliceous source. Also of note are the samples from the lower part of the Port Campbell Limestone (below 115 m), which show a transition for many elements with the underlying Gellibrand Marl (most evident in Ce and Eu/Eu*). Eu/Eu* = (2*Eu/0.058)/(Sm/0.153 + Gd/0.2055), is a measure of the degree of enrichment (>1) or depletion (<1) in Eu relative to the other rare earth elements. (La/Nb)N [La/Nb ratio normalised to primitive mantle] = (La/0.687)/(Nb/0.713), and is a measure of the relative depletion of Nb relative to La.](/cms/asset/3fa198ac-705d-4b93-be28-509975223863/taje_a_1998220_f0011_c.jpg)
Glauconitic clay marker
Distinctive intervals of glauconitic carbonate mud, occur in units SPCL20 and SPCL21 ( and ) with greenish grey-coloured gritty bioclastic sands () containing scaphopod molluscs, echinoderms and bryozoans. The distinctive character of these glauconitic zones, evident in geochemical profiles in both Brumbys 1 and Brumbys 2, was used to establish a 2 m faulted downthrow to the east within the upper sequence of the Port Campbell Limestone ().
Weathered zone
The uppermost surface of the Port Campbell Limestone is a 6 cm thick yellowish brown pisolitic ferricrete crust atop a 2.7 m interval of thick light olive brown oxidised ferruginous carbonate sand (SPCL25 in and ). This unit has minor quartz, kaolin and aragonite. Uranium content, although lower in this uppermost oxidised unit, shows a progressive increase upwards from 15 m depth through SPCL23, and SPCL24 towards this weathering zone, with a corresponding increased gamma response (). This weathering zone and lateritic crust probably correspond to the development of the Pliocene Timboon Surface (Edwards, Leonard, et al., Citation1996; Gill, Citation1965; Wallace et al., Citation2005).
Hesse Clay
The thin surface interval of a dense clayey mud 1.8 m thick is assigned to the Hesse Clay. This assignation was made by comparison with the stratigraphic relationships defined at Sturgess Point, Port Campbell by Bailey et al. (Citation2017). The Hesse Clay is made up of quartz silt (33–47 wt%), kaolinite (35–47 wt%), sub to euhedral microcline feldspar silt (10–13 wt%), and anatase (3.1–3.3 wt%) (). The unit has an overall very low calcium carbonate content of <1 wt%, with traces of aragonite (0–4.2 wt%) and dolomite (1.3–2.5 wt%). Within the lowermost part of this unit, there is a minor presence of coarse ferruginous-stained quartz sand. Thorium has a significant influence in the gamma response of the Hesse Clay (), as indicated by lowered U/Th ratios.
The mineralogical characteristics of this unit suggest derivation from a volcanogenic source. Hesse Clay mineralogy includes a significant proportion of both microcline and kaolinite, in addition to quartz, suggesting some igneous input, most probably airborne. The presence of euhedral microcline feldspar supports a direct volcanic source, possibly from original xenocrysts. Joyce (Citation1975) noted alkali feldspar xenocrysts in scoria cones in the western plains of Victoria. Another possible source is from more differentiated alkaline volcanism. Wellman (Citation1974) reported alkali feldspar in trachytic volcanics to the northwest of Melbourne. The southern extent of the Western Plain Subprovince of the Pliocene–Holocene Newer Volcanics (Lesti et al., Citation2008) lies 12 km to the north of the CO2CRC site. Without dating, the Hesse Clay is considered possibly coeval with or younger than the Newer Volcanics and postdates the Pliocene Timboon/Hanson Plain surface rather than precede it as suggested by Williams et al. (Citation2013).
Based on regional mapping, the Hanson Plain Sand is indicated to overlie the Port Campbell Limestone at this site (Edwards, Tickell et al., Citation1996; Edwards, Leonard, et al., Citation1996) but is absent in all cores near the Brumbys Fault. Only the minor presence of ferruginised quartz sand in the lowermost part of the Hesse Clay suggests a possible contribution from Hanson Plain Sand. The uppermost ferruginised weathered zone of the underlying Port Campbell Limestone lacks any quartz sand.
Cyclicity within the Port Campbell Limestone
Large period cycles in the Port Campbell Limestone, in the order of tens of metres, are seen in the coastal cliffs () and in adjoining wells (), especially Nullawarre 3 (). Such decametre-scale cycles appear to culminate in cleaner limestones with corresponding higher resistivities. However, comparable large period cycles are not evident in the sequence in Brumbys 1. Casing used during drilling has resulted in incomplete self-potential and resistivity logs (Wang et al., Citation2020) and precludes any direct comparison with adjoining wells (). Only one shoaling-upward cycle (from SPCL20 up to SPCL23) of comparable scale is evident in the sequence at the CO2CRC Otway site (). It is possible that because of the proximity to the fault, larger cyclic signals have been diminished by diagenetic alteration, especially carbonate dissolution.
Figure 12. Cliff face on Sturgess Point at Port Campbell, demonstrating preferential weathering by lithology. Shoaling-upward cycles are evident, from a basal marly limestone to marl upward to limestone. Cliff height from sea-level to base Hesse Clay is 22 m (After DSE, Citation2011).
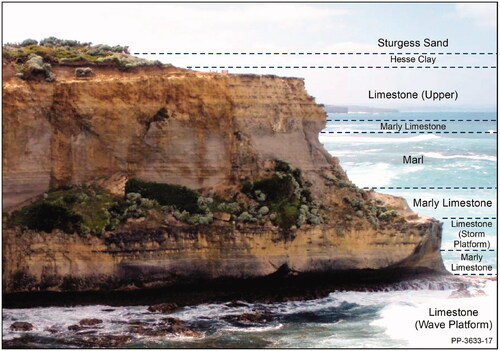
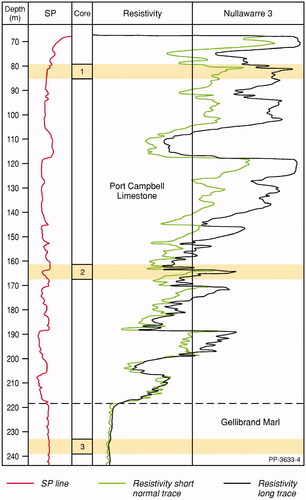
Figure 13. Self-Potential (SP) and Resistivity logs of Nullawarre 3 bore with cored intervals. Resistivity short (green trace) and long normal (black trace) (Department of Mines, Victoria, Citation1965) showing a distinctive large period cyclicity within the Port Campbell Limestone.
Although the Port Campbell Limestone is a visually uniform sequence, thin depositional cycles of predominantly shoaling-upward character are interpreted from the gamma log. Depositional cycles are seen to be third-order units in the order of 1.7 m thickness in the lower part of the formation below the fault zone and diminishing to an average of 1.14 m thickness in the upper 35 m of the formation.
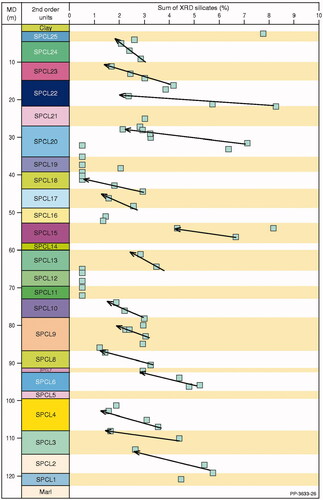
Wang et al. (Citation2020) used a MLP classifier to differentiate 25 SPCLunits as a framework (, column 2) to better describe the variations within the Port Campbell Limestone based on mineralogy (), geochemistry () and porosity/permeability (). The SPCLunits were also correlated to seismic horizons. Further cyclicity is observed in the variation of total silicates with depth. Repeated cycles of silicate-rich (5–6%) to silicate poor (1–2%) variations, with length-scales of ∼10 to <5 m, are evident. These cycles appear to correspond closely (but not exactly) to the identified SPCL subdivisions (). An additional approach to understand the cyclicity is through the application of quantitative cyclostratigraphic methods (Sinnesael et al., Citation2019). Here we use the gamma-log curve integrated with biostratigraphic foraminifera datums (refer to the Cyclostratigraphy section).
Figure 14. Averaged porosity and permeability for SPCLunits of the sequence: column 1, core depth; column 2, lithostratigraphic SPCLunits; column 3, gamma log (GRI) and graphic of inferred lithology (mud (brown)-sand (yellow)); column 4, high-resolution gamma (GR) and smoothed gamma (GRS) log; column 5, porosity; column 6, permeability (mD).
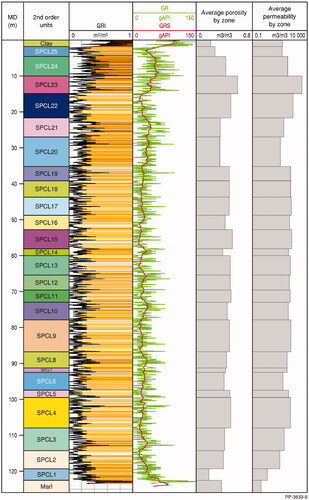
Figure 15. Total silicates (from XRD results) versus depth. In detail, the plot of total silicates versus depth shows repeated cycles of silicate-rich (5–6 wt%) to silicate poor (1–2 wt%) variations, with length-scales of ∼10 to <5 m.
Character of the Port Campbell Limestone
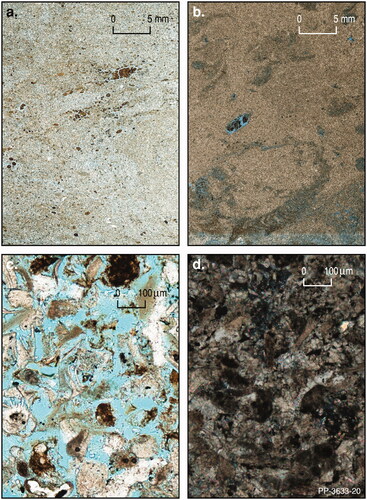
The generally unconsolidated fine-grained carbonate sediment has uniform mid-grey appearance but is ‘lumpy’ and texturally variable () from bioturbation, as well as from subsequent cementation and later dissolution effects. Grainstone and packstone textures predominate. The matrix of variably indurated lumpy limestones is packstone. Wackestone and mudstone textures are rare.
Figure 16. Left: Bioturbated semi-consolidated bioclastic muddy sand with shrinkage artefacts (blue cracks). Right: Lumpy bioclastic limestone with semi-indurated lumps in a matrix of bioclastic sand. Lateral field of view in each image is 23 mm. Both sections are from SPCL24.
In Brumbys 1, macrofossils such as scaphopod and bivalve fragments and echinoid plates are also rare. In thin-section, echinoid fragments and foraminifera are the most ubiquitous identifiable bioclasts. Identifiable fragments of molluscs, bryozoans, brachiopods and bivalves, as well as disarticulated ostracod valves, are not as common (). Many carbonate particles (30–60%) are of indeterminate origin as a result of fragmentation, abrasion and some micritisation, but they are interpreted to have a bioclastic origin.
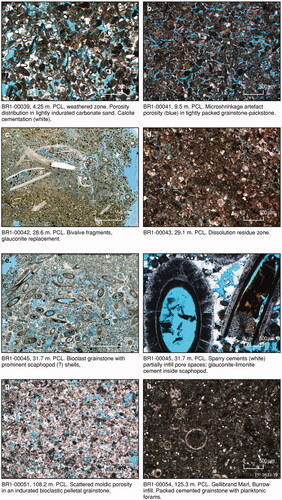
Figure 17. Overview of carbonates in the Port Campbell Limestone and Gellibrand Marl examined in thin-section.
Serpulid worm tubes and calcareous red algal fragments have been recorded in the Port Campbell Limestone elsewhere (Nicolaides, Citation1995) but have not been identified in Brumbys 1 core. Echinoid spines and fragments are readily identifiable by their syntaxial cement overgrowths that create a random induration in the sediment. Pellets, of presumed faecal origin, are generally not common (<20%).
The Port Campbell Limestone is dominated by carbonates, calcite with lesser dolomite and aragonite, which were identified through XRD analysis and corroborated by calcium carbonate content analysis. Total carbonate content ranges from 50 to 97 wt%, with an average of 85 wt%. ( and ).
Quartz and minor feldspar in the Port Campbell Limestone sequence are detrital. The mineralogy ( and ) clearly shows the fluctuating presence up sequence but remaining predominantly between 1% and 5% as silt to very-fine-grained sand grains. Despite the low detrital content, a consistent cyclic zonation is evident within the Port Campbell Limestone comprising cycles of decreasing detrital content, from 5–10 wt% to 1–2 wt% ( and ).
The clay content in the sequence is very low, generally absent but with some zones up to 10 wt% (). Montmorillonite occurs in two narrow zones of the lower sequence, while kaolinite is present in five specific zones of the upper sequence, from SPCL13 upwards. Mineralogical and grainsize variations in a stratigraphic context are presented in . A detailed description of these characteristics is presented in the Supplemental data.
Diagenesis
The lumpiness of carbonates in the sequence appears to be predominantly the result of patchy localised cementation. Stratiform horizons with concretions, continuous over kilometres, occur in outcrop along coastal cliffs (Tickell et al., Citation1992). Once such cemented patches develop as concretions, they may subsequently be subjected to dissolution on their outer margins, with a residue of less soluble particles and fines accumulating in the surrounding matrix ().
Where calcite cements are present, they are predominantly syntaxial overgrowths on clean echinoid fragments that may develop into localised poikilotopic cement patches that envelop other bioclasts. Scalenohedral and blocky druse cements fringe internal cavities of larger bioclasts. If particles other than echinoids are encrusted by cement, it is as thin inconspicuous fringe cements. Where moldic porosity has developed with dissolution of shell material, these fine cement fringes may remain intact and retain the outline of the bioclast, preserving the original texture but with porosity greatly enhanced.
Hardbands, indurated by carbonate cements, are generally 1–10 cm thick and typically have a grainstone texture; porosity is generally moldic. The surface of hardbands is commonly rough to rugose to cuspate, indicative of surface dissolution.
Loss of carbonate in the sequence can be at varying scales and to different degrees, and accordingly has been difficult to quantify. The contrast between well-cemented low-porosity grainstones and high moldic porosity in similar grainstones is most clearly illustrated in a comparison of intervals affected by only phreatic cementation, and those with subsequent vadose diagenesis in Nullawarre 3 (). Vadose diagenesis is apparent in the upper weathered interval of the Port Campbell Limestone (core 1, ). Where continuous hardbands exist in the sequence in Brumbys 1, they may form a roof to narrow stratiform cavities that are in the order of centimetres in height. Such cavities generally coincide with circulation loss during drilling, indicating lateral continuity of cavity and very high permeabilities as seen in SPCL23 and an upper interval in SPCL16.
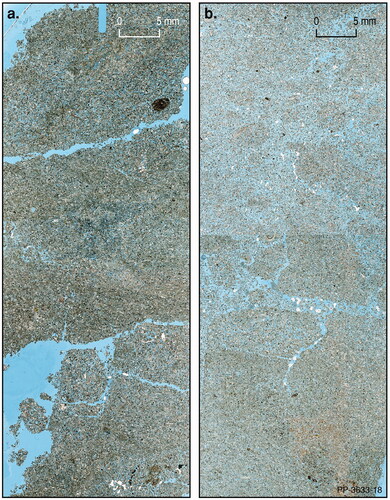
Figure 18. Comparison of Port Campbell Limestone bioclastic grainstone from Nullawarre 3. Blue resin indicates porosity. Nullawarre 3 core 1 (a) and core 2 (b) (). Both samples show porous bioturbation traces and spreite, but the carbonate of core 1 has much less cementation and higher porosity than the grainstone in core 2. Microstructures of the bioclastic grainstones in core 1 has high moldic porosity (c) and core 2 is indurated by calcite cements (d) in Nullawarre 3.
In the sequence of Brumbys 1, the remnant presence of aragonite is thought to indicate extremely low permeabilities, preventing mineralogical inversion or leaching through contact with groundwater.
Porosity and permeability
The semi-consolidated and unconsolidated sequence of the Port Campbell Limestone has high porosity (). Only in the rare thin hardbands is cementation so pervasive as to significantly reduce porosity and permeability.
A generalisation could be made from this data that the Port Campbell Limestone adjoining Brumbys Fault has an averaged effective porosity exceeding 25% in all lithostratigraphic units, with no apparent trend with depth. One anomalous zone reaches 58.5% in a shallow aquifer (SPCL23), which has permeabilities in the order of 2 darcy. Permeability for much of the remaining sequence ranges between 100 and 400 mD, with aquitard zones as low as 20 mD (SPCL20, SPCL21).
When permeability is modelled in 3 D with seismic control beyond Brumbys 1, lateral variations of permeability become apparent. There are near-surface stratiform zones of higher permeability related to deep weathering as indicated by low seismic velocities ().
Provenance interpretation
The geochemical signatures (; online data file) in the Port Campbell Limestone sequence are indicative of mixed provenance, particularly in the upper part of the Port Campbell Limestone. Despite local perturbations such as locally increased siliciclastic input (), there is a clear overall progressive change in certain elements up hole, e.g. increasing Th, LREE, Zr/TiO2, La/Nb, decreasing Sr, that together suggest a switch in provenance to more felsic compositions (). The range and variation in chemistry also increase up hole, indicating an increasingly complex or mixed provenance. For example, the increase in the Eu/Eu* ratio and concentration of Eu and the LREEs up hole suggests a change to more enriched basaltic rocks and/or their fractionates. Wide variations in La/Nb for given Zr/TiO2 ratios indicate the presence of a more typical continental provenance component, such as the outcropping Paleozoic sediments and granites in the hinterland to this region.
Various ratios (e.g. Zr/TiO2, La/Nb, Eu/Eu*) suggest that the overlying Hesse Clay has a very similar provenance signature to the upper Port Campbell Limestone (). Equally, despite a higher siliciclastic content, ratios such as La/Nb, Zr/TiO2 in the Gellibrand Marl suggest a similar provenance to the lower Port Campbell Limestone. Variations in Nb/Y () suggest the Gellibrand Marl may include both alkaline and non-alkaline volcanic components (e.g. Forbes et al., Citation2020; Winchester & Floyd, Citation1977). This alkaline component appears to be greatly diminished in the overlying lower Port Campbell Limestone.
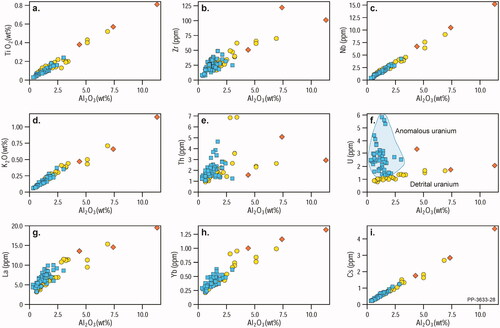
From the signatures of U, K and Th, it is clear that the gamma response within the Port Campbell Limestone is largely derived from K content, with increased U in weathered zones (). Except for Ca and Mg, and also U, major elements and most trace elements are enriched in zones that have a greater abundance of clay and silicate minerals. This is supported by the reasonable to good correlation between most elements and Al2O3 content ().
Figure 19. Plots of TiO2, K2O, La, Zr, Th, Yb, Nb, U and Cs versus Al2O3. Blue squares and yellow circles = Port Campbell Limestone (high- and low-U, respectively), and orange diamonds = Gellibrand Marl. Note the good positive correlation between Al2O3, which provides a measure of the detrital component in the rocks, and the majority of elements suggesting that the abundances of most elements are largely a function of the amount of detrital material in the Port Campbell Limestone (and Gellibrand Marl). One exception is U, which shows a range of behaviour versus Al2O3. Low-U samples (<2 ppm U, designated by the circles) show a good positive correlation with Al2O3, suggesting control by the detrital input. In contrast, the high U subgroup (highlighted) show a complete decoupling from Al2O3 and most other elements suggesting an additional control on U concentration.
Uranium
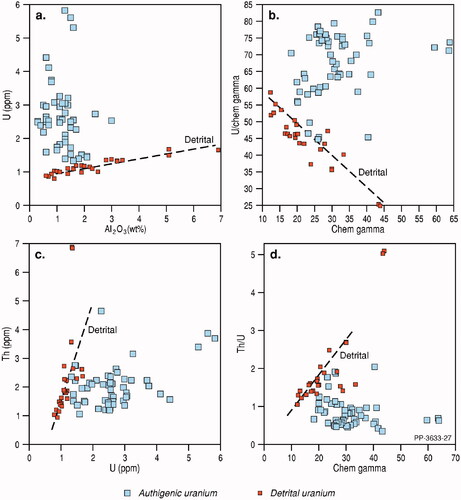
As noted above U content is not solely controlled by detrital contribution. This is best demonstrated by the variable behaviour vs indicators of detrital content, such as Al2O3. shows that a subset of Port Campbell Limestone rocks show a good positive correlation with Al2O3 suggestive of control by detrital phases. This is also supported by the good positive correlation between U and Th, and U and K2O, for these samples. The majority of these are characterised by low U (<1.5 ppm) and come from the lower 40 m of the Port Campbell Limestone (). The remainder of the samples show no correlation with Al2O3 and notably have elevated U contents (1.3–6 ppm) ( and ) suggesting a major source of U that is not detrital in origin. Importantly, it is also evident that this anomalous U contributes significantly to the median of the gamma-ray signature through the sequence (over 80% of the gamma-ray response is due to U in the most U-enriched samples). The origin of this anomalous U is uncertain. As noted earlier possible weathering affects may be responsible for changes in U content in the upper 15 m, and it is feasible that some redistribution of U has occurred elsewhere in the Port Campbell Limestone, e.g. elevated U below the subtle disconformity at 65 m (). There is no observable relationship between U contents and zones of enhanced permeability, i.e. dolomitic intervals. For example, highest U contents are in zones with very low dolomite contents. In contrast, zones with minimal diagenetic alteration and elevated aragonite (>5 wt%), interpreted to indicate low permeability, have low U contents (1–1.5 ppm), consistent with a primary detrital origin for the U in these zones.
Figure 20. U (ppm) versus Al2O3 (wt%) and Th (ppm). Note the two distinct trends, with detrital U (correlated with both Al2O3 and Th) versus U from a secondary source (decoupled from both Al2O3 and Th; see ).
Biostratigraphy
As observed in previous studies (Gallagher et al., Citation1999; Gallagher & Holdgate, Citation2000, Gallagher & Stanislaus, Citation2019), the Gellibrand Marl and Port Campbell Limestone of the Heytesbury Group yielded common to abundant foraminifera. We found microfauna offers an excellent control on age as well as depositional conditions and paleodepths. All foraminiferal data from Brumbys 1 used to interpret the age and environmental evolution of the sequence are provided as online data files.
Environment and age of the Gellibrand Marl in Brumbys 1
Foraminifera are abundant and preservation is poor to good. The percentage of planktics is variable, ranging from 18–70% reflecting an outer shelf environment (≥100 m paleodepth). Inner shelf taxa are absent, instead the benthic assemblage is dominated by middle to outer shelf taxa (and Discorbinella bertheloti, Cibicidoides perforatus and Cibicides spp.) and outer shelf species such as Cassidulinoides spp., Cassidulina spp. and Sphaeroidina bulloides. The marly (wackestone) facies in this unit reflects low energy below wave base deposition in outer shelf or even upper slope environments (Gallagher et al., Citation1999).
The top of the Gellibrand Marl (122.3–126.1 m; ) is above the Base Praeorbulina glomerosa sensu stricto and Base Orbulina suturalis/O. universa and therefore lies in the middle Miocene M6/N9/E1 zones (; <15.1 Ma). This is similar to other onshore Otway wells: Brucknell 2, Mepunga 25, Nirranda 6, Nullawarre 3 and Terang 1 (Gallagher & Stanislaus, Citation2019). The Top of Praeorbulina glomerosa sensu stricto is at 112.3 m suggesting a minimum age of 14.78 Ma. Other taxa present include typical Miocene species such as Globorotalia miozea, Top Globorotalia peripheroronda (>13.8 Ma), Globoquadryina dehiscens, Globigerinoides trilobus and Globoturborotalia woodi.
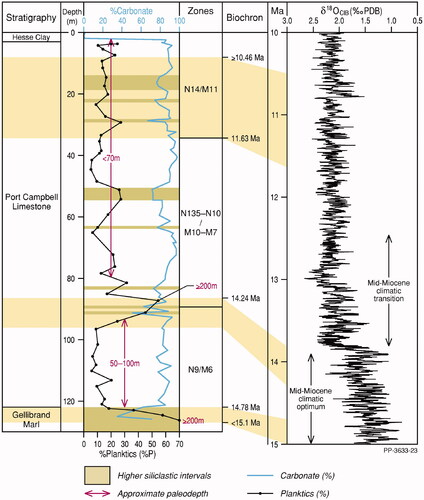
Figure 21. Percentage planktics in Brumbys 1 plotted with the %carbonate. Olive toned horizons are marls (wackestones) or marly limestones (wackestones/packstones) that alternate with limestones white) packstones/grainstones. Estimates of paleodepths are in red. Biochron., biochronology. The oxygen isotope curve is the ‘Megasplice’ of De Vleeschouwer et al. (Citation2017).
Environment and age of the Port Campbell Limestone in Brumbys 1
The Port Campbell Limestone microfauna is not as well preserved as those in the Gellibrand Marl with relatively lower %planktics (average ∼16% with a range of 6–55%). This is similar to previous data from cores of the Port Campbell Limestone in the Otway Basin (Gallagher & Stanislaus, Citation2019), but unlike Brumbys 1, none of the sections analysed by Gallagher and Stanislaus (Citation2019) were continuously cored. Microfaunal analysis reveals significantly more variability in preservation quality and %planktics than previous known from discontinuously sampled cored sections.
There are several intervals in Brumbys 1 with poorly preserved faunas (121–108.2 m, 87.3–65.15 m, 41.3–39.3 m and 14.1–11.3m), that alternate with horizons of good to excellent preservation. Maxima of %planktics (55 to >24%), suggestive of paleodepths of >100 m, decrease up section above ∼90 m alternating with planktic minima from 6% to 17% (≪100 m paleodepths; ). Planktic maxima, which correspond to several horizons with 80% or less carbonate (), are likely to be marly sediments, alternating with limestones (>80% carbonate, Port Campbell Limestone packstone to grainstones). The relatively planktic-rich lower-energy marly limestones were deposited below wavebase in middle to outer shelf environments, whereas many of the planktic-poor limestone intervals (especially above 70 m) were deposited above wavebase at inner to middle shelf paleodepths (Gallagher et al., Citation1999).
The interval from 121 to 96 m downhole lacks common inner to middle species () yet yields low %planktics. Instead, the outer shelf taxa, Cassidulinoides spp., Cassidulina spp. and Astrononion spp., dominate with abundant cibicidids (middle to outer shelf species). This suggests that despite the minor %planktics in this interval, which might indicate inner shelf depths using the formula of van der Zwaan et al. (Citation1990), the 20 m section of limestones immediately above the top of the Gellibrand Marl was likely deposited in middle to outer shelf environments. The %planktic-rich unit at 90 m also lacks middle and inner shelf taxa and is interpreted to represent outer shelf paleodepths. Above drillhole log level 90 m, shallower inner to middle shelf taxa such as Rosalina spp., Patellina spp., Discorbis spp., Elphidium spp. and Glabratellina spp. dominate carbonate-rich intervals with lower %planktics indicating paleodepths generally less than 70 m. This shallow-water facies is punctuated with occasional slightly deeper marly horizons that are richer in planktics.
The base of the unit overlying the Gellibrand Marl lies above the Praeorbulina glomerosa sensu stricto datum at 112.3 m suggesting a maximum age in this section of 14.78 Ma (; ). The next most significant datum is Globorotalia conica, which first appears at 94 m in the upper part of the middle Miocene M6/N9/E1 zone (Cifelli & Scott, Citation1986; Scott et al., Citation1990), this is followed up section by the base of Globorotalia mayeri at 87.3 m denoting the base of the middle Miocene M7 to M10/N10 to N13/D1 to D2 zones at 14.24 Ma (; ). The next key datums are at 33.2 m and 29.1 m where bases of Neogloboquadryina spp., Globoturborotalia nepenthes (11.63 Ma) and Globoturborotalia decoraperta (11.49 Ma) define the base of M11/N14/B2-C zones, respectively. Globorotalia miotumida (conoidea) also appears at this level. This species first appears near the base of N14 (Cifelli & Scott, Citation1986) supported by the top Globorotalia conica, which is also within the N14 Zone. The last appearance of Globorotalia mayeri at log level 5.2 m suggests that the youngest strata in the Port Campbell Limestone are still within the M11/N14/B2-C zone with a minimum age of 10.46 Ma (; ). The absence of late Miocene planktic indicators such as Globorotalia pleisiotumida, Globorotalia miotumida (conomiozea) and the presence of many middle Miocene taxa strongly suggests that the Port Campbell Limestone is no older than the middle Miocene in most sections in the Otway Basin (Gallagher & Stanislaus, Citation2019).
Cyclostratigraphy
The four significant biostratigraphic datums determined from the above biostratigraphy allow for a first-order depth-to-time conversion in Brumbys 1 (). This conversion is made by means of linear interpolation between the biostratigraphic tie points. The resulting gamma-log time series is then subjected to multitaper method (MTM) spectral analysis, which yields a statistically significant spectral peak at the expected frequency of short ca 100-kyr eccentricity (purple band in ). Two even stronger spectral peaks occur at frequencies around ∼20 cycles/Myr (51 kyr periodicity), which cannot be readily associated with an astronomical parameter. The latter three periods, with wavelengths between 51 and 100 kyr in the time domain, chiefly correspond to the third-order m-scale (1.14–1.7 m) shoaling-upward cycles in the depth-domain (see Stratigraphy).
Figure 22. Cyclostratigraphic analysis of Brumbys 1 gamma-ray series. (a) Gamma log in the depth-domain and along a simple biostratigraphic age model. (b) Multitaper method (MTM) power spectrum of the gamma-ray signal, along its biostratigraphic age–depth model. (c) Bandpass-filtered signal (75–130 kyr bandwidth) extracting gamma-ray signal components that could be related to ca 100 kyr short eccentricity. (d) The bandpass filter after tuning to the La2004 eccentricity target curve (Laskar et al., Citation2004). (e) Cyclostratigraphically refined gamma-ray time series compared with the benthic δ18O megasplice of De Vleeschouwer et al. (Citation2017). (f) MTM power spectrum of the gamma-ray signal, along its cyclostratigraphic age–depth model. (g) Evolution of sedimentation rates in the cyclostratigraphic age–depth model throughout the studied interval.
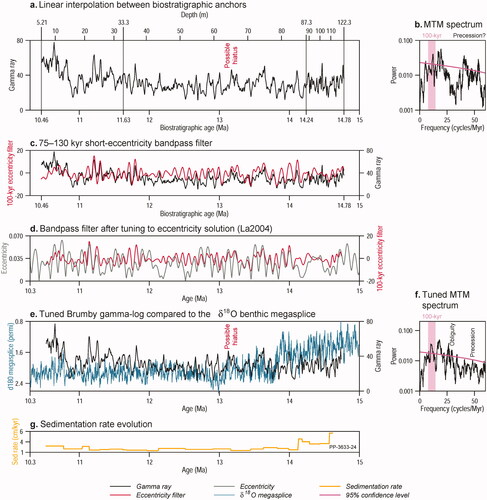
At higher frequencies, a statistically significant (>95% confidence level) spectral peak occurs within the expected frequency range of precession (21 kyr periodicity). However, given the smoothed character and temporal resolution of the gamma-ray dataset, we cannot interpret these with any confidence.
In a next step, the 100-kyr variability in the gamma-ray log is isolated through bandpass filtering, extracting 75–130 kyr periodicities that are embedded in the signal (red curve in ). This filtered signal forms the basis of our astrochronological tuning. Indeed, tuning of Brumbys 1 starts from the assumption that this filtered signal represents the imprint of Earth’s orbital eccentricity. A second tuning assumption pertains to the phase relationship between the gamma signal and eccentricity. Here, we assume that warmer intervals, generally corresponding to high-eccentricity configurations (De Vleeschouwer et al., Citation2017), are characterised by a wetter southern Australian climate, an increased detrital sediment flux and hence a higher gamma-ray signal. On the basis of these assumptions, we establish a correlation between the gamma-ray 100-kyr filter and the La2004 eccentricity solution (Laskar et al., Citation2004; ) while also striving for a good match between the Brumbys 1 gamma-ray signal (black) and the δ18O benthic megasplice (De Vleeschouwer et al., Citation2017; ). This astronomical tuning step refines the biostratigraphic age model by shifting, squeezing and stretching the biostratigraphic gamma-ray time series. The greatest disparity between the purely biostratigraphic age–depth model and the cyclostratigraphic age model amounts to 115 kyr and occurs around 14.0 Ma.
In tuning and correlation of cyclicity in the gamma signal of the Port Campbell Limestone in Brumbys 1 with the δ18O benthic megasplice, the median of an averaged curve of the high-resolution gamma trace of the Port Campbell Limestone sequence shows significant departures in the upper sequence from a trace anticipated to generally follow the δ18O trace (). These zones of increased median of the gamma signal in the Port Campbell Limestone correspond to an increased U content in SPCL24–SPCL22 and SPCL12–SPCL10 (). Slight enrichment in U in these units is attributed to authigenic adsorption through groundwater processes during emergence and resultant weathering, a phenomenon not seen in deep ocean sequences on which the megasplice has been established.
The power spectrum of the tuned gamma-ray time series is juxtaposed to the power spectrum of the δ18O megasplice in . By comparing the cyclostratigraphic spectrum to the purely biostratigraphic spectrum (), it becomes clear that the tuning approach shifted power from the 51-kyr band towards the ca 100-kyr band associated with short eccentricity and the ca 41-kyr band associated with obliquity. The power in the precession band completely collapsed, reinforcing our evaluation that precession is not a significant component of the analysed gamma signal.
On the basis of interpolated thickness of third-order cycles against time, a sedimentation rate can be calculated throughout the Port Campbell Limestone (). However, these rates are determined on the assumption that the cored sequence has had no subsequent post-depositional alteration.
Discussion
Dissolution and proximity to fault
The sequence in Brumbys 1 is largely unconsolidated carbonate with gradations through lumpy unconsolidated carbonate to relatively few hardbands. The commonly rough to rugose surface of indurated lumps, and the difference between grainstone textures within lumps and packstone texture in surrounding unconsolidated matrix, is best explained through carbonate dissolution processes. These are inferred to extend laterally in the near-surface weathering that has been influenced by jointing (), as well as further down sequence in closer proximity to the Brumbys Fault. Anomalous lower seismic velocities near surface and near fault were defined in the geological model of Feitz, Radke, et al. (Citation2018). This would suggest that the fault and comparative fractures have been influential in locally channelling groundwater along structures, enhancing dissolution as well as dolomitisation. Our observations are consistent with previous suggestions that fractures and joints within the Port Campbell Limestone may have been widened by carbonate dissolution and form a secondary porosity to complement the primary intergranular porosity (Bush, Citation2009).
Cyclicity
Long-period cyclicity is not readily evident in the Port Campbell Limestone in Brumbys 1, in contrast to adjoining wells and coastline outcrop (). However, shorter-period cyclicity, driven by orbital forcing, especially eccentricity and to a lesser degree obliquity, has been demonstrated in modelling using the gamma log () on the basis of the repeated changes in detrital content in each such cycle. Sedimentation rates () are indicated to decrease up sequence and corroborate with the diminishment in thickness of delineated third-order units () from the lowermost to uppermost part of the Port Campbell Limestone. The possible condensation of the upper sequence by dissolution processes could also be a contributing factor. Anomalous lower seismic velocities in the shallow sequence (Feitz, Radke, et al., Citation2018; ) suggest an irregular interval of lower density and/or reduced induration ( and ). Accordingly, the degree of influence of late dissolution effects vs changing sedimentation rates remains unresolved.
Disconformities and weathering
Two horizons of emergence and weathering are evident within the Port Campbell Limestone.
The disconformity below the Hesse Clay has a distinctive 3 m upper zone of oxidised limonitic stained unconsolidated carbonate sand above light-coloured green-grey semi-consolidated carbonate down to 17 m, below which the sequence is predominantly dark green-grey. Uranium increases upwards in this weathered zone from 2 ppm in SPCL22–6 ppm in SPCL24 before sudden diminishment to 1 ppm in SPCL25, the highly oxidised upper zone where leaching by oxidised groundwater appears to have occurred. This disconformity is attributed to the regional development of the Timboon Surface post uplift and emergence of this sequence in the Port Campbell Embayment.
A subtle disconformity is indicated at the top of SPCL12 at 65.5 m depth. Rough corrugate dissolution surfaces are evident on thin indurated carbonate bands with vuggy macroporosity exceeding 40%. The uppermost 3 m of sequence below this disconformity is light green-grey and darkens gradually downwards for ∼15 m back to dark green-grey. This lighter coloured zone contrasts with the dark green-grey of the overlying SPCL13. This weathering zone, although subtle in colour change, has an enhanced U content of ∼3 ppm, in contrast to 1 ppm below this zone (). Foraminiferal paleodepth estimations () are the lowest above and below this horizon. Above the disconformity, with inferred increasing water depth, mud and quartz input increases, pyrite spikes, and there are sudden shifts in Fe/Al, Fe/P and V/Cr and Cr/Nb (). Importantly, there are increasing trends in both Cr and V in the 7 m of sediment below the disconformity (such elevated V and Cr also occur in the weathering zone in the top 10 m). This disconformity corresponds to the most pronounced lowstand of sea-level during the Mid Miocene Transition at ca 13.2 Ma ( and ) where δ18O CIB VPDB is highest, inferring the greatest volume of global ice sheets and corresponding lowest sea-level.
Mineralogy and geochemistry
Application of paleoredox proxies, such as U/Th, V/Cr, Fe/Al (e.g. Algeo & Liu, Citation2020; Jones & Manning, Citation1994; Tribovillard et al., Citation2006), suggests that the depositional environment for the Port Campbell Limestone ranged from oxic–suboxic (e.g. U/Th <1, V/Cr <5, Fe/Al <0.5–0.6) to euxinic/anoxic. These indicators are not always consistent (with respect to each other) and are, at least partly, responding to other factors. For example, many of these paleoredox elements are positively correlated with Al2O3, suggesting control by detrital material and not redox. Moreover, many of these proxies have been developed and applied to mudstones and shales, rather than carbonate dominated sequences (Jones & Manning, Citation1994). Of these, the V/Cr and Fe/Al appear to have the best correspondence in this study, and Fe/P closely resembles the Fe/Al signature. An increase in Fe content towards the top of the Port Campbell Limestone is a result of weathering at the top of the formation, which was also observed in core as an orange-coloured zone in an otherwise almost uniformly grey limestone. Further investigation is required to determine which proxies are most useful to determine depositional and post-depositional conditions for the Port Campbell Limestone. For U, both detrital and authigenic sources have been effectively differentiated ().
Evolution of Miocene paleoenvironments and paleoclimate
Preliminary microfossil analysis using planktic foraminiferal biostratigraphic data reveals that the Gellibrand Marl and Port Campbell Limestone in Brumbys 1 were deposited from 15 to 10.5 Ma () during a major global climate transition from the warm Mid-Miocene Climate Optimum (MMCO) to the cooler Mid-Miocene Climatic Transition (MMCT) (De Vleeschouwer et al., Citation2017; Foster et al., Citation2012). Because of the northward migration of the Australian continent over time, accumulation of the Port Campbell Limestone during the Miocene was at higher latitudes, in the range 50 to ∼48°S (Veevers, Citation2001, figure 44). Foraminiferal assemblage data indicates relatively deep paleodepths (>200 m) below log level 80 m in Brumbys 1 from ca 15 to 14 Ma (the Gellibrand Marl) correlating to a period of globally depleted δ18O values (De Vleeschouwer et al., Citation2017; Holbourn et al., Citation2013, Citation2014). Paleodepths shallow by around 100 m in the overlying basal Port Campbell Limestone and fluctuate up to ∼200 m at around 14.24 Ma associated with relatively high sedimentation rates () during the MMCO. The MMCT () is marked by a shift to shallower paleodepths (<70 m) and lower sedimentation rates after 14 Ma, corresponding to a time of enriched δ18O values due to Antarctic Icesheet expansion and lower sea-levels. Future investigation with higher resolution microfossil assemblage analysis and benthic stable O/C isotope analyses of the Cibicidoides spp. (a relatively common taxon in the succession) in Brumbys 1 would enhance our preliminary correlation between this regional neritic archive and the global isotope datasets () and improve our understanding of the glacioeustatic consequences of Miocene cryosphere expansion.
Miocene cyclostratigraphy and astronomical climate forcing
The gamma-ray signal contains a mixed signal of obliquity and eccentricity and is thus generally congruent with the astronomical imprint observed in contemporaneous deep-sea benthic δ18O records (Holbourn et al., Citation2013, Citation2014). However, contrary to the δ18O records, the Brumbys 1 gamma signal does not show a major shift in absolute values or astronomical signature around 13.8 Ma, i.e. a period of extensive ice growth on Antarctica. The rate of sedimentation, however, did decrease significantly around 14.1 Ma. This could be related to the 6–7 °C cooling of sea surface temperatures around Antarctica (14.2–13.8 Ma) in the run-up to the major glaciation (Shevenell et al., Citation2004). However, further research is required to disentangle the precise cause-and-effect chains between both evolutions.
Conclusions
The Port Campbell Limestone at the CO2CRC site is a stack of thin repetitive depositional cycles within cycles. The third-order cycles of shoaling-upward character resulted predominantly from orbital forcings by obliquity and eccentricity. The carbonates are grey unconsolidated to semi-consolidated and rarely lithified bioclastic muddy carbonate sands. Most bioclasts are of indeterminate origin due to comminution and micritisation. The Port Campbell Limestone is predominantly calcite with traces of remnant aragonite in muddier low-permeability sands, and dolomitic zones in permeable intervals. The small non-carbonate component, between 3% and 15% in the sequence, comprises quartz silt with minor clay, feldspar and mica. An intraformational glauconitic mudstone with a distinctive mollusc–echinoderm–bryozoan fauna provides one distinctive marker interval in the sequence.
Dissolution overprints are prominent throughout the carbonate sequence, as moldic porosity that can exceed 60% in remnant indurated bands, and the degradation of such bands to irregular cemented lumps within an unconsolidated muddier matrix. The overall high porosity and permeability of the sequence may be attributed to proximity to the Brumbys Fault. Additional increased dissolution and disaggregation up sequence towards the top of the formation is evidenced by anomalous upward-diminishing seismic velocities and are attributed to weathering during development of the Timboon Surface. Despite weathering and small fault displacements, the shallow sequence remains correlatable across a distance of at least 300 m.
Provenance signatures of the non-carbonate component of the sediment indicate a predominant volcanogenic contribution in the upper Gellibrand Marl and lower Port Campbell Limestone. This transitions to a more complex provenance mix in the upper half of the Port Campbell Limestone. There is a clear temporal trend to a more felsic provenance component in the upper part of the sequence, accompanied by much greater geochemical variability that requires consideration of multiple provenances. This may reflect a switch to a more evolved volcanogenic component as well as contributions from older continental material.
Foraminiferal data show that the upper part of the Gellibrand Marl and Port Campbell Limestone were deposited from 15 to 10.5 Ma. Accumulation of the Port Campbell Limestone was at higher latitudes in the range 50 to ∼48°S. There was a depositional transition from outer shelf conditions (∼200 m water depth) in the Gellibrand Marl at around 15 Ma to middle shelf (50–100 m water depth) environments in the lower part of the Port Campbell Limestone during the MMCO at ca 14.24 Ma. Shallowing after 14 Ma indicates variable yet shallower paleodepths (<70 m) during and following the end of the MMCT ca 13.2 Ma when the sequence was emergent for an undetermined brief period at the nadir of global sea-level. Following accumulation of the uppermost Gellibrand Marl at ∼8 cm/kyr, depositional rates decreased to 4–6 cm/kyr up to ca 14.24 Ma and remained low at between 1.5 and 3 cm/kyr throughout the subsequent deposition of the Port Campbell Limestone.
Any future higher-resolution microfossil assemblage analysis in conjunction with stable isotope analyses would contribute to an improved cyclostratigraphic analysis on this sequence in Brumbys 1. This should substantiate correlation to global curves based on deep ocean datasets, and possibly elucidate climatic and eustatic consequences of Miocene cryosphere evolution.
Supplemental Material
Download PDF (203.3 KB)Acknowledgements
Groundwave of Geelong conducted the sonic drilling. Wireline logging was by George Haskil of Q Tech. Supervision of drilling was by KS Chan (CO2CRC), Riccardo Esposito (UPS) and Peter Dumesny (UPS). Ross Spulak and Georgy Falster (GA) provided on site preparation, handling and shipping of core. The authors gratefully acknowledge laboratory sampling for paleontology by Christian Thun, Andrew Kelman and Kamal Khider. XRD Analysis was by Simon Weber and Tara Webster. Sample preparation for paleontology, particle size analysis, geochemistry with ICPMS and XRF was undertaken by the Geoscience Australia Sample Preparation and Physical Geology Laboratory and Inorganic Geochemistry teams. Petrographic thin-sections were made by Jim Duggan. Many thanks to Chris Evenden (GA) for drafting of figures and Shahadat Hossain (GA) for preparing the 3D image of the site (). Tim Evans (GA) is thanked for his review of an earlier version of this manuscript. We also thank the two anonymous reviewers for their useful and insightful comments. AF, AK, LW, DC and ET publish this paper with the permission of the Chief Executive Officer, Geoscience Australia.
Disclosure statement
No potential conflict of interest was reported by the author(s).
Data availability statement
The data that support the findings of this study are openly available at Geoscience Australia at https://dx.doi.org/10.26186/146045
Additional information
Funding
References
- Algeo, T. J., & Liu, J. (2020). A re-assessment pf elemental proxies for paleoredox analysis. Chemical Geology, 540, 119549. https://doi.org/https://doi.org/10.1016/j.chemgeo.2020.119549
- Aliouane, L., Ouadfeul, S.-A., Djarfour, N., & Boudella, A. (2013). Lithofacies prediction from well logs data using different neural network models. In Proceedings of the 2nd International Conference on Pattern Recognition Applications and Methods (PRG-2013) (pp. 702–706). INSTICC/AAAI.
- Bailey, A. H. E., Pevzner, R., Urosevic, M., Popik, D., & Feitz, A. J. (2017). Shallow geology of the CO2CRC Otway Site: Evidence for previously undetected neotectonic features? Energy Procedia., 114, 4424–4435. https://doi.org/https://doi.org/10.1016/j.egypro.2017.03.1600
- Berggren, W. A., Kent, D. V., Swisher III, C. C., & Aubry, M.-P. (1995). A revised Cenozoic geochronology and chronostratigraphy. In W. A. Berggren, D. V. Kent, M. –P. Aubry & J. Hardenbol (Eds.), Geochronology, time scales, and global stratigraphic correlation: A unified temporal framework for a historical geology (pp. 129–212). Society of Economic Paleontologists and Mineralogists.
- Blow, W. H. (1969). Late middle Eocene to Recent planktonic foraminiferal biostratigraphy. In P. Bronnimann & H. H. Renz (Eds.), Proceedings of the 1st International Conference on Planktonic Microfossils, Geneva, 1967 (pp. 199–422). E. J. Brill.
- Bolli, H. M., Saunders, J. B., & Perch-Nielsen, K. (1985). Plankton stratigraphy. Cambridge University Press.
- Bush, A. L. (2009). Physical and chemical hydrogeology of the Otway Basin, southeast Australia [Unpublished PhD thesis]. School of Earth Sciences, University of Melbourne. 350 p.
- Cifelli, R., & Scott, G. (1986). Stratigraphic record of the Neogene globorotalid radiation (Planktonic Foraminiferida). Smithsonian Museum. https://doi.org/https://doi.org/10.5479/si.00810266.58.1
- Cleveland, W. S. (1979). Robust locally weighted regression and smoothing scatterplots. Journal of the American Statistical Association, 74(368), 829–836. https://doi.org/https://doi.org/10.1080/01621459.1979.10481038
- De Vleeschouwer, D., Vahlenkamp, M., Crucifix, M., & Pälike, H. (2017). Alternating Southern and Northern Hemisphere climate response to astronomical forcing during the past 35 m.y. Geology, 45(4), 375–378. https://doi.org/https://doi.org/10.1130/G38663.1
- Department of Mines, Victoria (1965). Widco Well Log of Nullawarre 3, Nullawarre North, County of Heytesbury, Victoria. Spontaneous Potential and Resistivity logs from Widco logger No. 306.
- Department of Sustainability and Environment (2011). Review of land stability at Sturgess Point, Port Campbell. Department of Sustainability and Environment. Report # 514/01/11.
- Edwards, J., Leonard, J. G., Pettifer, G. R., & McDonald, P. A. (1996). Colac. Geological Survey of Victoria Report 98.
- Edwards, J., Tickell, S. J., Willcocks, A. J., Eaton, A. R., Cramer, M. L., King, R. L., & Bourton, S. M. (1996). Colac 1:250 000 geological map. Geological Survey of Victoria.
- Feitz, A. J., Pevzner, R., Harris, B., Schaa, R., Tertyshnikov, K., Ziramov, S., Gunning, M., Ransley, T. R., Lai, E., Bailey, A. H., Schacht, U., Fomin, T., & Urosevic, M. (2017). The CO2CRC Otway shallow CO2 controlled release experiment: Site suitability assessment. Energy Procedia, 114, 3671–3678. https://doi.org/https://doi.org/10.1016/j.egypro.2018.11.024
- Feitz, A., Radke, B., Hossain, S., Harris, B., Schaa, R., Pethick, A., Ziramov, S., Urosevic, M., Tenthorey, E., Pan, Z., Ennis-King, J., Wang, L., Gunning, M. E., Lai, E., Ransley, T., Tan, K. P., & Schacht, U. (2018). The CO2CRC Otway shallow CO2 controlled release experiment: Geological model and CO2 migration simulations. 14th International Conference on Greenhouse Gas Control Technologies, GHGT-14, 21–25 October 2018. Fully virtual conference, hosted by Khalifa University, Abu Dhabi. https://doi.org/https://dx.doi.org/10.2139/ssrn.3365843
- Feitz, A., Radke, B., Ricard, L., Chan, K., Glubokovskikh, S., Tenthorey, E., Pevzner, R., Tertyshnikov, K., Urosevic, M., Lebedev, M., Ennis-King, J., Schacht, U., Vialle, S., Harris, B., Wang, L., Coene, E., Green, C., Kalinowski, A., Sidenko, E., … Credoz, A. (2021). The CO2CRC otway shallow CO2 controlled release experiment: Fault characterization and leakage scenarios. In Proceedings of the 15th Greenhouse Gas Control Technologies Conference 15–18 March 2021. https://doi.org/https://doi.org/10.2139/ssrn.3817287.
- Feitz, A., Ricard, L., Radke, B., Chan, K., Glubokovskikh, S., Tenthorey, E., Pevzner, R., Tertyshnikov, K., Urosevic, M., Lebedev, M., Ennis-King, J., Schacht, U., Vialle, S., Harris, B., Wang, L., Coene, E., Green, C., Kalinowski, A., Sidenko, E., … Credoz, A. (2020). SRD3.3 Science Case for Phase 3. CO2CRC Publication Number RPT20-6218. CO2CRC Ltd.
- Feitz, A., Tertyshnikov, K., Pevzner, R., Ricard, L., Harris, B., Schaa, R., Schacht, U., Kalinowski, A., Vialle, S., Glubokovskikh, S., Lebedev, M., Tenthorey, E., Pan, Z., Ennis-King, J., Wang, L., Hossein, S., & Ransley, T. (2018). The CO2CRC Otway shallow CO2 controlled release experiment: Preparation for Phase 2. Energy Procedia., 154, 80–85. https://doi.org/https://doi.org/10.1016/j.egypro.2018.11.024
- Forbes, A., Munday, S., & Revie, D. (2020). An elemental chemostratigraphic study, Onshore Otway Basin, Victoria. Victorian Gas Program Technical Report 12. Geological Survey of Victoria, 346 pp.
- Foster, G. L., Lear, C. H., & Rae, J. W. (2012). The evolution of pCO2, ice volume and climate during the middle Miocene. Earth and Planetary Science Letters, 341-344, 243–254. https://doi.org/https://doi.org/10.1016/j.epsl.2012.06.007
- Gallagher, S. J., & Gourley, T. L. (2007). Revised Oligo-Miocene stratigraphy of the Murray Basin, southeast Australia. Australian Journal of Earth Sciences, 54(6), 837–849. https://doi.org/https://doi.org/10.1080/08120090701392705
- Gallagher, S. J., & Holdgate, G. (2000). The palaeogeographic and palaeoenvironmental evolution of a Palaeogene mixed carbonate-siliciclastic cool-water succession in the Otway Basin. Southeast Australia. Palaeogeography, Palaeoclimatology, Palaeoecology, 156(1–2), 19–50. https://doi.org/https://doi.org/10.1016/S0031-0182(99)00130-3
- Gallagher, S. J., & Stanislaus, F. (2019). New micropalaeontological results from legacy core, Onshore Otway Basin, Victoria. Geological Survey of Victoria. Department of Jobs, Precincts and Regions.
- Gallagher, S. J., Jonasson, K., & Holdgate, G. (1999). Foraminiferal biofacies and palaeoenvironmental evolution of an Oligo-Miocene cool-water carbonate succession in the Otway Basin, Southeast Australia. Journal of Micropalaeontology, 18(2), 143–168. https://doi.org/https://doi.org/10.1144/jm.18.2.143
- Gallagher, S. J., Smith, A. J., Jonasson, K., Wallace, M. W., Holdgate, G. R., Daniels, J., & Taylor, D. (2001). The Miocene palaeoenvironmental and palaeoceanographic evolution of the Gippsland Basin, Southeast Australia; a record of Southern Ocean change. Palaeogeography, Palaeoclimatology, Palaeoecology, 172(1–2), 53–80. https://doi.org/https://doi.org/10.1016/S0031-0182(01)00271-1
- Gallagher, S. J., Villa, G., Drysdale, R. N., Wade, B. S., Scher, H., Li, Q., Wallace, M. W., & Holdgate, G. R. (2013). A near‐field sea level record of East Antarctic Ice Sheet instability from 32 to 27 Myr. Paleoceanography and Paleoceanography, 28(1), 1–13. https://doi.org/https://doi.org/10.1029/2012PA002326
- Gill, E. D. (1965). Soils and terrains of the basaltic plains of far western Victoria. Proceedings of the Royal Society of Victoria, 77, 387–395.
- Gourley, T. L., & Gallagher, S. J. (2004). Foraminiferal biofacies of the Miocene warm to cool climatic transition in the Port Phillip Basin, southeastern Australia. The Journal of Foraminiferal Research, 34(4), 294–307. https://doi.org/https://doi.org/10.2113/34.4.294
- Gradstein, F. M., Ogg, J. G., Schmitz, M. D., & Ogg, G. M. (2020). The geologic time scale 2020 (2-Volume Set, 1st Ed.). Elsevier.
- Holbourn, A., Kuhnt, W., Clemens, S., Prell, W., & Andersen, N. (2013). Middle to late Miocene stepwise climate cooling: Evidence from a high‐resolution deep water isotope curve spanning 8 million years. Paleoceangraphy and Paleoclimatoloy, 28(4), 688–699. https://doi.org/https://doi.org/10.1002/2013PA002538
- Holbourn, A., Kuhnt, W., Lyle, M., Schneider, L., Romero, O., & Andersen, N. (2014). Middle Miocene climate cooling linked to intensification of eastern equatorial Pacific upwelling. Geology, 42(1), 19–22. https://doi.org/https://doi.org/10.1130/G34890.1
- Holdgate, G., & Gallagher, S. J. (2003). Tertiary a period of transition to marine basin environments. In W. D. Birch (Ed.), Geology of Victoria (pp. 289–335). Geological Society of Australia (Victoria Division).
- Jenkins, C. R., Cook, P. J., Ennis-King, J., Undershultz, J., Boreham, C., Dance, T., de Caritat, P., Etheridge, D. M., Freifeld, B. M., Hortle, A., Kirste, D., Paterson, L., Pevzner, R., Schacht, U., Sharma, S., Stalker, L., Urosevic, M. (2012). Safe storage and effective monitoring of CO2 in depleted gas fields. Proceedings of the National Academy of Sciences, 109, 353–354.
- Jones, B., & Manning, D. A. C. (1994). Comparison between geochemical indices used for the interpretation of palaeoredox conditions in ancient mudstones. Chemical Geology, 111(1–4), 111–129. https://doi.org/https://doi.org/10.1016/0009-2541(94)90085-X
- Joyce, B. (1975). Quaternary volcanism and tectonics in southeastern Australia. In R. P. Suggate & M. M. Cresswell (Eds.), Quaternary studies (pp. 169–178). The Royal Society.
- Laing, A. C. M., Dee, C. N., & Best, P. W. (1989). The Otway Basin. The Australian Petroleum Exploration Association Journal, 29, 417–439.
- Laskar, J., Robutel, P., Joutel, F., Gastineau, M., Correia, A., & Levrard, B. (2004). A long-term numerical solution for the insolation quantities of the Earth. Astronomy & Astrophysics, 428(1), 261–285. https://doi.org/https://doi.org/10.1051/0004-6361:20041335
- Lesti, C., Giordano, G., Salvini, F., & Cas, R. (2008). Volcano tectonic setting of the intraplate, Pliocene–Holocene, Newer Volcanic Province (southeast Australia): Role of crustal fracture zones. Journal of Geophysical Research, 113(B7), B07407. https://doi.org/https://doi.org/10.1029/2007JB005110
- Li, Q., & McGowran, B. (1994). Miocene upwelling events; neritic foraminiferal evidence from southern Australia. Australian Journal of Earth Sciences, 41(6), 593–603. https://doi.org/https://doi.org/10.1080/08120099408728169
- McLoughlin, S. (2001). The breakup history of Gondwana and its impact on pre-Cenozoic floristic provincialism. Australian Journal of Botany, 49(3), 271–300. https://doi.org/https://doi.org/10.1071/BT00023
- Meyers, S. R. (2012). Seeing red in cyclic stratigraphy: Spectral noise estimation for astrochronology. Paleoceanography and Paleoceanography, 27(3), n/a–n/a. https://doi.org/https://doi.org/10.1029/2012PA002307
- Meyers, S. R. (2014). Astrochron: An R package for astrochronology. https://CRAN.R-project.org/package=astrochron [accessed on November 9th, 2021]
- Nicolaides, S. (1995). Cementation in Oligo-Miocene non-tropical shelf limestones, Otway Basin, Australia. Sedimentary Geology, 95(1–2), 97–121. https://doi.org/https://doi.org/10.1016/0037-0738(94)00102-Z
- Pevzner, R., Urosevic, M., Popik, D., Shulakova, V., Tertyshnikov, K., Caspari, E., Correa, J., Dance, T., Kepic, A., Glubokovskikh, S., Ziramov, S., Gurevich, B., Singh, R., Raab, M., Watson, M., Daley, T., Robertson, M., & Freifeld, B. (2017). 4D surface seismic tracks small supercritical CO2 injection into the subsurface: CO2CRC Otway Project. International Journal of Greenhouse Gas Control, 63, 150–157. https://doi.org/https://doi.org/10.1016/j.ijggc.2017.05.008
- Radke, B., Kalinowski, A., Wang, L., Tenthorey, E., & Feitz, A. (2020). Port Campbell Limestone and adjoining formations in Brumbys 1, CO2CRC Otway Research Facility, Port Campbell Embayment, Otway Basin, Victoria. CO2CRC Report RPT20-6169, 88 p. CO2CRC Limited.
- Ruckstuhl, A. F., Jacobson, M. P., Field, R. W., & Dodd, J. A. (2001). Baseline subtraction using robust local regression estimation. Journal of Quantitative Spectroscopy and Radiative Transfer, 68(2), 179–193. https://doi.org/https://doi.org/10.1016/S0022-4073(00)00021-2
- Scott, G. H., Bishop, S., & Burt, B. J. (1990). Guide to some neogene globorotalids (foraminiferida) from New Zealand. New Zealand Geological Survey Paleontological Bulletin 61.
- Shevenell, A. E., Kennett, J. P., & Lea, D. W. (2004). Middle miocene southern ocean cooling and antarctic cryosphere expansion. Science (New York, N.Y.), 305(5691), 1766–1770. https://doi.org/https://doi.org/10.1126/science.1100061
- Sinnesael, M., De Vleeschouwer, D., Zeeden, C., Batenburg, S. J., Da Silva, A. C., De Winter, N. J., Dinarès-Turell, J., Drury, A. J., Gambacorta, G., Hilgen, F. J., Hinnov, L. A., Hudson, A. J. L., Kemp, D. B., Lantink, M. L., Laurin, J., Li, M., Liebrand, D., Ma, C., Meyers, S. R., … Claeys, P. (2019). The Cyclostratigraphy Intercomparison Project (CIP): Consistency, merits and pitfalls. Earth-Science Reviews, 199, 102965. https://doi.org/https://doi.org/10.1016/j.earscirev.2019.102965
- Smith, A. J., & Gallagher, S. J. (2003). The Recent foraminifera and facies of the Bass Canyon: A temperate submarine canyon in Gippsland, Australia. Journal of Micropalaeontology, 22(1), 63–83. https://doi.org/https://doi.org/10.1144/jm.22.1.63
- Smith, A. J., Gallagher, S., Wallace, M., Holdgate, G., Daniels, J., & Keene, J. (2001). The Recent temperate foraminiferal biofacies of the Gippsland Shelf: An analogue for Neogene environmental analyses in southeastern Australia. Journal of Micropalaeontology, 20(2), 127–142. https://doi.org/https://doi.org/10.1144/jm.20.2.127
- Taylor, D. J. (1971a). Foraminifera and the Cretaceous and Tertiary depositional history in the Otway Basin in Victoria. In H. Wopner & J. G. Douglas (Eds.), The Otway Basin of southeast Australia (pp. 217–233). Geological Surveys of South Australia and Victoria.
- Taylor, D. J. (1971b). Foraminiferal biostratigraphy of a marginal area of the Otway Basin in Victoria. In H. Wopner & J. G. Douglas (Eds.), The Otway Basin of southeast Australia (pp. 235–239). Geological Surveys of South Australia and Victoria.
- Thomson, D. J. (1982). Spectrum Estimation and Harmonic-Analysis. Proceedings of the IEEE, 70(9), 1055–1096. https://doi.org/https://doi.org/10.1109/PROC.1982.12433
- Tickell, S. J., Edwards, J., & Abele, C. (1992). Port Campbell Embayment 1:100 000 map geological report. Geological Survey of Victoria Report, 95 (p. 97). Victoria Department of Energy and Minerals.
- Tribovillard, N., Algeo, T. J., Lyons, T., & Riboulleau, A. (2006). Trace metals as paleoredox and paleoproductivity proxies: An update. Chemical Geology, 232(1–2), 12–32. https://doi.org/https://doi.org/10.1016/j.chemgeo.2006.02.012
- van der Zwaan, G. J., Duijnstee, I. A. P., den Dulk, M., Ernst, S. R., Jannink, N. T., & Kouwenhoven, T. J. (1999). Benthic foraminifers: Proxies or problems? A review of paleoecological concepts. Earth-Science Reviews, 46(1–4), 213–236. https://doi.org/https://doi.org/10.1016/S0012-8252(99)00011-2
- van der Zwaan, G. J., Jorissen, F. J., & Stigter, H. C. (1990). The depth dependency of planktonic/benthic foraminiferal ratios: Constraints and applications. Marine Geology, 95(1), 1–16. https://doi.org/https://doi.org/10.1016/0025-3227(90)90016-D
- Veevers, J. J. (2001). Atlas of Billion-year earth history of Australia and neighbours in Gondwanaland. GEMOC Press.
- Wade, B. S., Olsson, R. K., Pearson, P. N., Huber, B. T., & Berggren, W. A. (2018). Atlas of Oligocene planktonic foraminifera. Cushman Foundation for Foraminiferal Research.
- Wade, B. S., Pearson, P. N., Berggren, W. A., & Palike, H. (2011). Review and revision of Cenozoic tropical planktonic foraminiferal biostratigraphy and calibration to the geomagnetic polarity and astronomical time scale. Earth-Science Reviews, 104(1–3), 111–142. https://doi.org/https://doi.org/10.1016/j.earscirev.2010.09.003
- Wallace, M. W., Dickinson, J. A., Moore, D. H., & Sandiford, M. (2005). Late Neogene strandlines of southern Victoria: A unique record of eustasy and tectonics in southeast Australia. Australian Journal of Earth Sciences, 52(2), 279–297. https://doi.org/https://doi.org/10.1080/08120090500139455
- Wang, L., Green, C., Radke, B., Tenthorey, E., Ennis-King, J., & Feitz, A. (2020). SRD3.3 Prediction and verification of shallow CO2 migration Phase 2: Static model version 2 and CO2 migration simulations. CO2CRC Report 20-000. CO2CRC Limited.
- Wellman, P. (1974). Potassium–argon ages of the Cainozoic volcanic rocks of eastern Victoria, Australia. Journal of the Geological Society of Australia, 21(4), 359–376. https://doi.org/https://doi.org/10.1080/00167617408728858
- Williams, G. E., Gostin, V. A., & Prescott, J. R. (2013). Stratigraphy and optical dating of Pleistocene coastal deposits in the Port Campbell australite strewn field. Australian Journal of Earth Sciences, 60(4), 463–474. https://doi.org/https://doi.org/10.1080/08120099.2013.795501
- Winchester, J. A., & Floyd, P. A. (1977). Geochemical discrimination of different magma series and their differentiation products using immobile elements. Chemical Geology, 20, 325–343. https://doi.org/https://doi.org/10.1016/0009-2541(77)90057-2