
 ?Mathematical formulae have been encoded as MathML and are displayed in this HTML version using MathJax in order to improve their display. Uncheck the box to turn MathJax off. This feature requires Javascript. Click on a formula to zoom.
Abstract
Rock mechanics experiments show that the magnitude of the intermediate principal stress significantly affects rock failure. Since triaxial stress states (no principal stress is zero) are ubiquitous in the crust, and polyaxial axial states (all three principal stresses are different) are general, the magnitude of the intermediate principal stress should have an important effect on hydrothermal mineralisation. For example, extensional veins or dykes in vein-hosted gold or porphyry deposits may have multiple orientations when the intermediate and least principal stresses have similar magnitudes, or single orientations when the intermediate and maximum principal stresses are similar. The Griffith-Murrell triaxial fracture criterion with a tensile cutoff can be used to illustrate the effects of the intermediate principal stress on failure. At the lowest values of mean stress, the criterion suggests that only extensional failure can occur. At low–intermediate values of mean stress, either extensional or shear failure may occur: extensional failure is favoured when the intermediate and maximum principal stresses have similar magnitudes. At higher mean stresses, shear failure will occur at lower values of pore fluid pressure and differential stress when the magnitudes of the intermediate and minimum principal stresses are similar.
The intermediate principal stress has significant effects on rock strength, which should be considered for understanding failure in hydrothermal mineralising systems, because stress states in the Earth are generally triaxial and polyaxial.
The magnitude of intermediate principal stress relative to those of the other principal stresses affects the range of orientations of extensional fractures, for example in stockworks and sheeted veins.
At low values of mean stress, only extensional failure occurs. At low to intermediate values of mean stress, extension is favoured over shear failure when the magnitudes of intermediate and maximum principal stresses are similar.
At high values of mean stress, shear failure will occur at lower values of pore fluid pressure and differential stress when the magnitudes of the intermediate and minimum principal stresses are similar.
KEY POINTS
Introduction
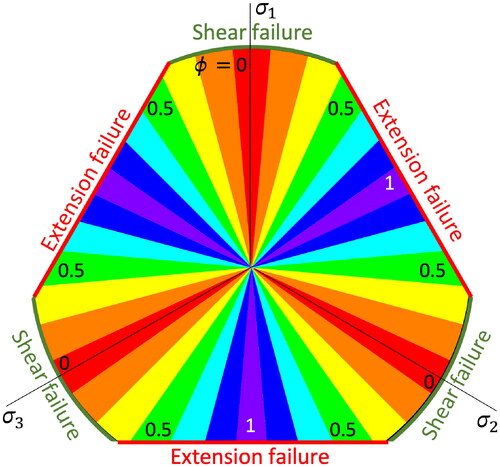
Many hydrothermal mineral deposits are controlled by faults and veins (e.g. Cox, Citation2020; Miller & Wilson, Citation2004; Poulsen, Citation1996; Rhys et al., Citation2020; Robert et al., Citation1995; Sibson, Citation1987; Sibson et al., Citation1988; Tripp & Vearncombe, Citation2004). It is therefore important to know the conditions that lead to failure on faults and veins for understanding ore genesis and mineral exploration. Typical approaches have used Coulomb, Griffith or combined Coulomb Griffith failure criteria in which only the values and the orientations of the maximum and minimum principal stresses play a role (Jaeger & Cook, Citation1979, ch. 4). Failure mode diagrams are an invaluable aid to understanding mechanics of mineralisation, and typically employ such failure criteria (Cox, Citation2010; Sibson, Citation1998).
However, it has been well known since at least the 1960s that the magnitude of the intermediate principal stress has a significant effect on failure (Handin et al., Citation1967; Mogi, Citation1967, Citation1971; Murrell, Citation1963). A considerable body of recent and active research is concerned with failure criteria that take into account the magnitudes of all three principal stresses (e.g. Colmenares & Zoback, Citation2002; Hackston & Rutter, Citation2016; Haimson, Citation2006; Haimson & Rudnicki, Citation2010; Ma & Haimson, Citation2013; Rahimi & Nygaard, Citation2015). These criteria are based on analysing the results of ‘true’ triaxial tests in which the magnitudes of the principal stresses are varied independently to achieve triaxial, polyaxial stress states. In triaxial stress states, no principal stress is zero; in polyaxial stress, all three principal stresses are different ) (e.g. Means, Citation1976, p. 59).
The aim of this study is to consider some effects of the intermediate principal stress on failure modes in hydrothermal mineral systems. Because of the nature of stress in the Earth, this requires an assessment of the effects of triaxial and polyaxial stress states. This study focusses on initial failure of intact rock and does not explicitly consider reactivation, although this is common in mineral systems. The next section considers stress states in the crust, which leads to sections that illustrate several ways in which the effects of the intermediate principal stress may be important.
Tri- and polyaxial states of stress in the crust
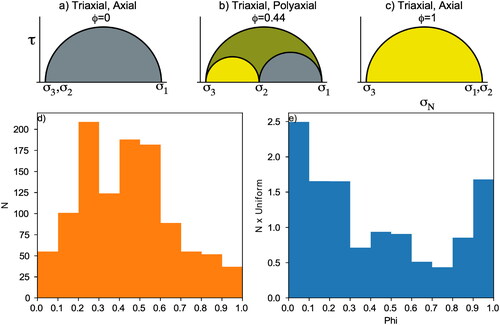
The three principal stresses are taken as with compression positive. The state of stress everywhere in the Earth is triaxial because there are effectively no free surfaces below the Earth’s surface. The stress ratio
characterises the relative values of the principal stresses.
values of 0
and 1
are thus axial; intermediate values are polyaxial (). The distribution of
values in the crust has been investigated using paleostress data by Lisle et al. (Citation2006) with the conclusion that there is a spectrum of
values, skewed towards low stress ratios, with averages of 0.39 in the raw data, and 0.29 in data normalised against a uniform distribution of stress tensors. In this study, 1092 values of
from the 2016 world stress map (quality A to C only) have been analysed () (Heidbach et al., Citation2018). The average
value of these in situ stresses is 0.43, and they are also skewed towards lower values, although by less than the paleostress results. Normalisation by a uniform distribution of stress tensors (Sato & Yamaji, Citation2006) shows an even stronger tendency for low
values (). The standard deviation of 0.22 for the in situ data shows that there is a broad spread of values of
in the crust today, the large majority of which are polyaxial. This variability has important consequences when considering failure criteria. In summary, the state of stress in the Earth is always triaxial and generally polyaxial, and appropriate failure criteria are needed for these conditions.
Figure 1. (a–c) States of stress on a Mohr diagram showing the variation between (a) (b)
and (c)
(d) Histogram of stress ratio (Phi) for 1092 values of
from the World Stress map (A–C quality). (e) These values expressed as multiples of a uniform distribution of stress tensors. These results show that the state of stress in the Earth is generally polyaxial.
Failure modes
A conventional view of failure modes is depicted in , along with their typical appearance on a Mohr diagram with a Griffith failure envelope (e.g. Wojtal et al., Citation2022). Three failure modes are identified: extensional failure, shear failure and an intermediate extensional shear or hybrid failure. The existence of the extensional shear mode of failure has been questioned (Engelder, Citation1999). Experiments demonstrate that fractures will not propagate in their own plane when they are loaded by combined mode 1 and mode 3 stress conditions (Erdogan & Sih, Citation1963; Lawn & Wilshaw, Citation1975). Instead, fractures propagate from the crack in the theoretical direction of greatest tensile stress around the crack tip to become extension fractures.
Figure 2. Conventional view of failure nodes, from left to right: Extension fracture, Extensional-shear and Shear. A schematic Griffith failure envelope on the Mohr diagram shows stress states corresponding to each failure mode in the appropriate colour. White arrows show extensional displacements. The orientation of σ1 in the diagram does not convey a particular geographic orientation.
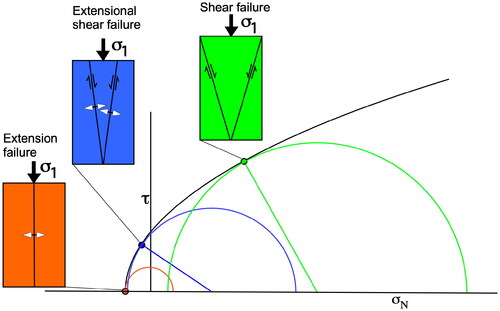
Field evidence has been cited in support of extensional shear behaviour. The Hidden Valley normal fault, Canyon Lake Gorge, Texas, described in great detail by Ferrill et al. (Citation2012) consists of alternating segments with lower and higher dips. The segments with lower dips show evidence for slip (slickenlines), while the steeper segments have evidence for extension and dilation in the form of calcite crystals with euhedral terminations. This extension, however, could be viewed as kinematically controlled by shear on the adjacent lower dip surfaces. Since the fault was repeatedly reactivated, its appearance does not inform about fracture propagation. Field evidence from faults and veins generally documents a finite state of deformation, rather than initial fracture propagation modes in intact rock.
Few experiments have been undertaken to investigate failure in the rather specific stress conditions suggested for extensional shear (e.g. McCormick et al., Citation2021; Ramsey & Chester, Citation2004). McCormick and Rutter (Citation2022) have shown that a continuous, parabolic failure envelope may exist between compressional shear failure and failure with a component of tension. Their microstructural data show that failure with tensile least principal stress occurs by linkage of extension fractures, not by propagation of extensional shear fractures. There is good reason, therefore, to doubt whether extensional shear exists as a distinct failure mechanism for fracture propagation, or that it requires a distinct failure criterion, as anticipated by Engelder (Citation1999). This conclusion does not contradict commonplace observations of veins with finite components of extension and shear.
Triaxial stress and extension veins and dykes
Any fracture or dyke will dilate if the effective normal stress across the fracture/dyke is less than 0 (Delaney et al., Citation1986; Jolly & Sanderson, Citation1997). The normalised dilation tendency on a surface is a useful measure of the propensity to dilate, defined as (e.g. Ferrill et al., Citation1999, Citation2020; Moeck et al., Citation2009):
where σn is the normal stress on the surface. T'D varies from 0 to 1 for fractures with normal stresses of σ1 and σ3, respectively. The dilation tendency depends only on the orientation of the fault/fracture and the stress ratio. Patterns of dilation tendency are shown for three values of stress ratio in .
Figure 3. (a) Equal area, lower hemisphere stereoplots of dilation tendency on poles to planes for a horizontal NS σ1 and a horizontal, EW σ2. Three different values of are shown. Dilation tendency values from 0 to 1 are given by the colour bar. For
=0, the dilation tendency plot suggests that a girdle distribution of extension veins or dykes should occur, with failure planes intersecting in σ1. For
=1, there is a single cluster of poles to high dilation tendency planes, suggesting parallel failure planes. (b) Possible stockwork geometry suggested by the dilation tendency plot with
=0. (c) Possible sheeted vein complex geometry suggested by
=1.
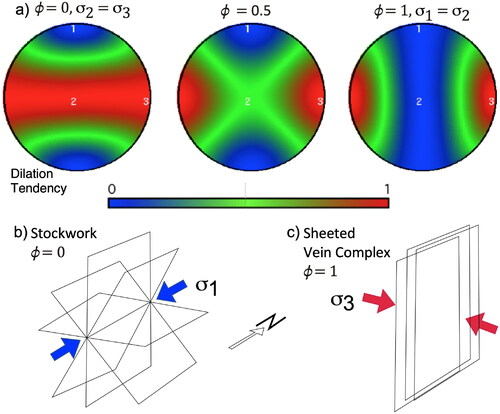
When there is a spread of poles to planes with high dilation tendencies in a girdle perpendicular to
(). This could be manifested in the crust as extensional veins or dykes with multiple orientations intersecting in a common direction (
(), as described by Miller and Wilson (Citation2004) at the Stawell gold deposit, Victoria, or veins with multiple orientations associated with porphyries (Harris & Holcombe, Citation2014). At high values of
poles to planes with high dilation tendencies are concentrated around the least principal stress direction (). Single vein orientations, such as in sheeted vein complexes in epithermal and magmatic ore deposits, are predicted (). Examples of single orientation arrays of mineralised veins are given in Haynes and Titley (Citation1980) and Ridley and Menger (Citation2000): the latter also point out that conjugate vein orientations may characterise some stockworks. Interpretation of stress from vein patterns may be complicated by evolving stress fields (Skarmeta, Citation2021), requiring that veining events are separated into a paragenetic sequence.
Griffith-Murrell failure criterion and representation of triaxial failure conditions
This study focuses on one of the earliest and simplest triaxial criteria to explore the possible effects of triaxial stress on hydrothermal mineralisation, and therefore does not attempt to compare the numerous available different criteria. Murrell extended the Griffith criterion to account for triaxial stresses, leading to a simple formulation for a triaxial shear failure criterion (Murrell, Citation1963):
The Griffith-Murrell criterion was not considered in some of the definitive studies of triaxial failure criteria (e.g. Colmenares & Zoback, Citation2005; Haimson, Citation2006; Kim & Lade, Citation1984). Yet, like the Griffith (biaxial) criterion, it has a simple mathematical expression that depends only on one parameter, the tensile strength of the rock (T, here considered positive), and it is based on the well-known Griffith theory for cracks. The later development of a triaxial failure theory from crack propagation by Murrell and Digby (Citation1970a, Citation1970b) did not predict the observed dependence of strength on the intermediate principal stress, and is not considered here.
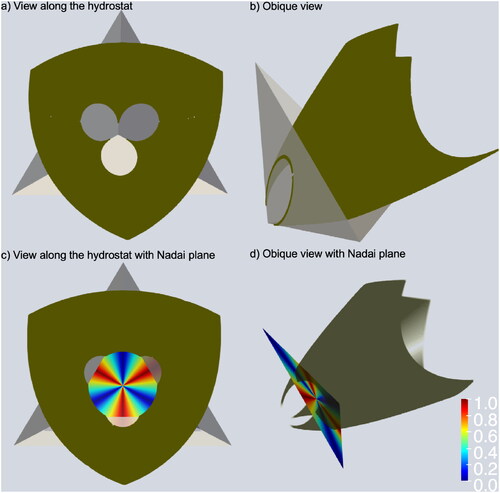
Representing triaxial failure criteria is more challenging than biaxial criteria such as the Griffith or Coulomb criteria. A three-axis stress diagram with the principal stresses along the directions of a right-handed coordinate framework is helpful (). In such a figure, the line is the hydrostatic axis (hydrostat), and the plane perpendicular to it is variously known as the deviatoric plane, the octahedral plane, the
plane or a Nadai diagram (e.g. Colmenares & Zoback, Citation2002; Lisle et al., Citation2006). In this plane, values of the mean stress MS =
are constant. It is conventional in such diagrams to relax the condition that
so that the diagram has a 3-fold rotational symmetry. In the
plane, circumferential position is a function of
and radial distance depends on octahedral shear stress (). shows various views of the Griffith-Murrell failure surface on a three-axis stress plot for arbitrary values of T = 5 MPa and a maximum principal stress of 300 MPa.
Figure 4. (a) Right-handed coordinate reference frame to plot the three principal stresses. The line is the hydrostat, and the plane perpendicular to it (shaded red) is the deviatoric or octahedral plane, the
plane or a Nadai diagram. On this plane, the value of the mean stress is constant. (b) View looking down the hydrostat to the
plane, which is coloured by the value of
in 15° increments. The Griffith-Murrell failure criterion intersects the
plane in a circle.
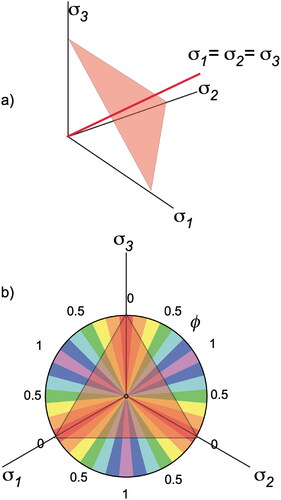
Figure 5. (a–c) Shape of the Griffith-Murrell failure surface viewed from three directions (T = 5 MPa). The surface is plotted with the three principal stresses as axes. The white plane is the plane. The surface is coloured by mean stress in (a) to (d). (d) to (f): Views along the hydrostat towards the origin. (d) Colours represent differential stress,
(e) Colours represent
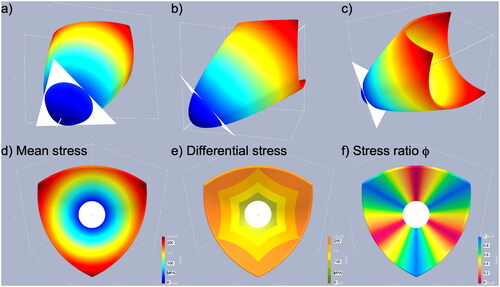
Tensile strength
Tensile strength is a critical parameter in the Griffith-Murrell criterion. Tensile strength can be estimated by direct tension tests and indirect tests such as the Brazilian test (ASTM, Citation2016). It can also be estimated from the unconfined (uniaxial) compressive stress according to empirical relationships proposed by Hoek and Brown (Citation1980) and several modifications (e.g. Cai, Citation2010; Hoek, Citation2007; Zhang & Zhu, Citation2007). However, the estimation of tensile strength is notoriously prone to artefacts created by preparation of laboratory specimens, and by test methods themselves (Koelen et al., Citation2021). shows some values of T for different rocks according to various methods and sources. The use of a tensile strength parameter in a failure criterion is therefore a two-edged sword. In one respect having a single parameter simplifies the criterion and allows simple fitting of experimental data. On the other hand, the choice of which tensile strength to use can be difficult, with estimates varying by over an order of magnitude for a single rock ().
Table 1. Tensile strength for Solnhofen Limestone, Coconino Sandstone and Granodiorite.
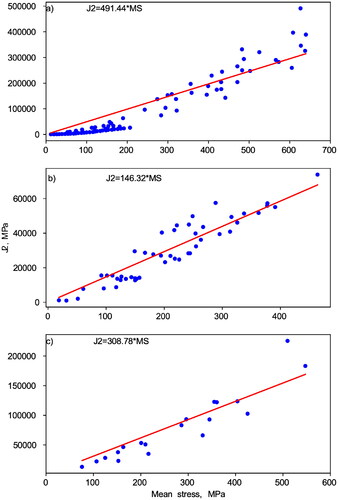
To illustrate how experimental data can be fitted to obtain a tensile strength, the Griffith-Murrell criterion is expressed in terms of the stress invariants and
and the mean stress (e.g. Colmenares & Zoback, Citation2002; Jaeger, Citation1957; Jaeger & Cook, Citation1979):
The Griffith–Murrell criterion is:
Therefore, the Griffith-Murrell criterion predicts linear relations between and
or MS, which can be used to find an appropriate value for T by regression from triaxial experimental data (). The tensile strengths from regression for three examples are listed in .
Figure 6. Plots of the stress invariants against mean stress MS for (a) Solnhofen limestone, (b) Coconino sandstone, and (c) Granodiorite (data sources in ). All regression lines forced through the origin.
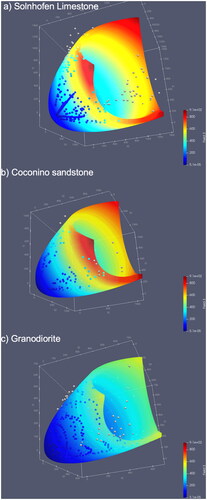
shows the Griffith-Murrell failure surfaces and the experimental data for the three examples in . While there is a generally adequate fit, the failure surfaces tend to show larger stresses than the experimental data at low mean stresses, and vice versa at high mean stresses. This reflects the imperfect fit of the linear regressions in .
Figure 7. Stress at failure (spheres) compared with Griffith-Murrell failure surfaces derived from fitting the data for the tensile strength from . (a) Solnhofen limestone, (b) Coconino sandstone and (c) Granodiorite. Surfaces and spheres are coloured by mean stress. Data sources given in the references to .
Triaxial stress and failure mode diagrams
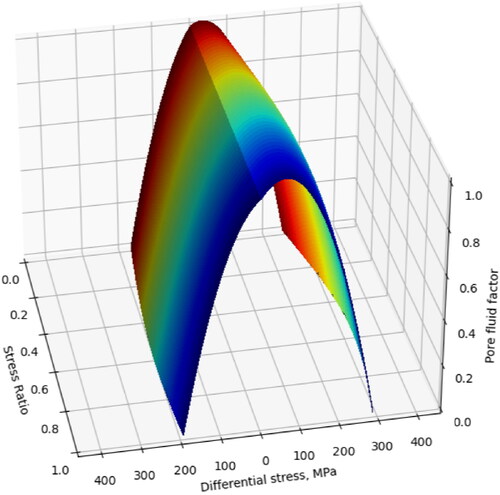
The Griffith-Murrell failure criterion can be employed to construct a failure mode diagram, which shows that lower values of generally require lower differential stresses and pore fluid factors for failure (Blenkinsop et al., Citation2020). Differential stress and pore fluid factor (pore fluid pressure/vertical stress) reach maximum values in the range 0.6 ≤
≤ 1. These relationships are apparent on the three-axis plot of differential stress, pore fluid factor and
in .
Figure 8. Pore fluid factor, differential stress and stress ratio surface predicted by the Griffith-Murrell failure criterion for T = 5 MPa at a depth of 10 km. Differential stresses to the right of the origin are for a normal stress regime ( and to the left, for reverse faulting conditions (
assuming a vertical stress gradient of 27 MPa/km (see Blenkinsop et al., Citation2020).
Adding triaxial tensile failure to the Griffith-Murrell criterion
The Griffith-Murrell failure criterion includes points with stresses very much less than the tensile strength of rocks, which would cause rocks to fail in tension. The relation between the minimum stress on the Griffith-Murrell failure envelope (f) and the tensile strength T is nearly linear in the range −1 >–T > −50 MPa, with
f
3 T. In order to avoid these unrealistic tensile stresses, a tensile cutoff can be introduced (e.g. Lan et al., Citation2019; Paul, Citation1961) by limiting the values of any principal stress to greater or equal to the tensile strength:
illustrates this criterion applied to the Griffith-Murrell plot with T = 5 MPa. The failure surface is truncated by the tensile cutoff along three mutually perpendicular planes parallel to the principal stress planes.
Figure 9. Griffith-Murrell failure surface with a tensile cutoff, for T = 5 MPa. (a–d) Various views as labelled. Colours on the plane indicate the value of
and d shows the intersections of the failure surface and the tensile cutoff with the plane, shown at an intermediate value of mean stress. At the lowest values of mean stress, only tensile failure occurs. For a limited range of low to intermediate values of mean stress, the
plane is cut by both the tensile cutoff and the failure surface. At values of the mean stress greater than a threshold, tensile failure is no longer possible. The Griffith failure criterion for tensile failure in two dimensions is likewise limited to low values of mean stress (e.g. Jaeger & Cook, Citation1979, p.101).
The range of mean stresses for which both the tensile cutoff and the Griffith-Murrell criterion intersect the plane is shown in more detail in . The failure criterion on the
plane is a combination of straight lines and circular arcs. The straight edges are where the tensile cutoff intersects the
plane, and the circular edges occur where the Griffith-Murrell condition intersects the
plane. The tensile cutoff along the straight edges occurs at high values of
and conversely the curved edges where the Griffith-Murrell criterion intersects the
plane are at low values of
The latter edges are at greater distances from the centre of the
plane (the hydrostat), indicating higher octahedral shear stresses.
Figure 10. plane intersected by arcs of the Griffith-Murrell failure surface and straight lines of a tensile cutoff. Colours indicate the labelled values of
Discussion
Failure modes
The Griffith failure criterion is based on the physics of extending the most favourably orientated cracks by tensile failure (Griffith, Citation1924). Shear failure in rocks occurs by linkage of such cracks (e.g. Rutter & Hadizadeh, Citation1991), and the Griffith criterion, when applied to rocks, does not prescribe a specific failure mode for any particular stress conditions. McCormick and Rutter (Citation2022) have shown that tensile cracking and crack linkage are common to experiments with both tensile and compressional stresses, in a continuum of behaviour that does not involve extensional shear as a distinct fracture propagation mode. The implication for hydrothermal mineralisation is that ‘extensional shear’ does not need to be distinguished on a failure mode diagram. The Griffith-Murrell criterion has a continuous failure surface in all stress conditions, in accordance with these findings.
Suitability of the Griffith-Murrell criterion for analysing hydrothermal mineralisation
The Griffith-Murrell criterion is a reasonable fit to some experimental data ( and ), but it is likely that the relationship between 2 and
1 or MS is nonlinear. This is most evident for the Solnhofen limestone data () because it has the greatest range of these variables. Other triaxial failure criteria such as the modified Wiebols-Cook, modified Lade, or triaxial Hoek–Brown may fit these and other data better, and generally have nonlinear relationships between the stress invariants (Colmenares & Zoback, Citation2002; Zhang & Zhu, Citation2007). In general, it may be preferable to have multi-parameter failure criteria both because they fit the experimental data better, and because the parameters can be related to the physics of failure via friction and dilation angles. However, these criteria require true triaxial experiments to determine the additional parameters for a triaxial failure criterion.
A particular problem for applying true triaxial failure criteria in detail to hydrothermal mineralisation is that many rock types that host ores lack much rock mechanics data. For lode gold deposits, for example, banded iron formation, meta-andesites and metadacites, pelites and schists not only lack data but may be highly anisotropic and heterogeneous on a scale that is challenging for experiments.
These factors indicate that the simple Griffith-Murrell criterion may be useful because it involves only one, readily determined, parameter—the tensile strength. The fitted values given in are quite high compared with several other determinations of tensile strength for the same rocks. This may be the influence of relatively high mean stress experimental results on the regression. Measured values of tensile strength are generally dependent on the method of testing or inference, but the Hoek–Brown estimates of tensile strength using the uniaxial tensile strengths are the closest to the values obtained from regression (). It might be possible to make a more appropriate failure criterion for particular mineralising conditions by using only experimental data from the relevant stress ranges.
A tensile cutoff for triaxial failure criteria was advocated by Lan et al. (Citation2019) on the basis of experimental data from nine different rocks, with tensile strengths ranging from a few to several tens of MPa. Some of these data seem to form a parabolic envelope in principal stress space, such as predicted by the Griffith-Murrell failure criteria without a tensile cutoff, while others do show a clear tensile cutoff. It seems that a single criterion for failure in the tensile field remains elusive.
An obvious limitation to fracture criterion such as the Griffith-Murrell, Griffith and Coulomb is that they predict unlimited increases in differential stress at failure as the mean stress is increased. The concept of a cap to the failure criterion has recently been examined by Hobbs and Ord (Citation2022, Citation2023) and could make a useful direction to explore with respect to the Griffith-Murrell failure criterion in future.
Conclusions
Triaxial stress states are ubiquitous in the Earth; they are commonly polyaxial. Since the intermediate principal stress has a significant effect on rock strength, it should be considered when considering failure that could lead to hydrothermal mineralisation. For example, variability in the value of the intermediate principal stress relative to the other principal stresses may have a profound influence on the orientations of extensional veins or dykes in hydrothermal systems. When the magnitudes of the least and intermediate principal stresses are similar, veins or dykes may have multiple orientations intersecting in the direction of the maximum principal stress: this may describe the situation in some stockworks. When the magnitude of the intermediate principal stress is similar to the greatest principal stress, veins/dykes are likely to have a single orientation perpendicular to the least principal stress, as in sheeted vein complexes.
It is appropriate to use a triaxial failure criterion to analyse fault and fracture-controlled mineralisation. Many potential criteria are available, but the test data needed to calibrate most of them are limited, and especially lacking for common rocks that host hydrothermal mineral deposits. The Griffith-Murrell criterion is a simple triaxial failure criterion that depends only on tensile strength. Estimates of tensile strength are widely available. This makes a reasonable case for using the Griffith-Murrell criterion to explore the effects of triaxial stress on hydrothermal mineralisation. The criterion applied to rocks is agnostic about failure mode and is thus compatible with recent experimental results that suggest a continuous parabolic failure surface, without the need for a distinct relationship for extensional shear failure.
The Griffith-Murrell criterion, like other true triaxial criteria, shows that at high mean stresses, failure will occur at higher values of differential stress and higher pore fluid pressures, as the value of the intermediate principal stress becomes closer to the maximum principal stress. A tensile strength cutoff can be added to the Griffith-Murrell criterion to avoid unrealistic values of tensile stress. The tensile cutoff implies that for a limited range of low–intermediate values of mean stress, failure may occur either by extension fracture or on the Griffith-Murrell failure surface. In these circumstances extensional failure is favoured when the maximum and intermediate principal stresses are close. At very low values of mean stress, only extensional failure will occur for any relative magnitudes of stress.
Acknowledgements
Bruce Hobbs, Thomas Poulet, Ernie Rutter, Alex Brown, Levent Tosun, Julian Vearncombe, Ben Williams and an anonymous reviewer made helpful comments during the preparation of this paper.
Disclosure statement
No potential conflict of interest was reported by the author(s).
Data availability statement
All data used in this paper are contained within it or the references cited.
Additional information
Funding
References
- ASTM. (2016). Standard test method for splitting tensile strength of intact rock core specimens. ASTM International.
- Blenkinsop, T., Rowland, J., & Baker, T. (2020). Mechanical regimes of hydrothermal gold mineralization. In J. V. Rowland & D. A. Rhys (Eds.), Applied structural geology of ore-forming hydrothermal systems (pp. 205–214). Society of Economic Geologists. Review in Economic Geology.
- Cai, M. (2010). Practical estimates of tensile strength and Hoek-Brown strength parameter mi of brittle rocks. Rock Mechanics and Rock Engineering, 43(2), 167–184. https://doi.org/10.1007/s00603-009-0053-1
- Colmenares, L. B., & Zoback, M. D. (2002). A statistical evaluation of intact rock failure criteria constrained by polyaxial test data for five different rocks. International Journal of Rock Mechanics and Mining Sciences, 39(6), 695–729. https://doi.org/10.1016/S1365-1609(02)00048-5
- Colmenares, L. B., & Zoback, M. D. (2005). Chapter 6. Geomechanics and the effectiveness of wellbore completion methods of coalbed natural gas (CBNG) wells in the Powder River Basin: Implications for water and gas production. In M. D. Zoback (Ed.), Western resources project final report—produced ground water associated with coalbed natural gas production in the Powder River Basin (pp. 127–157). Wyoming State Geological Survey Report of Investigations. No. 55.
- Cox, S. F. (2010). The application of failure mode diagrams for exploring the roles of fluid pressure and stress states in controlling styles of fracture-controlled permeability enhancement in faults and shear zones. Geofluids, 10(1–2), 217–233. https://doi.org/10.1111/j.1468-8123.2010.00281.x
- Cox, S. F. (2020). The dynamics of permeability enhancement and fluid flow in overpressured, fracture-controlled hydrothermal systems. In J. V. Rowland & D. A. Rhys (Eds.), Applied structural geology of ore-forming hydrothermal systems (pp. 25–82). Society of Economic Geologists. Review in Economic Geology.
- Delaney, P. T., Pollard, D. D., Ziony, I., & Mckee, E. H. (1986). Field relations between dikes and joints: Emplacement processes and paleostress analysis. Journal of Geophysical Research, 91(B5), 4920–4938. https://doi.org/10.1029/JB091IB05P04920
- Engelder, T. (1999). Transitional–tensile fracture propagation: A status report. Journal of Structural Geology, 21(8–9), 1049–1055. https://doi.org/10.1016/S0191-8141(99)00023-1
- Erdogan, F., & Sih, G. C. (1963). On the crack extension in plates under plane loading and transverse shear. Journal of Basic Engineering, 85(4), 519–525. https://doi.org/10.1115/1.3656897
- Ferrill, D. A., McGinnis, R. N., Morris, A. P., & Smart, K. J. (2012). Hybrid failure: Field evidence and influence on fault refraction. Journal of Structural Geology, 42(2012), 140–150. https://doi.org/10.1016/j.jsg.2012.05.012
- Ferrill, D. A., Smart, K. J., & Morris, A. P. (2020). Fault failure modes, deformation mechanisms, dilation tendency, slip tendency, and conduits v. seals. Geological Society, London, Special Publications, 496(1), 75–98. https://doi.org/10.1144/SP496-2019-7
- Ferrill, D. A., Winterle, J., Wittmeyer, G., Sims, D., Colton, S., Armstrong, A., Horowitz, A. S., Meyers, W. B., & Simons, F. F. (1999). Stressed rock strains groundwater at Yucca Mountain. Nevada. GSA Today, 9(5), 2–9.
- Griffith, A. (1924). The theory of rupture. In C. B. Biereno & J. M. Burgers (Eds.), First International Congress of Applied Mechanics (pp. 55–63). Delft. Tech. Boekhandel en Drukkerij.
- Hackston, A., & Rutter, E. (2016). The Mohr–Coulomb criterion for intact rock strength and friction - A re-evaluation and consideration of failure under polyaxial stresses. Solid Earth., 7(2), 493–508. https://doi.org/10.5194/se-7-493-2016
- Haimson, B. (2006). True triaxial stresses and the brittle fracture of rock. Pure and Applied Geophysics, 163(5–6), 1101–1130. https://doi.org/10.1007/s00024-006-0065-7
- Haimson, B., & Rudnicki, J. W. (2010). The effect of the intermediate principal stress on fault formation and fault angle in siltstone. Journal of Structural Geology, 32(11), 1701–1711. https://doi.org/10.1016/j.jsg.2009.08.017
- Handin, J., Heard, H. C., & Magouirk, J. (1967). Effects of the intermediate principal stress on the failure of limestone, dolomite and glass at different temperatures and strain rates. Journal of Geophysical Research, 72(2), 611–640. https://doi.org/10.1029/JZ072i002p00611
- Harris, A. C., & Holcombe, R. J. (2014). Quartz vein emplacement mechanisms at the E26 porphyry Cu–Au deposit, New South Wales. Economic Geology, 109(4), 1035–1050. https://doi.org/10.2113/econgeo.109.4.1035
- Haynes, F. M., & Titley, S. R. (1980). The evolution of fracture-related permeability within the Ruby Star Granodiorite, Sierrita porphyry copper deposit, Pima County, Arizona. Economic Geology, 75(5), 673–683. https://doi.org/10.2113/gsecongeo.75.5.673
- Heidbach, O., Rajabi, M., Cui, X., Fuchs, K., Müller, B., Reinecker, J., Reiter, K., Tingay, M., Wenzel, F., Xie, F., Ziegler, M. O., Zoback, M. L., & Zoback, M. (2018). The World Stress Map database release 2016: Crustal stress pattern across scales. Tectonophysics, 744, 484–498. https://doi.org/10.1016/j.tecto.2018.07.007
- Hobbs, B. E., & Ord, A. (2023). An alternative to the Fault Valve Model. Australian Journal of Earth Sciences, 70(7), 958–971. https://doi.org/10.1080/08120099.2023.2218452
- Hobbs, B., & Ord, A. (2022). Failure modes in fluid saturated rocks: Deformation processes and mode-switching. Geological Magazine, 159(11–12), 2002–2019. https://doi.org/10.1017/s0016756822000516
- Hoek, E., & Brown, E. T. (1980). Empirical strength criterion for rock masses. Journal of the Geotechnical Engineering Division, 106(9), 1013–1035. https://doi.org/10.1061/AJGEB6.0001029
- Hoek, E. (2007). Practical rock engineering. https://www.rocscience.com/learning/hoeks-corner.
- Jaeger, J. C. (1957). The temperature in the neighborhood of a cooling intrusive sheet. American Journal of Science, 255(4), 306–318. https://doi.org/10.2475/ajs.255.4.306
- Jaeger, J. C., & Cook, N. G. W. (1979). Fundamentals of rock mechanics. Chapman and Hall.
- Jolly, R. J. H., & Sanderson, D. J. (1997). A Mohr circle construction for the opening of a pre-existing fracture. Journal of Structural Geology, 19(6), 887–892. https://doi.org/10.1016/S0191-8141(97)00014-X
- Kim, M. K., & Lade, P. V. (1984). Modelling rock strength in three dimensions. International Journal of Rock Mechanics and Mining Sciences & Geomechanics Abstracts, 21(1), 21–33. https://doi.org/10.1016/0148-9062(84)90006-8
- Ko, T. Y. (2008). Subcritical crack growth under mode I, Ii, and Iii Loading for Coconino Sandstone [unpublished PhD thesis]. University of Arizona.
- Koelen, K., Alber, M., Duda, M., & Backers, T. (2021). Effect of sloppy sample preparation on results from uniaxial compressive strength tests. IOP Conference Series: Earth and Environmental Science, 833(1), 012030. https://doi.org/10.1088/1755-1315/833/1/012030
- Lan, H., Chen, J., & Macciotta, R. (2019). Universal confined tensile strength of intact rock. Scientific Reports, 9(1), 1–9. https://doi.org/10.1038/s41598-019-42698-6
- Lawn, B., & Wilshaw, T. (1975). Fracture of brittle solids. Cambridge University Press.
- Lee, H., & Haimson, B. C. (2011). True triaxial strength, deformability, and brittle failure of granodiorite from the San Andreas Fault Observatory at depth. International Journal of Rock Mechanics and Mining Sciences, 48(7), 1199–1207. https://doi.org/10.1016/j.ijrmms.2011.08.003
- Lisle, R. J., Orife, T. O., Arlegui, L., Liesa, C., & Srivastava, D. C. (2006). Favoured states of palaeostress in the Earth’s crust: Evidence from fault-slip data. Journal of Structural Geology, 28(6), 1051–1066. https://doi.org/10.1016/j.jsg.2006.03.012
- Ma, X., & Haimson, B. C. (2013). Failure characteristics of two porous sandstones subjected to true triaxial testing. In X-T. Feng, J. A. Hudson & F. Tan (Eds.), Rock Characterisation, Modelling and Engineering Design Methods (pp. 93–98). Proceedings of the 3rd ISRM SINOROCK 2013 Symposium. Tongji University, Shanghai, China.
- McCormick, C. A., Corlett, H., Stacey, J., Hollis, C., Feng, J., Rivard, B., & Omma, J. E. (2021). Shortwave infrared hyperspectral imaging as a novel method to elucidate multi-phase dolomitization, recrystallization, and cementation in carbonate sedimentary rocks. Scientific Reports, 11(1), 1–16. https://doi.org/10.1038/s41598-021-01118-4
- McCormick, C. A., & Rutter, E. H. (2022). Tectonophysics an experimental study of the transition from tensile failure to shear failure in Carrara marble and Solnhofen limestone: Does “hybrid failure” exist? Tectonophysics, 844(May), 229623. https://doi.org/10.1016/j.tecto.2022.229623
- Means, W. D. (1976). Stress and strain: Basic concepts of continuum mechanics for geologists. Springer Verlag.
- Miller, J. M., & Wilson, C. J. L. (2004). Structural analysis of faults related to a heterogeneous stress history: Reconstruction of a dismembered gold deposit, Stawell, western Lachlan Fold Belt, Australia. Journal of Structural Geology, 26(6–7), 1231–1256. https://doi.org/10.1016/j.jsg.2003.11.004
- Moeck, I., Kwiatek, G., & Zimmermann, G. (2009). Slip tendency analysis, fault reactivation potential and induced seismicity in a deep geothermal reservoir. Journal of Structural Geology, 31(10), 1174–1182. https://doi.org/10.1016/j.jsg.2009.06.012
- Mogi, K. (1967). Effect of the intermediate principal stress on rock failure. Journal of Geophysical Research, 72(20), 5117–5131. https://doi.org/10.1029/jz072i020p05117
- Mogi, K. (1971). Effect of the triaxial stress system on the failure of dolomite and limestone. Tectonophysics, 11(2), 111–127. https://doi.org/10.1016/0040-1951(71)90059-X
- Murrell, S. A. F. (1963). A criterion for brittle fracture of rocks and concrete under triaxial stress and the effect of pore pressure on the criterion. In C. Fairhurst (Ed.), Rock Mechanics (pp. 563–577). Pergamon Press.
- Murrell, S. A. F., & Digby, P. J. (1970a). The theory of brittle fracture initiation under triaxial stress conditions—II. Geophysical Journal International, 19(5), 499–512. https://doi.org/10.1111/j.1365-246X.1970.tb06050.x
- Murrell, S. A. F., & Digby, P. J. (1970b). The thermodynamics of brittle fracture initiation under triaxial stress conditions. International Journal of Fracture Mechanics, 8(2), 167–173. https://doi.org/10.1007/BF00703878
- Paul, B. (1961). A modification of the Coulomb-Mohr theory of fracture. Journal of Applied Mechanics, 28(2), 259–268. https://doi.org/10.1115/1.3641665
- Poulsen, K. H. (1996). Lode gold. In O. R. Eckstrand, W. D. Sinclair, & R. I. Thorpe (Eds.), The Geology of North America (pp. 323–328). Geological Society of America.
- Rahimi, R., & Nygaard, R. (2015). Comparison of rock failure criteria in predicting borehole shear failure. International Journal of Rock Mechanics and Mining Sciences, 79, 29–40. https://doi.org/10.1016/j.ijrmms.2015.08.006
- Ramsey, J., & Chester, F. M. (2004). Hybrid fracture and the transition from extension fracture to shear fracture Jonathan. Nature, 428(6978), 63–66. https://doi.org/10.1038/nature02333
- Rhys, D. A., Lewis, P. D., & Rowland, J. V. (2020). Structural controls on ore localization in epithermal gold-silver deposits: A mineral systems approach. In J. V. Rowland & D. A. Rhys (Eds.), Applied structural geology of ore-forming hydrothermal systems (pp. 83–145).Society of Economic Geologists (Review in Economic Geology).
- Ridley, J., & Mengler, F. (2000). Lithological and structural controls on the form and setting of vein stockwork orebodies at the Mount Charlotte gold deposit, Kalgoorlie. Economic Geology, 95(1), 85–98. https://doi.org/10.2113/gsecongeo.95.1.85
- Robert, F., Boullier, A-M., & Firdaous, K. (1995). Gold–quartz veins in metamorphic terranes and their bearing on the role of fluids in faulting. Journal of Geophysical Research: Solid Earth, 100(B7), 12861–12879. https://doi.org/10.1029/95JB00190
- Rutter, E. H., & Hadizadeh, J. (1991). On the influence of porosity on the low-temperature brittle-ductile transition in siliciclastic rocks. Journal of Structural Geology, 13(5), 609–614. https://doi.org/10.1016/0191-8141(91)90047-M
- Sato, K., & Yamaji, A. (2006). Uniform distribution of points on a hypersphere for improving the resolution of stress tensor inversion. Journal of Structural Geology, 28(6), 972–979. https://doi.org/10.1016/j.jsg.2006.03.007
- Sibson, R. (1987). Earthquake rupturing as a mineralizing agent in hydrothermal systems. Geology, 15(8), 701. https://doi.org/10.1130/0091-7613(1987)15 < 701:ERAAMA>2.0.CO;2
- Sibson, R. (1998). Brittle failure mode plots for compressional and extensional tectonic regimes. Journal of Structural Geology, 20(5), 655–660. https://doi.org/10.1016/S0191-8141(98)00116-3
- Sibson, R., Robert, F., & Poulsen, K. (1988). High-angle reverse faults, fluid-pressure cycling, and mesothermal gold–quartz deposits. Geology, 16(6), 551–555. https://doi.org/10.1130/0091-7613(1988)016 < 0551:HARFFP>2.3.CO;2
- Skarmeta, J. (2021). Structural controls on alteration stages at the Chuquicamata copper–molybdenum deposit, northern Chile. Economic Geology, 116(1), 1–28. https://doi.org/10.5382/ECONGEO.4769
- Tripp, G. I., & Vearncombe, J. R. (2004). Fault/fracture density and mineralization: A contouring method for targeting in gold exploration. Journal of Structural Geology, 26(6–7), 1087–1108. https://doi.org/10.1016/j.jsg.2003.11.002
- Wojtal, S., Blenkinsop, T., & Tikoff, B. (2022). An integrated framework for structural geology: kinematics, dynamics, and rheology of deformed rocks. Wiley.
- Zhang, L., & Zhu, H. (2007). Three-dimensional Hoek-Brown strength criterion for rocks. Journal of Geotechnical and Geoenvironmental Engineering, 133(9), 1128–1135. https://doi.org/10.1061/(asce)1090-0241(2007)133:9(1128)