
Abstract
Basic, nuts and bolts structural geology is the unheralded success story central to brownfields exploration that in Australia, and globally, has grown manyfold mineral deposits beyond the start-of-mine Reserve. Since the last (2012) meeting on applied structural geology and Resources, the topic has changed dramatically. Now, structural geology is practised daily and in house by most exploration and mining companies.
A diversity of settings, host rocks, control and geometry make it critical to document precisely the rocks in front of the geologist as distinct to what is in a preconceived conceptual model. It is detail that makes for new discoveries and deposit extensions.
Three-dimensional computer visualisation helps with volumetric thinking, but there remains no computer alternative to the 3D cognitive geologist. Now essential structural data are integrated with other data, but the product is a hypothesis to be tested, not a silver bullet. Lineations matter and inform.
The primary deliverable is images, be they hand-drawn or computer-generated showing the inter-relationships of structure, lithology, mineralisation and mine-site infrastructure/design. With their important embedded knowledge, the geologist, who took the readings, should also be entering, plotting data, synthesising, modelling and presenting to management and Directors.
KEY POINTS
Introduction
As is well known, the concentration of gold is commonly related to the changes in attitude of the host vein, lode or formation. There are many excellent examples of this relationship in Australia (Conolly, Citation1936). This paper overviews the necessary linkage of structural geology and management that a young company geologist when asked to document rock structures in the field, a core yard or underground hopes their managers know but probably do not. Here are some knowledge tools to manage upwards.
Resource industry
In Australia, the importance of mining is far greater than widely recognised partly because mining impacts an extremely small fraction of land (0.02%), which is mostly remote (ABARES, Citation2016). Australian mining, including energy, accounts for 57% of all export earnings (Department of Foreign Affairs and Trade, Citation2021—data for 2019–2020). Each of the commodities, gold, iron ore, coal and natural gas, is larger than the so-called ‘important’ industries of education and tourism. For young professionals, the mining industry provides multiple early-career opportunities and high remuneration for geologists and geophysicists (Business Insider, Citation2020).
Mineralisation controlled by structure
Many, but not all, mineral deposit types are epigenetic and hence structurally controlled. Best known are lode gold deposits, and this epigenetic control extends to others such as basin Pb–Zn deposits (Keays et al., Citation1989; Sangster, Citation1996). Many mineral deposits that may be regarded syngenetic are controlled by structures, mostly high-level faults, such as epithermal and volcanogenic massive sulfides (Sibson, Citation1987; Vearncombe et al., Citation1998). Deposits such as Archean Ni, which are largely syngenetic volcanic, can show significant structural modification and in some cases upgrading (Perring, Citation2015). Iron ores are largely sedimentary syngenetic but with significant structural modification and fault–fracture controls on supergene upgrading (Angerer et al., Citation2017; Thorne et al., Citation2017). The orthodox ‘magma-syngenetic’ deposits such as porphyry Cu–Mo–Au are structure-controlled hydrothermal veins in solid brittle (cooled) intrusive host (Phillips et al., Citation2023; Piquer et al., Citation2021; Skarmeta, Citation2021). Structure is the major control, and structural geology an essential tool for finding, assessing and mining these deposits.
Deliberately lowbrow, this contribution examines the application of structural geology to company mine and exploration sites. The paper is about the background science that is necessary, often assumed, but rarely explained. It is the science that informs management. I overview the history of applied structure, cognitive skills, site structural geology practice and deliverables. Specifically, the preferred deliverable is illustrations in 2D and 3D. This publication emphasises recent brownfield successes attributed to structural geology, but that structure remains under-utilised in Resource evaluations. While not limited in application, examples used here are mostly gold mines in Australia, especially the Yilgarn Craton of Western Australia.
Short history
Applied structural geology has had an especially rocky history with a false start in the 1930s and 1940s but is now practised in house by most mining and exploration companies.
Structure 1930s onwards
The early works of Conolly (Citation1936), Newhouse (Citation1940) and McKinstry (Citation1948) ( and ) present structure as the control on ores especially gold. The realisation was based on a presumption of ores being added to the host and was before the rigorous quantitative structural geology initiated in the 1960s (e.g. Hobbs et al., Citation1976; Ramsay, Citation1967). Newhouse observes that displacements on host faults are typically small ‘tens of feet’ and says ‘in normal faults a likely place for openings, and consequent ore shoots, is where the dip steepens; in reverse faults where the dip flattens’. Both Conolly and Newhouse present similar but in detail different geometric solutions for motion on non-planar faults (commonly known as a Conolly diagram), possibly unaware of the other’s work.
Figure 1. Diagrams from Conolly (Citation1936) showing the relationship of gold to faults and changes in vein lode orientation recorded in the contouring method developed by Conolly. The following descriptions paraphrase his original descriptions. Conolly uses feet as the measure of distance and dwt (penny weights per imperial ton, 1 dwt = 1.55 g or 0.05 oz) a measure of gold grade. (a) Concentration of gold, commonly related to the changes in attitude of the host vein. An arbitrary reference plane on the mine-level plan or section is drawn. The distance between the reference plane and vein centre (or wall) is then measured. Plan and vertical (section) projections of the measured vein position are written on the projection. Measurements are made vertically if contouring in plan and horizontally if contouring in vertical projection. Measurements are contoured relative to the reference plane. (b) Conolly contour plot of the Great Fingall gold mine, Cue, Western Australia. The quartz vein-hosted ore body pitches southwest confined to the middle limb of a prominent S bend. From the surface to the 5 level, the ore limb is rotated in plan slightly anti-clockwise. From the 5 to 12 levels, the limb is the central part of the S bend. Below 12 level, it rotates back clockwise. The S bend provides the loci of the whole deposit and component ore shoots. The ore shoots are richest between levels 5 and 12 in the mid position of the S bend. (c) Conolly contour plot of the Cosmopolitan Mine, Kookynie, 180 km north of Kalgoorlie. Quartz reefs are controlled by an intricate fault pattern (according to Conolly faults are pre-gold) with a large number of acute fault intersections. Ore shoots are found only on the faults striking north and northeast, and especially developed where the vein system has a lower dip (shown by the paucity of contours). (d) A summary structure-gold plan for the Cosmopolitan mine, showing the crest and valley lines of the contours on the quartz vein superimposed on the gold plan. There are three governing loci: (i) western slope of broad ridge trending northwest; (ii) southern slope of a ridge valley set running east–west; and (iii) crest and valley lines trending east of north.
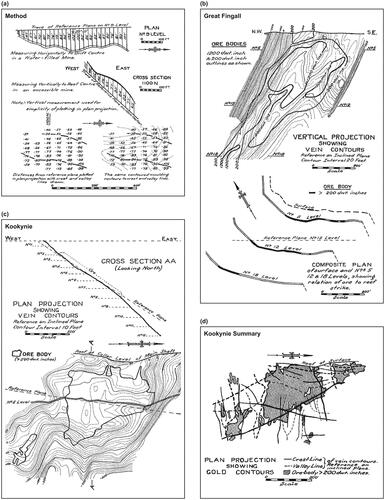
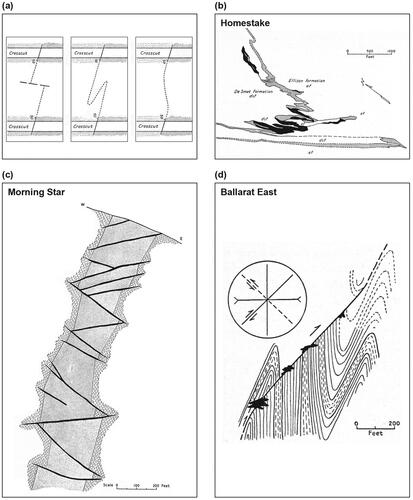
Figure 2. Illustrated structure controls on ore from the book ‘Mining Geology’ by McKinstry (Citation1948). (a) Alternative interpretations of identical observations between mine levels, faulted, folded and flexed interpretations. (b) Ore shown in black in favourable fold positions in the Homestake Formation (banded-iron; cross-hatched), Homestake gold mine, USA. (c) Gold-bearing veins in fractures in a dyke of massive monzonite. Veins die out in adjoining slate. Cross-section Morning Star Mine, Woods Point Victoria, Australia. (d) Quartz bodies (black) in tension openings on reverse fault. Britannia United Mine, Ballarat East goldfield, Victoria Australia. (e) Tension fractures en echelon beyond the ends of a shear fracture. Stope plan Malartic Mine, Canada. (f) En echelon arrangement of lenses. 200-foot level, Vaucluse Mine Orange County, Virginia, USA. (g) Replacement ore bodies in limestones localised on minor anticlines, Tombstone, Arizona, USA. (h) Pattern of conjugate faults displacing vein system. Section through Main Lode (Golden Mile), Kalgoorlie, Western Australia. The diagram is reproduced faithfully acknowledging that on current understanding this not a first-order geometry control at Kalgoorlie.
Regrettably, these pre-eminent works by Conolly, Newhouse, McKinstry and others (summarised in CIMM, Citation1948, Citation1957; Newhouse, Citation1942) did not mark a growth point for applied structural geology. With critical exceptions related to folding control on ores in Western Australia (Campbell, Citation1958) and Broken Hill (NSW, Gustafson et al., Citation1950; Hobbs, Citation1966), economic geology was dominated by the North America-driven 1950s to 1970s trend that promoted mineralogy and stratigraphy as the essential geo-tools.
The most important breakthrough in earth science in the 1980s was the realisation that there are fluids at depth in the crust, mostly aqueous but also carbon dioxide and methane. These fluids migrate, react and control, being central to understanding earth processes and importantly mineralisation (Fyfe Citation1985, Fyfe & Kerrich, Citation1985, Wood & Walther, Citation1986). Before the 1980s, most hydrothermal mineralisation was regarded as a product of local (intra-system) high-salinity magmatic fluids, and exploration focused on prospective stratigraphy (Skinner & Barton, Citation1973). The reason why this sometimes worked was because shear zones were mistaken for stratigraphy, and schists and mylonite with porphyroclasts mistaken for tuffs. (Sadly, these errors still occur.) The North America-driven view of mineralisation as syngenetic largely ignored structure. The dramatic late 1970/early 1980s increase in the gold’s dollar price then encouraged gold-only exploration and resulted in models for gold independent of base metals. Indications that the syngenetic paradigm was incorrect came with the realisation that the Archean gold-only fluids were of low salinity and regional metamorphic in origin, and that host rocks to gold Resources are consistently deformed (Groves & Phillips, Citation1987; Phillips, Citation1993). Nowhere is (primary) gold-only ore not found in a structure, nor is the metal elevated in undeformed rock (Colvine, Citation1989; Groves et al., Citation1989; Kerrich & Feng, Citation1992).
Although heated debate occurred in the economic geology community (Archean Gold: Barberton Centenary Symposium, Citation1984; Hutchinson & Burlington, Citation1984; Ridler, Citation1970) globally structural and metamorphic geologists had few problems accepting that gold and many other commodities are epigenetic and controlled by deformation as assumed by the earlier works of Conolly (Citation1936), Newhouse (Citation1940) and McKinstry (Citation1948). There followed a flood of research papers and a host of consultants, each evidence-testing control models and seeking worldwide application. Not the only model, the most noted was the Riedel Shears boom. In 1987 (pre-October crash) an Australia stock exchange listing prospectus would typically include a 2D map analysis and interpretation in terms of the brittle shear model (Riedel, Citation1929; Tchalenko, Citation1970; ). The structural interpretation of the shear zones and subsidiary structures were recommended exploration tools with analysis of aeromagnetic images and the detection of lineaments showing D, R, R′ and T geometries (Harris, Citation1987; Mueller & Harris, Citation1987). This paradigm is criticised, as it encouraged some poor science (late 1980s to 1990s), a two-dimensional interpretation of maps (and aeromagnetic imagery) ignoring the third dimension without input from mineral lineation and kinematic data. Most of the fractures described as D, R, R′ and T extend beyond the margins of regional shear zones, in some places beyond the limits of the regional aeromagnetic imagery (). Much of the gold in the Yilgarn Craton is related to a mesh of small-displacement cross-cutting structures associated with late compressional events that overprint and are not internal components of regional shear zone. Interestingly, there is no reference to Riedel Shears in the AIG 2022 Structural Geology and Resources (Kalgoorlie) symposium abstract volume (Vearncombe, Citation2022). Criticised by this author for reasons of scientific quality, the Riedel–Tchalenko paradigm had the important function of introducing structural geology to a broad community including geochemists, stock analysts, stockbrokers and engineers.
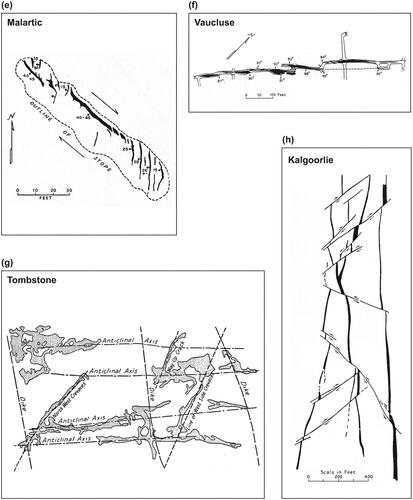
Figure 3. Geometry of main subsidiary structures within a wrench zone. The Tchalenko instantaneous brittle shear fractures in an otherwise homogenous rock unit. D, principal displacement shear parallel to boundaries of zone; R and R′, Riedel shears (dilational); T, tension gashes or normal faults (dilational); S, fold axes (re-drawn from Harris, Citation1987; Mueller & Harris, Citation1987). Note that once a rock is weakened by these fractures, preferentially oriented surfaces especially the R-surfaces will host the subsequent uptake of progressive deformation.
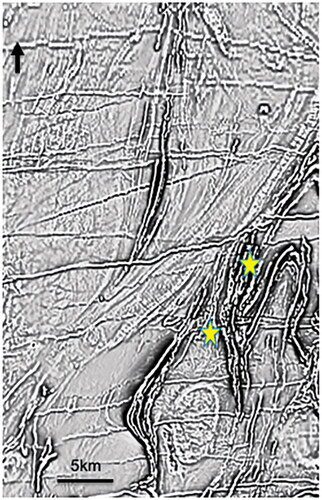
Figure 4. Aeromagnetic image (TMI-RTP-1VD, no shadow) of the Archean NW Yilgarn around Meekatharra showing regional structures: the large dextral regional Moongarnoo shear zone, kilometric-scale S-C fabrics within the shear zone, regional folds of banded-iron formations and ultramafic flows, pressure shadows to sub-regional scale granites (largely undeformed cores), cross-faults (mostly narrow linear magnetic lows) and mostly Proterozoic dolerite dykes (magnetic highs). There is only minor hard-rock outcrop in this area. Star symbols show the location of the two >1 Moz goldfields. Paddys Flat is a complex area of magnetic ultramafic and banded-iron formations, with cross-faults. The second southern goldfield is Yaloginda (Bluebird) in the northern pressure shadow of the granite with cross-faults. An exploration target may be hypothesised, being the southern pressure shadow of the same oval granite. This author has drilled one Air-Core hole, and any mineralisation is beneath >100 m of barren clays.
Realising the weakness of the Riedel–Tchalenko shear paradigm for gold, academics and consultants developed a gamut of models for control on gold and other commodities. These are reviewed by Vearncombe and Zelic (Citation2015), and that detail is not repeated here except in simple list form: reverse faults on greenstone margins (Nutt et al., Citation1987), seismic pumping, earthquake rupturing (Sibson, Citation1987), stress mapping (Holyland & Ojala, Citation1997), fault value activity (Sibson et al., Citation1988), unconformity control (Robert et al., Citation2005; Tripp et al., Citation2020), lightning paradigm (Hronsky, Citation2011) and nonlinear disequilibrium processes (Hobbs et al., Citation2011). All have a significant contribution to understanding, but few have been successful predictions of new Resources.
Rheology
Many studies of structural controls of mineralisation focus on the geometry, folds or fault–fracture–vein patterns. Behind these studies is a record of the strain response to the rheology of the rocks. Rocks deform and mineralise differently according to the orientation and heterogenous strength of the rock. Both weak and strong positions may be mineralised depending on stress maximum relative to host geometry. illustrate ores preferably in flexural-slip positions in banded-iron folds at Homestake and at Ballarat East in tension openings on reverse faults focused on banded strata. shows a rheologically strong dyke of monzonite mineralised in a stockwork. Similarly, Mt Charlotte (Kalgoorlie) is a stockwork in a very specific host rock, the unit 8 granophyre of the Golden Mile Dolerite. While the chemistry and availability of iron may be partly a control at Kalgoorlie, unit 8 is less iron-rich than the adjacent unmineralised unit 9 (Phillips et al., Citation2017).
Deformation of sulfides
An interesting digression, banded sulfide ores have long been of controversial origin. Are they banded owing to deformation during metamorphism, or do the sulfides replace a banded precursor rock type (Newhouse & Flaherty, Citation1930)? Similarly, there has been debate on the origin of cusps and piercement features where sulfide ores penetrate wall rock, and of durchbewegung textures where commonly banded ores and recrystalised sulfides host clasts of rounded wall rock and quartz (Maiden et al., Citation1986; Marshall & Gilligan, Citation1989). For the most part, the textures are explained with all sulfide minerals except pyrite having brittle–ductile transitions at temperatures below mid-greenschist conditions. Sulfides deform like rheologically weak rocks such as shale, marl, and layers of evaporite minerals (McClay, Citation1991).
Role and standing today
Three-dimensional geology
Structural geology is a 3D science, requiring communication and reasoning about the geological history. Self-assessing, in the general population the proportion of people who agree that they can think in 3D, is about 22%, although among those diagnosed with dyslexia, that figure is about 70% (Dyslexia advantage, https://www.dyslexicadvantage.org/thinking-in-3d/?cn-reloaded=1; roughly 20% of the general western-world English-speaking population has some form of dyslexia). With the obvious caveats on self-assessment of cognitive ability, this is a result matched by casual experience. It is a fair assumption that many company staff cannot and do not think in 3D, but thinkers who spatial-visualise are essential.
There is surprisingly little known about how experts communicate and reason in 3D (Gagnier et al., Citation2016). Differences exist in the type of spatial thinking critical to different aspects of earth science. These skills fall into the below categories.
Disembodying: seeing important features amid visual distraction such as vegetation and picking structural elements that inform in preference to the visually dominant.
Volumetric thinking: reasoning about the inside of a solid from visible features on the surface.
Dynamic reasoning: changes that have occurred over time comprising stratigraphy, intrusive events and the sequence of deformations.
Scaling: deducing the inter-relationships of small and large-scale features. In geology, many (but not all) scale-dependent relationships are known as Pumpelly’s rule; an acknowledgement of fractal geometries (Muehlhaus et al., Citation1991; Pumpelly et al., Citation1894; Tarampi et al., Citation2016).
Modern 3D computer visualisation helps with volumetric thinking, but this can be an impediment if the software separates shape modelling from structural understanding.
Geologists and especially structural geologists, self-select based on spatial visualisation skills (Titus & Horsman, Citation2009) and typically make use of gesture and sketching to realise 3D structures. Studies suggest that students may learn to visualise sections through simple objects in the short term and that continued geology studies improve spatial visualisation (Cohen & Hegarty, Citation2014; Orion et al., Citation1997). While most improve with practice, to this author’s knowledge there is no research suggesting those with poor spatial skills can train to dramatically improve outcomes. Some geologists able to work in 2½D (multiple sections and plans) still struggle to work in 3D.
Absence of outcropping rock
On the Yilgarn Craton, there is less than 1% greenstone outcrop (including saprolite) and less than 0.1% of fresh rock. Regolith clays can be more than 100 m deep, and weathering can reach to 300 m depth. Geology maps prior to the 1980s were little more than plum pudding representations of widely scattered and rare outcrops including sub-crop and float, all between mapped regolith units. The maps had rare structure readings and no regional structures, interpreted or observed. After the first aeromagnetic survey in the Yilgarn was flown (for Zinc Corporation and WMC in 1948), the BMR (now Geoscience Australia—GA) took up the challenge, and coverage of the main goldfields was completed by 1970, resulting in paper contour maps that had a major impact on the late 1960s–early 1970s nickel boom (Isles & Cunneen, Citation2015). One-mile coverage of the Yilgarn was completed in 1981. Local magnetic surveys continued to be run by exploration companies using closer line spacings. With the surge in gold exploration in the early 1980s and improvements in technology, surveys became increasingly useful, culminating in the Aerodata coverage of the Yilgarn goldfields from 1983. This enabled Archean rock units and structures to be followed beneath the regolith. Continuous 200 m line spacing data over very large areas uncovered astounding structural and lithological detail, on both local and regional scales. The early 1980s saw the introduction of image processing, which allowed geologists to take full charge of data interpretation (Isles & Cunneen, Citation2015). Aeromagnetic surveys now accompany exploration globally, whether lacking or rich in rock outcrop. In Australia, many surveys are multiclient, are collated by the state geological surveys, are widely available at minimal cost and for the Yilgarn are freely available. Lithology, shear zones, folds and faults are readily mapped from aeromagnetic images ().
Diversity in controls
Importantly, it is rare for the controls to be the same on adjacent deposits. There is a diversity of controls as illustrated in , each distinctly different (McKinstry, Citation1948). have a tension gash control, but even here there is a difference: being veins in the T-direction and veins about the R- or Riedel shear direction of Tchalenko (Citation1970).
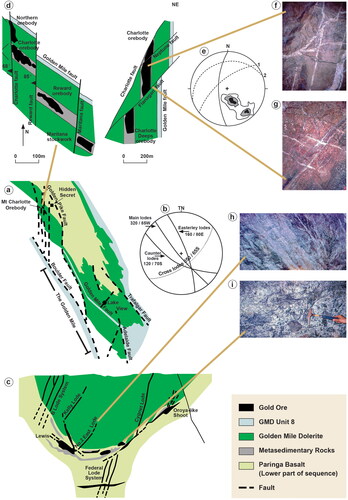
A classic example of diversity is at Kalgoorlie. The upright Mt Charlotte underground mine is a quartz–gold vein stockwork in a specific rock type: the Unit 8 granophyre of the Golden Mile Dolerite. The adjacent Golden Mile open pit has brittle–ductile shear zones traversing a range of rock types but with moderate south-plunging high-grade ruler-shaped shoots where shear zones and carbonaceous interflow sediments intersect (). The two deposits have a different control, drilling geometries are different, and mining methods are very different.
Figure 5. Kalgoorlie has produced about 70 Moz gold (total endowment of 97 Moz). Arguably this is the richest real estate on the planet. If you adopt an Oroya Shoot (northern part of Golden Mile) model for exploration, it may miss the nearby but very different Mt Charlotte, and vice versa. (a) Kalgoorlie goldfield geology map with inset. (b) Stereonet of the lodes in the Golden Mile with intersection close to the plunge of the Kalgoorlie syncline in (c) cross-section showing brittle-ductile shear zones in both Paringa Basalt and overlying Golden Mile Dolerite, and intersection lodes including the Oroya Shoot at contact sediment (re-drawn from Phillips et al., Citation2017). (d) A stockwork of veins in Unit 8 granophyre of the Golden Mile Dolerite, Mt Charlotte orebody at Level 3 and cross-section at 52850 mN. Re-drawn from Ridley and Mengler (Citation2000) itself modified from Clout et al. (Citation1990). (e) Lower-hemisphere equal-area stereonet of the quartz–gold veins in the Mt Charlotte ore body, level 19 from Mueller (Citation2017) itself modified from Reed and Askew (Citation1984). (f) The two vein sets Mt Charlotte. (g) Veins of Mt Charlotte type cross-cutting the Flanagan Fault suggesting that some mineralisation is post-faulting. (h) Brittle–ductile shear one (10 cm wide) hosting gold in the Golden Mile Dolerite at Perseverance mine. (i) The Flat-lode, an Oroya-like, ruler-shaped shoot of quartz breccia at North Kalgurli mine. (Photographs by the author taken in 1988 underground, North Kalgurli and Perseverance shafts. Soon after, these shafts closed and are now part of the super-pit.)
The diversity of setting, control and geometry makes it critical to document the factual geology, as distinct to what is expected in a certain model. Robert and Poulsen (Citation2022) detail the same assertion from a Canadian perspective.
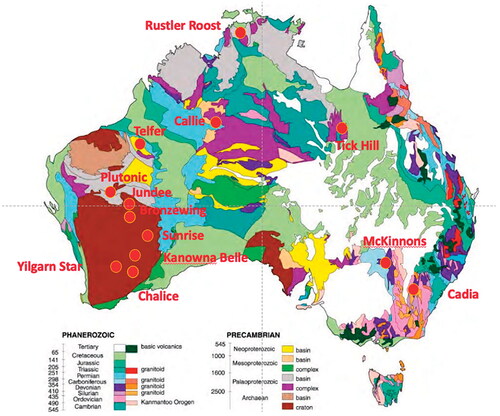
Figure 6. Deposits mentioned in text and . Base geology from: https://commons.wikimedia.org/wiki/File:Ausgeolbasic.jpg.
Lacking consistency in model control, gold deposits appear to be in the most complex part of the regional geological map. It has been argued that mineralisation is consistently in sites of paleo-low mean stress, into which fluids were focused (Ridley, Citation1993), although Hobbs and Ord (Citation2022), adding a whole new dimension of complexity, argue that low fluid pressure–high stress failure also provides a basis for the development of axial plane veins, melt segregations and various classes of breccias. There is no clarity on where the most complex geology paradigm for exploration originated. David Groves (1980s onwards) actively promoted the concept on industry-supported projects. Vearncombe (Citation1998) and Tripp and Vearncombe (Citation2004) advanced the methodology in a semi-quantitative manner but did not originate it.
Greenfields and brownfields exploration
The biennial series NewGenGold conference papers reveal that despite structure being the principal control on gold mineralisation, for greenfields exploration it has been a subordinate to the geochemical sampling of regolith and drainage sediment (Brown & Vearncombe, Citation2014; Yates, Citation1995, Citation1997, Citation1999, Citation2001, Citation2003, Citation2005, Citation2007, Citation2009, Citation2011, Citation2013, Citation2015, Citation2017, Citation2019, Citation2021). Data from geochemical sampling programs are rarely analysed with input structural geology. Of 154 case studies of successful gold exploration documented in the consistent series of biennial volumes NewGenGold from 1995 to 2013, surface and near-surface sampling (geochemistry) dominate early phases of exploration. Subsequently, as a second or third priority is drilling, initially rotary air blast or Air-Core and then reverse circulation and diamond core drilling dominate exploration. Structure is recorded as of use in only 53% of discoveries, mostly as third or fourth priority. Of the case studies, 16% make no mention of structure at all. It is surprising that when surface outcrop is available, structural geology is rarely documented as an exploration method but is keenly sought in areas lacking outcrop such as beneath (Western Australia) salt lakes.
There is common massive growth in mineral deposit endowment after mining has commenced, called brownfields exploration. In the period 1990s to today, brownfields exploration is shown to be critical. Vearncombe and Phillips (Citation2020) illustrate the importance of recent brownfields exploration comparing the gold endowments of established and new mines in the 1990s and their endowment growth over 20–30 years. Here, newly identified deposits from the NewGenGold first meeting (Yates, Citation1995) are compared with their 2017 deposit endowments, a period of 22 years (). shows a 1995 total of 29 million ounces that converts to a 2017 total endowment of 111 Moz making the brownfields growth about three times that of the greenfields find (endowment = known production + Indicated and Measured Resources + Reserves). While a small number of deposits fail to grow, a two- to threefold increase in size is common. This growth exceeds discovery at the greenfields stage.
Table 1. Critical comparison of deposits newly found in the period 1992–1995 and detailed (Yates, Citation1995) with their 2017 endowment (Phillips, Citation2017).
From greenfields to brownfields exploration, the change is from geochemistry and geophysics with minor drilling providing a poor indication of what the geology may be to one where the now accessible stratigraphy, lithology and structure are paramount. Importantly, as we could not have the brownfields growth without the initial find, there is no suggestion here that brownfields should replace greenfields exploration. Many finds grow significantly after mining has commenced. With social licence, infrastructure and contracts in place, a brownfields addition is commonly magnitudes more beneficial than any discovery made in greenfields.
New status of structure
The past 5 years have seen a change in industry’s attitude to structural geology and specifically the role of computerised 3D models. As recently as 2017, statements made at the (greenfields) NewGenGold exploration meeting by presenters, all successful senior managers or directors, gave an old fashioned and negative impression: ‘one pair of eyes’, ‘hand-drawn graphic logs’, ‘paper cross-sections’, ‘too many computers’, ‘boots-on-ground’ and ‘old school geology’. At the same meeting just 2 years later in 2019, a paradigm shift was conspicuous, and geophysics and structural geology emerge as early priority exploration tools. For example, Campbell et al. (Citation2019) on a project in NW Canada describe structure as a direct targeting tool. In the 2021 series meeting (Yates, Citation2021), structural geology is ascribed as central to the process of exploration at Cayley Lode, Victoria (Cairns, Citation2021), Koné, Cote D’Ivoire (Stuart et al., Citation2021), Wharekirauponga (a Waihi extension, New Zealand; Torckler et al., Citation2021), Fenix, Chile (Garay, Citation2021), Winu-Ngapakarra, Western Australia (Dalstra et al., Citation2021), and Bankan, Guinea (Roberts et al., Citation2021). Most importantly, criticism of computers and modern technologies is now absent, and 3D geology computer modelling has come of age. No longer are computers a distraction from basic geology; they have become the tool that demands and illustrates structural geology. Three-dimensional models portrayed in short movies are now the essential communication tool to geochemists, directors, investors and engineers who may know little about geology.
Additionally, structural geology is no longer a one-off report by a consultant but an ongoing (daily) collection of basic data that may be viewed, compiled, integrated and modelled in 3D using computer programs such as Leapfrog and Vulcan. Technologies that as recently as 2017 were seen as a distraction are now seen to encourage quality science, and every mine site uses them. The above evolution has driven several managerial developments, most important of which is that almost all companies now employ a structural geologist or teams of structural geologists in house. Brownfield Resource growth has been impressive and a direct consequence of data integration with geological understanding, especially structure.
Data volumes are now massive, with mining companies at the fore of Big Data. Geological datasets are more complex than those for many industries because of the 3D coordination of data. Now data volumes are such that non-traditional data such as single column grade data may be analysed structurally as Local Varying Anisotropies (LVAs) (Cowan, Citation2022; Reid & Cowan, Citation2023). The approach is to apply structural analysis to assay data and focus on the whole of deposit patterns.
Structural practice
What type of structural geology do we need?
Structure is the primary control on many deposits, including orogenic gold deposits. Here, I emphasise a single critical observation from Western Australia gold deposits; a similar observation was made by Newhouse (Citation1940) from deposits in the Americas. Simply, when we have the information to determine the motion on the ore-bearing structure, it is typically small, measured in metres (; ). There may be exceptions and a caveat for deposits where we cannot determine displacement such as those at amphibolite facies at Southern Cross including nearby Yilgarn Star. To find, assess and mine ore, structural geology needs to be accurate at the metre scale. Interestingly, this is exactly the scale at which mines operate, but predominantly geological surveys and research organisations work at a more regional scale (sometimes stipulated at 1:250 000 or 1:100 000) and academia commonly at much finer scales examining detail with scanning, analytical and microscopic viewers.
Figure 7. Yilgarn gold deposits with location of deposits mentioned in . Shown are gold mines mentioned in text. In italics, Golden Grove is a base metal mine with gold credits.
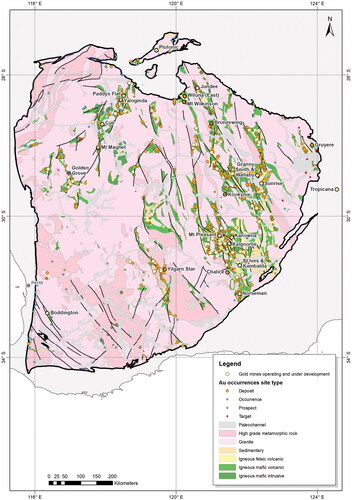
Table 2. Displacement on gold-hosting structures, Western Australia.
Oblique grids
At an early stage of exploration and a common legacy of pre-digital exploration (before the year 2000), grids were commonly oriented along the known strata with crosslines orthogonal to strike. An initial grid oblique to True North was established to aid communication among a small team working on the ground without modern tools, but the initial grid becomes a controlling factor and is difficult to change. Even when mineralisation is found at a high angle to the grid, the grid is not changed. Numerous problems arise with grids. For grids at a small angle (< ±10°) from True North, mistakes can be made with the choice of adding or subtracting the difference. Grids established on one tenement may be at a different angle to those on adjacent tenements, causing problems if the tenements are subsequently consolidated. Grids at >45° (and it happens) result in confusion just knowing which is north and east.
The problem with oblique grids is that they hinder, not help, communication in the long term. It is ironic that some big companies forcing universal rock, alteration and structure codes across their global operations allow the continuation of oblique mine grids when these hinder communication, especially on how mine geology informs to regional exploration geology.
I recommend the Universal Transverse Mercator grid known in Australia as GDA 2020. Modestly priced GPS and mobile telephone applications provide easily used global positioning to a scale commonly much better than ±5 m. Local and oblique grids are no longer required for surveying purposes. Structural readings should be taken and recorded relative to True North. In Western Australia, this is more or less the same as Magnetic North and GDA2020. For communication, maps will always have True North straight up the page (excepting when faithfully re-producing historical materials as with Conolly and McKinstry, the originators in and ).
Modern 3D software helps volumetric thinking and communication
Modern 3D data-manipulation software helps with 3D thinking. Data can now be displayed, colour coded, rotated, analysed and modelled in 3D (Reid & Cowan, Citation2023). Most extensively used, perhaps because it does not require specialist training, is Leapfrog, but this is not the only one. Some in the industry believe the cognitive 3D thinking problem has been solved by computerisation, but others close to the development of 3D computer-visualisation programs argue this is an illusion (Reid, Citation2020; Reid & Cowan, Citation2019; Sullivan, Citation2022). Modern 3D computer visualisation helps with volumetric thinking, and indirectly may assist with disembodying, dynamic reasoning and scaling, but just because we can quickly model objects does not mean that these models are correct (Sullivan, Citation2021). Modelling Resources blind and failing to match mineral deposit geometry with structural architecture are regrettably too common. Computer models are just that: models. They are a hypothesis to be veracity-tested against all observations and especially new data. It remains for experienced geologists with 3D cognitive ability to design the critical tests for models.
Structure from drill core
Perhaps most discussed (formally and informally) is the logging of structures observed in diamond drill core from oriented inclined holes. The process is an extraction of structural data from core in a pipeline of iterative steps, most of which are the simple application of trigonometry and undergraduate-level structural geology. This is about dip and strike, direction and plunge, and simple stereonet plots. These are the subject of ongoing conversation and endless training on most exploration and mine sites. Structure core-logging is incorrectly perceived as the junior job, but it requires the geologist to have both remembered and understood their undergraduate structural geology. Procedures and tools are detailed in commercial product brochures and on widget supplier websites, and are reviewed in several publications (Bernhard et al., Citation2020; Bright et al., Citation2014; Davis, Citation2014; Marjoribanks, Citation1997; Orpen & Orpen, Citation2020; Vearncombe & Vearncombe, Citation1998). Procedural pipeline and potential for a small early error may invalidate subsequent data, and in addition to the structure log, a company should also keep a metre-by-metre log of QA/QC procedures (Myers et al., Citation2016). Blackbourn (Citation2009) presents a complementary study of core orientation and logging procedures in the petroleum industry, including commentary on the orientation measurement of structures in vertical drill holes.
Over the past 30 years, several methods have been developed to record the orientation bottom (or top) of the 6 m (in places 3 m) length of angled drill core, complementing the precise downhole survey data (Bright et al., Citation2014). The spear method, a wax crayon dropped gently onto the stub before the next length is drilled, records the bottom of the drilled ellipse, and the wax crayon mark is examined once the next drill run is brought to the surface. Great care is needed in dropping the spear, and the method is rarely more than 50% effective. Using the down-gravity vector, there are now quality digital tools that record core orientation. Although the digital tools can be fiddly and involve up-front costs, these are fitted in the drill string and save on drillers’ time. Taking the downhole survey and piecing together the core are the jobs of a geologist (perhaps an experienced senior field assistant). It can be laborious, but only coherent and oriented core should be labelled as such. The core is labelled with a solid line in permanent marker ink, and an arrow indicates the downhole. Companies mark either the bottom (∼80% companies) or the top of core (∼20%); it does not matter which, so long as there is site consistency. Poor unoriented core is marked with a dashed line and not used for structure readings.
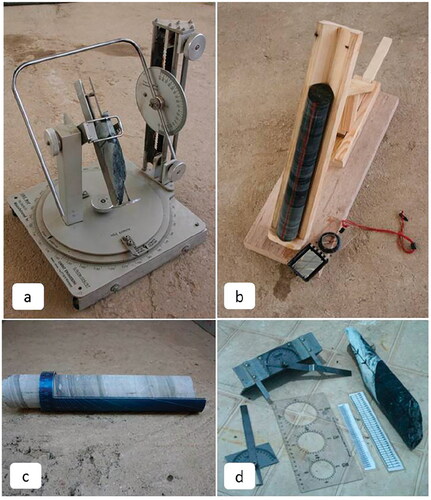
The measuring of the structures in core can be performed in several ways using different tools. The simplest are frames set up to physically orient the core as drilled. From this, dip and strike of planar features and the plunge and direction of linear features are measured. The frame may be the precisely engineered Coremap (), or a compass-clinometer reading as if a field outcrop on a lower-cost wood frame, often called a rocket launcher (). The other popular method involves recording the angle α of the core axis with the plane of the feature being measured and the β measured between the bottom (or top) core orientation reference and the turning point of the ellipse made by the planar feature (). See Marjoribanks (Citation1997) for detail. Converting α and β to dip and strike requires for each reading one of: (1) the plotting of a stereonet and rotations on small circles by the declination of the drill hole, (2) the use of complex trigonometry in Excel or (3) a specialist computer program such as DIPS or ioGAS to convert the α and β readings to dip and strike. (Obviously, the detail of the method differs depending on whether the reference line is the top of the core or the bottom of the core.)
Figure 8. Core structure measuring devices discussed here. (a) The Coremap™ device, a precisely engineered frame to set for direction and inclination of drill core and viewing frame to record planar dip and strike or linear plunge and direction; (b) a simple low-cost frame oriented in the direction of drilling with brass hinge to adjust for hole inclination; (c) the most popular, modest-cost method, the Kenometer, involves the recording of angle α of the core axis with the plane of the feature being measured and β measured between the core orientation reference line and the turning point of the ellipse made by the planar feature; and (d) low cost protractors for α and β measurement using core wrap around. (a) to (d) from Bright et al. (Citation2014).
In core logging, most important is the correct naming of the structural element measured and consistency of use. This can be difficult to maintain on a large mine site with numerous junior staff and with fly-in/fly-out rosters. The collection of data is fraught with QA/QC issues, but a guarantee of quality is the daily input of these data to 2D plans and cross-sections, and in 3D imagery of the geology and mineralisation for critical analysis.
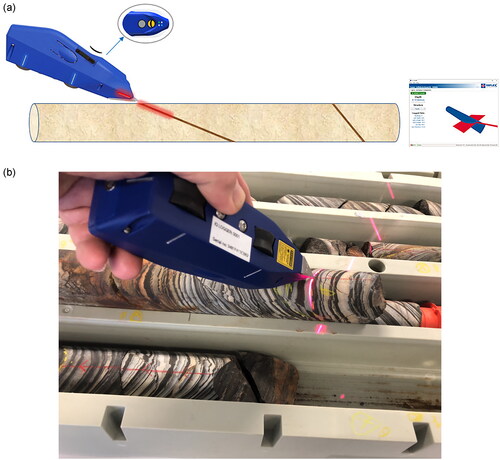
Imdex (Reflex) have developed the digital IQ-LOGGER™ for structural drill core (). The tool links via Bluetooth to a nearby (rugged) computer, and readings convert more or less immediately into equal angle (Wulff) plots. The mouse-like tool in IQ-LOGGER includes a gyroscope that is stabilised before use, and downhole depth is guided along the core orientation line with tracking wheels. The device can be held at any orientation to take measurements using a laser light oriented to match the elliptical arc of a planar feature in the drill core and lineations on the core stub (Reflex IQ-LOGGER, Citation2018). Logging can be without removing the core from the tray, but this is omitting 50% of valuable visualisation. If the marker line is the bottom of the core, the readings are taken upside down and corrected in the computer. The method works with half core (so long as the orientation line is preserved) and is adapted for lineations on the core stubs and structural elements running down-core parallel to the drilling direction. Anecdotally, the tool appears more accurate than the Kenometer, avoiding errors in picking the ellipse turning point for the β angle. The structural element is entered by the geologist using pre-set codes on the computer and data transferred to functions in the same suppliers ioGAS software. The tool is faster than other methods, but speed is rarely important and may be at the expense of scaling, dynamic reasoning and disembodying. The attached software takes readings into stereonets, and 3D computer visualisation is regularly achieved within an hour of the readings being taken. Anecdotally, this encourages volumetric thinking. There remains no digital mechanism to provide consistency of naming nor a check of the coding of the structural elements.
Figure 9. (a) Illustration of structure core logging using the IQ-LOGGER tracking down hole, stopping at a planar element to be measured and then matching the element and laser light recording ordination that is blue-toothed to computer software. The bottom of the core is down hole to the right. The computer-illustrated blue cylinder is down hole to the left with the bottom of the core still at the top. (b) Photograph of IQ-LOGGER in use. As an aside, this photograph illustrates disembodying issues in drill core. The user is measuring the obvious primary banding that will be already overrepresented in the company database. The feature that needs to be measured and possibly the control on mineralisation are the cross-faults displacing the banding and of multiple different orientations that seek understanding. Acknowledgement: Steve Sugden, Sara Sulway and Imdex.
Computer codes for structural elements need to be synoptic, not jumbling elements of different origins or geometric meaning. Imprecise terms like foliation, shear and lineation are to be avoided. We need to distinguish slaty cleavage from schistosity, ductile extensional shear bands from oblique failure cracks and penetrative lineations from discrete fault-surface fibres. Far too many sites have separate codes for foliation and schistosity, but with few on site aware of the difference; foliation is the collective noun for a variety of deformation fabrics. Almost certainly, any site with more than 12 structural element codes will have duplication and overlap rendering data poor to invalid. Similarly, a site without codes for linear data is missing an opportunity. No two ore bodies are identical; hence codes should be site-specific. Above all, they should be designed by the geologists for practical use in the field, at the drill rig and core yard, not for the convenience of a database.
Many exploration and mining packages now include stereonet software, and some including Leapfrog have down drillhole viewing with oriented plates representing the structural elements. Other programs, some with long-established stereonet capability, include Datashed, Micromine, Vulcan and an extension in Qgis. Stereonet software without 3D mining functions such as DIPS and GEOrient remain popular for ease of use.
Lineations
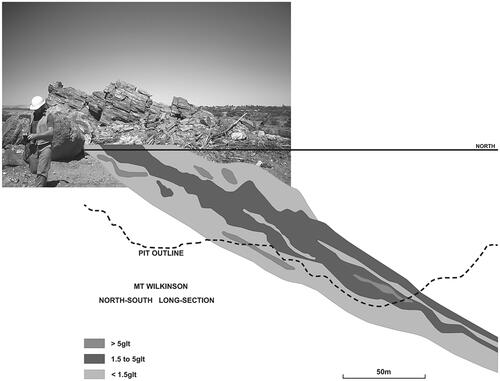
Lineations matter because in ductile and semi-ductile deformations, ore bodies plunge down the lineation. These may be intersection lineations as at Kalgoorlie’s Golden Mile, where the high-grade ruler-shapes, such as the Oroya Shoot, are at the intersection of shear zones with the carbonaceous–metasedimentary rocks between the lower Paringa Basalt and overlying Golden Mile Dolerite. Mineral elongations (including pencil lineations) control ore, classic examples being the ruler-shaped gold lode at Challenger South Australia and Mt Wilkinson (Matilda) west Wiluna ().
Figure 10. Ruler-shaped lode plunging down a mineral lineation, Mt Wilkinson (Matilda) on the ductile west side at Wiluna. The pencil lineation prominent in saprolite after chlorite–actinolite schist adjacent to the ore zone is repeated in the shape of the ore zone.
In the brittle upper-crust ore, shoots may be orthogonal to the mineral growth lineation and movement direction (e.g. east Wiluna; Hagemann et al., Citation1992).
Adapted for lineations, a theoretical variant of the α – β method is the cumbersome γ – δ method (see in Marjoribanks, Citation1997). Except in demonstrations, this author has not seen the method actively used on exploration or mine sites. Lineations are too rarely collected, and this most powerful source of value-generating data omitted. This is a direct consequence of the popularity of the core protractor α – β method. Managers should require the identification, description and measurement of lineations using a core frame if necessary ().
Geologist(s) who collect data should also enter, compile, integrate, plot, interpret and report
Structural geology is a central part of all exploration from the earliest targeting to mining. It should never be delayed and never set aside. Unlike geochemistry and geophysics data, it is difficult to achieve an interpretation if not involved in data collection. Critically, it is not just the alpha-numeric data collected but the embedded knowledge brought by someone who has seen the rocks, pictures the issues related to them and has a feel for the limits of the data. While column and row data are important, without understanding the 3D geology they are just numbers and letters. To best use embedded knowledge, the geologist who took the readings should also perform data entry and all modelling, and be presenting results to management and directors. Workflows, hierarchy charts and similar boxing of people and tasks are common in large mining companies, but whenever we see success, it is driven by identifiable holistic individuals, acknowledging that they may be using team data.
New technology
Inevitably, there are a wide range of new technology tools to assist structure in regional exploration, drilling and mining. Worldwide there are entrepreneurs developing tools to improve data collection and handling, and there is no possibility this section can fairly cover them all. By way of illustration, I discuss below just two broad categories, 3D hard-rock seismic and scanning downhole or core.
Two- and three-dimensional hard-rock seismic enables a view of the subsurface geology, and interpretation is enhanced with automated fault-tracking tools (Marsh et al., Citation2022). Seismic technologies are associated with some major gold resource additions around Kalgoorlie. Most importantly, the method provides a deep view of the geology that may be compared critically with map and the known near-surface geology.
There are now a dozen or more scanning tools that provide rapid and continuous data collection. They operate downhole or on core trays that may partly replace and/or verify some logging procedures. On site, these are commonly popular because of the continuous data collection. Inevitably, marketed as a simple solution to drilling and core yard issues, it is important to know the advantages and disadvantages for each technology. While perhaps technology solving for one of the cognitive skills, does the technology help or hinder the other cognitive skills, disembedding, volumetric thinking, dynamic reasoning and scaling? Does the technology help in picking the structural elements that inform in preference to the visually dominant element? Does the technology document lineations?
Deliverable
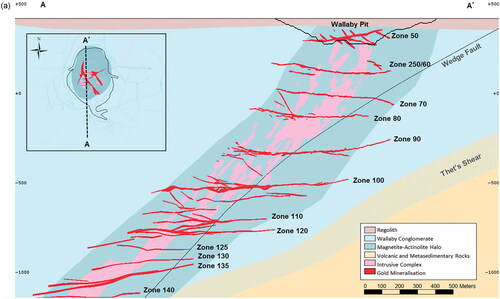
Many structure deliverables and specifically stereonets are meaningless to many colleagues (including some geology colleagues). Stereonets are an essential tool, and with the right data and plotted correctly, they yield the detail required for drill hole design and mine planning. Stereonets are not the deliverable beyond a small technically able group who require pictures of the mineralisation and geology, and their relationship to mine openings and infrastructure (existing and planned). These may be with or without drill details such as hole trace, downhole geology and assays. The pictures may be in 2D or 3D and may be hand-drawn or computer-generated (). The figures in Reid and Cowan (Citation2023) pictorialise computer-generated linkage between known geology, interpreted geology, drilling, assays and Resource blocks.
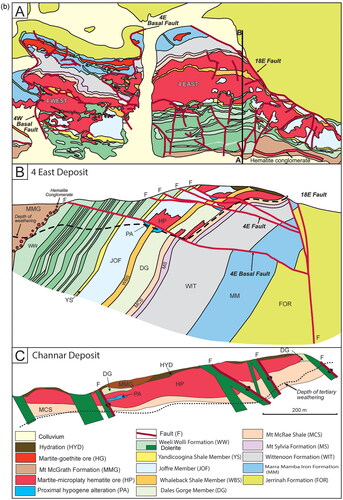
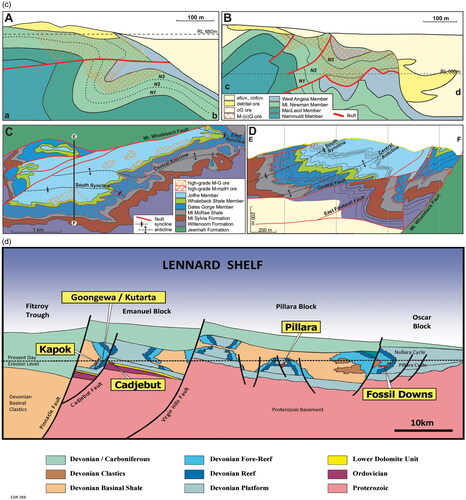
Figure 11. Four examples of 2D pictures that each tell the story. Published diagrams showing the relationships of geology, structure and mineralisation of gold, iron ore and lead–zinc deposits in Western Australia, all from the AusIMM Monograph 32 on Australian Ore Deposits (Phillips, Citation2017). (a) N–S cross-section of the Wallaby gold deposits looking west, showing recumbent quartz–gold zones in syenite intrusive into conglomerate and surrounding alteration halo (Tully et al., Citation2017). (b) Geology of the Greater Paraburdoo iron deposits: (A) plan with stratigraphy, structures and mineralisation types; (B) section A–B through the 4East deposit with structure controls on iron ore distribution and hydrothermal alteration zones (Thorne et al., Citation2017). (c) Geological cross-sections of iron ore deposits in the east Hamersley Basin, (A) Mining Area C, (B) Hope Downs South deposit, (C) geological map of Mt Whaleback ore body and (D) cross-section through C left. M, martite; mplH, microplaty hematite; (o)G, ochreous goethite (Angerer et al., Citation2017). (d) Schematic SE–NW cross-section of the Paleozoic Lennard Shelf showing the district-scale structural and stratigraphic setting of the principal Zn–Pb MVT deposits (Reynolds & Copp, Citation2017).
There is of course another deliverable management, the board of directors and investors want! This is a new deposit, a new ore zone, a quality pit design, pit walls that do not slip, a safe workplace and improved reconciliations. These are all best delivered with an explanation in pictures of how structural geology contributed to the success.
Resource evaluation
Resource evaluation is about taking a necessarily tiny data set (typically drill hole assays) and adding geological knowledge to assess the economic merit of deposits and mineralised zones. This is the rock equivalent of financial accounting. Resource evaluation defines the boundaries of the economic zones in a model of geometric domains (requiring geology, mine design, commodity price and cost inputs) and distributes grade and, as necessary, contaminants within these domain volumes from rare input. Commonly only 0.01–0.001% has been sampled by drilling. (It is a useful site exercise to calculate the percentage knowledge from drilling to understand the risk/reward context in the interpolation of data.) Miller (Citation2022) discusses methods to determine which structures, specifically faults, are material in a Resource evaluation. Importantly, modelling is not limited to the ore but includes marginal and waste materials, and their impact on project value. The financial viability of the project is assessed based on a wide variety of inputs, some of which are social licence, government regulation, geography, mining, infrastructure, processing, employment, environment, sovereign risk and the impact of commodity price variations (these can be −40% to +200% over a matter of just months, sometimes −80% to +400% over a year).
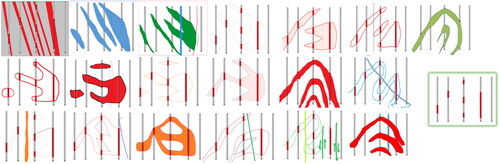
There is a standing joke in Perth (Western Australia) that independent Resource consultants prior to conducting a Resource assessment demand geology endlessly. Then they ignore it! This telling half-truth acknowledges the importance of geology providing guidance and veracity to the critical process of data validation, sometimes the poor quality of computer data and sometimes the failure to integrate geology in the process of resource modelling. Explicit and implicit modelled shapes are constrained with geology and grade statistics, but as models they are synoptic and improved by the inclusion of necessary detail and the omission of distractive material. shows the frightening variety of computer interpretations that may be placed on a simplistic 2D section of five (vertical) drill holes with two different rock types (Sullivan, Citation2021). As always, the solution is structural detail, especially the dip and strike of contacts. The model shapes are theories (hypotheses) to be tested against geological data and new experiments (commonly new drill holes), and should be modified in an iterative manner as necessary and rejected when wrong. See Vann and Stewart (Citation2011) for a philosophy of science in the resource industry, importantly about posing science questions that are in principle falsifiable.
Figure 12. Cross-sections of geological interpretations from a single hypothetical section of five drill holes (lower right) (Sullivan, Citation2021).
Too often, there is a disconnect between the geology and the Resource sections of technical reports, and there have been some serious mistakes (euphemistically called downgrades) commonly unfairly blamed on the modelling software (Reid, Citation2020, Reid & Cowan, Citation2023). An issue is the lack of investment in training in the generation of implicit modelling algorithms to match local geology. While structural geology is variably used to define domain boundaries, it is too rarely used in the process of distributing grade through mine blocks. While Resource evaluation software is rich in geostatistical options and functions, these packages are largely devoid of tools enabling the input of structural geology to Resource evaluation. Today, grade is distributed within domains by spatial-statistical techniques, but statistics is the science that describes a population, whereas in mining and exploration, we consistently seek the rich outliers.
Variography is a spatial–statistical tool using pairs of data to define nugget, sill and range that feeds kriging in distributing model grade across mine blocks. The method is always data-hungry and exacerbated if the analysis is performed correctly to record anisotropy using angled data windows; commonly 15 or 20 degree windows lack fidelity (Coombes, Citation2008). A large amount of variography literature deals with model solutions (assumed distributions: exponential, spherical or Gaussian) pseudo-solving for the paucity of input data. Variography is a neat statistical tool handling grade data, but it loses geometric quality.
Without the constraint of paired data, Ord and Hobbs (Citation2022) build on their research into disequilibrium processes yielding nonlinear data. From one drill hole used as a training set, they predict gold in extensions to that hole using Takens’ theorem. The importance of structural geology in exploration and mining is recognised widely, but we lack the tools and enterprise to maximise structure in Resource and Reserve evaluation. Academic research is needed to analyse grade data structurally, to input structural data, observed geometric patterns and rock anisotropy to Resource evaluations. Research covering a gamut of mathematical disciplines is needed to develop ways to better distribute grade (and contaminants) through models in structurally realistic 3D. Ore deposits such as orogenic Archean gold show strong anisotropy where differences of less than one degree matter. The anisotropy is scale-dependent, best described in locally moving windows (LVA) and rarely smooth. Typically, the anisotropy is multidirectional owing to cross-cutting and intersecting features that may be periodic. It cannot be described in a simple ellipsoid. Anisotropy varies with grade and spatial range.
Bi-directional relationships
The bulk of exploration and mine geologists are young university graduates with a first-degree qualification in geology or similar. From the commencement of an exploration project and in the daily needs of mining, the requirement is one or more competent structural geologists in each team. Daily they are measuring, plotting and presenting visual information on the exploration target. Daily, mine geologists map rocks (surface and underground) and log drill core recording structural data systematically. There are few other professions except medicine where what is traditionally taught at university so closely matches what is required in industry: basic geology but increasingly young geology graduates lack adequate field skills, and many appear to have not completed a truly independent mapping project of length typically 6 weeks. Structural geology should be central to all geology qualifications. Structure, and kindred topics fieldwork and 3D computer modelling, should be obligatory in a geology degree and taught from first year through to post-graduate to all geology students.
Summary
Structural geology is central to exploration and mining. We need structure to:
Synthesise and understand geology for exploration potential.
Decide which tenements to acquire and which to drop.
Design a drill hole and drill programs.
Interpret the results of drilling.
Use minor structures to show orientation of ore shoots.
Convert exploration results (mostly drilling) into 2D shapes on cross-section, long-sections and maps.
Convert results into 3D volumes that define ore, mineralised waste and waste.
Interpolate to distribute grade throughout an ore envelope and in ore zones, but this is the area of weakness needing significant academic and industrial research.
Evaluate the viability for mining and financial return.
Design safe and economic stopes and mine access.
Daily map a mine face to decide where to progress a drive or cut.
For safety, monitor open pit walls and underground openings for rockslide and rockfall risks.
Reconcile predicted vs actual results in mining.
Perhaps the only area of resource management in which structural geology is not central is in mine closure, but here it can be relevant in understanding ground water flow, acid-mine drainage and the stability of legacy workings, tailings dams and mullock dumps.
Acknowledgements
This paper started as an overview of Structure and Resources, but a significant part of my career has been spent not doing Structure and Resources, rather persuading others to do Structure and Resources (this the burden of managers and directors), hence the managerial content of this paper. Hundreds of colleagues most unknowingly have influenced the science and managerial axioms promoted here. Specifically, Sian Bright, Graham Conner, Jun Cowan, Neil Phillips, Ron Reid, Steve Sugden, Gerard Tripp, Susan Vearncombe and Mario Zelic have argued saying when I am wrong! For commenting on early text, I thank Gerard Tripp, Steve Sullivan, Alison Ord, Bruce Hobbs and Jun Cowan. For help with figures, I appreciate the assistance and openness of the AusIMM, Thomas Angerer, Kristy Burt, Steve McCourt, Neil Phillips, Neal Reynolds, Steve Sugden, Sara Sulway, Warren Thorne, Gerard Tripp and Richard Tully and Society of Economic Geologists, Alice Bouley, Julie Kelly, Lyall Harris and Steven Sullivan. COVID-19 lockdowns provided an authoritarian but peaceful environment to expedite this paper. Journal reviews by Neil Phillips, Tom Blenkinsop and an anonymous reviewer were great and improved the clarity of presentation.
Disclosure statement
Entities associated with the author hold shares, options and performance rights in exchange-listed and private mining companies. The author has an ongoing commercial interest in the Coremap™ device.
References
- ABARES. (2016). https://www.agriculture.gov.au/sites/default/files/abares/aclump/documents/Land use in Australia at a glance 2016.pdf
- Angerer, T., Hagemann, S. G., Lascelles, D., & Reichardt, H. (2017). BIF-hosted high-grade iron ore deposits in the eastern Hamersley Province. In G. N. Phillips (Ed.), Australian Ore deposits (pp. 369–374). Australasian Institute of Mining Metallurgy, Monograph. 32.
- Archaean Gold: Barberton Centenary Symposium. (1984). Programme. Barberton Mountain Land Branch (pp. 20). Geological Society of South Africa.
- Bernhard, J. K., Barnett, W., Uken, R., & Myers, R. (2020). Structural analysis of drill core for mineral exploration and mining: Review and workflow toward domain-based 3D interpretation. In J. V. Rowland & D. A. Rhys (Eds.), Applied structural geology of ore-forming hydrothermal systems. Society of Economic Geologists, Reviews in Economic Geology 21. https://doi.org/10.5382/rev.21.07
- Blackbourn, G. A. (2009). Core and core logging for geoscientists (p. 152). Whittles Publishing.
- Brown, L., & Vearncombe, J. R. (2014). Critical analysis of successful gold exploration methods. Applied Earth Science, 123(1), 18–24. https://doi.org/10.1179/1743275814Y.0000000050
- Bright, S., Conner, G., Turner, A., & Vearncombe, J. R. (2014). Drill core, structure and digital technologies. Applied Earth Science, 123(1), 47–68. https://doi.org/10.1179/1743275814Y.0000000051
- Business Insider. (2020). https://www.businessinsider.com.au/highest-paid-jobs-australia-2020-7
- Cairns, C. (2021). The Cayley Lode – 50 years of exploration before discovery. In K. Yates (Ed.), NewGenGold Abstracts 2021 (pp. 43–55). Paydirt Media.
- Campbell, J. D. (1958). En echelon folding. Economic Geology, 53(4), 448–472. https://doi.org/10.2113/gsecongeo.53.4.448
- Campbell, A., Gutsche, C., Maxwell, J., Lasanen, N., & Jones, S. (2019). The Black River project: Emergence of a new multimillion ounce BIF-hosted district in the Kitikmeot region of Nunavut, Canada. In K. Yates (Ed.), NewGenGold 2019 (pp. 127–142). Paydirt Media.
- CIMM, Canadian Institute of Mining and Metallurgy. (1948). Structural geology of Canadian Ore Deposits, A symposium arranged by a Committee of the Geology Division (p. 948). Canadian Institute of Mining and Metallurgy.
- CIMM, Canadian Institute of Mining and Metallurgy. (1957). Structural geology of Canadian Ore Deposits, A symposium arranged by a Committee of the Geology Division (p. 524). Canadian Institute of Mining and Metallurgy.
- Clout, J. M. F., (1990). Cleghorn, J. H., & Eaton, P. C. Geology of the Kalgoorlie goldfield. In F. E. Hughes (Ed.), Geology of the Mineral Deposits of Australia and Papua New Guinea (pp. 411–431). Australasian Institute Mining and Metallurgy Monograph 14.
- Cohen, C. A., & Hegarty, M. (2014). Visualizing cross sections: Training spatial thinking using interactive animations and virtual objects. Learning and Individual Differences, 33, 63–71. https://doi.org/10.1016/j.lindif.2014.04.002
- Conolly, H. J. C. (1936). A contour method of revealing some ore structures. Economic Geology, 31(3), 259–271. https://doi.org/10.2113/gsecongeo.31.3.259
- Colvine, A. C. (1989). An empirical model for the formation of Archean Gold Deposits: Products of final cratonization of the Superior Province, Canada. In R. R. Keays, W. R. H. Ramsay & D. I. Groves (Eds.), The geology of gold deposits: The perspective in 1988 (pp. 37–53). Economic Geology Monograph, 6. The Economic Geology Publishing Company.
- Coombes, J. (2008). The Art and Science of Resource Estimation; a practical guide for geologists and engineers (p. 231). Coombes Capability.
- Cowan, E. J. (2022). Structural analysis from drill hole assay data using locally varying anisotropies (LVA) – a catalyst for structural geological enlightenment?. In J. R. Vearncombe (Ed.). Structural geology and resources, Kalgoorlie 2022. (pp. 12–19). Australian Institute of Geoscientists 72.
- Dalstra, H., Black, A., Chembeya, E., Maguire, J., Ewington, D., Rayner, M., & Mudrovska, I. (2021). The Winu-Ngapakarra deposit in the Great Sandy Desert. In K. Yates (Ed.), NewGenGold Abstracts 2021 (pp. 129–143). Paydirt Media.
- Davis, B. K. (2014). Use and abuse of oriented drill core. Australasian Institute of Mining and Metallurgy Monograph, 30, 121–136.
- Department of Foreign Affairs and Trade (Australia Government). (2021). Trade and Investment at a Glance. https://www.dfat.gov.au/publications/trade-and-investment/trade-and-investment-glance-2021
- Fyfe, W. S. (1985). Fluids, tectonics and crustal deformation. Tectonophysics, 119(1–4), 29–36. https://doi.org/10.1016/0040-1951(85)90031-9
- Fyfe, W. S., & Kerrich, R. (1985). Fluids and thrusting. Chemical Geology, 49(1–3), 353–362. https://doi.org/10.1016/0009-2541(85)90167-6
- Gagnier, K. M., Shipley, T. M., Tikoff, B., Garnier, B. C., Ormand, C., Atit, K., & Resnick, I. (2016). Training spatial skills in geosciences: A review of tests and tools. In B. Krantz, C. Ormand & B. Freeman (Eds.), 3D structural interpretation (pp. 7–23). American Association Petroleum Geologists, Memoir 111. https://doi.org/10.1306/13561983M1113668
- Garay, E. (2021). Fenix Gold project; an Epithermal Gold Deposit in the Maricunga Belt. In K. Yates (Ed.), NewGenGold 2021 (pp. 119–127). Paydirt Media.
- Groves, D. I., & Phillips, G. N. (1987). The genesis and tectonic control om Archaean gold deposits of the Western Australia Shield – A metamorphic replacement model. Ore Geology Reviews, 2(4), 287–322. https://doi.org/10.1016/0169-1368(87)90009-6G
- Groves, D. I., Barley, M. E., & Ho, S. E. (1989). Nature, genesis, and tectonic setting of mesothermal gold mineralisation in the Yilgarn Block, Western Australia. In R. R. Keays, W. R. H. Ramsay & D. I. Groves (Eds.), The geology of gold deposits: The perspective in 1988 (pp. 54–70). Economic Geology Monograph, 6. The Economic Geology Publishing Company.
- Gustafson, J. K., Burrell, H. C., & Garretty, M. D. (1950). Geology of the Broken Hill Ore Deposit, Broken Hill, N.S.W., Australia. Geological Society of America Bulletin, 61(12), 1369–1438. https://doi.org/10.1130/0016-7606(1950)61[1369:GOTBHO]2.0.CO;2
- Hagemann, S. G., Groves, D. I., Ridley, J. R., & Vearncombe, J. R. (1992). The Archean lode gold deposits at Wiluna, Western Australia: High-level brittle-style mineralization in a strike-slip regime. Economic Geology, 87(4), 1022–1053. https://doi.org/10.2113/gsecongeo.87.4.1022
- Harris, L. B. (1987). A tectonic framework for the Western Australian Shield and its significance to gold mineralisation: A personal view. In S. E. Ho & D. I. Groves (Eds.), Recent advances in understanding precambrian gold deposits (Vol. 11, pp. 1–28). Geology Department and University Extension, University of Western Australia.
- Hobbs, B. E. (1966). The structural environment of the northern part of the Broken Hill orebody. Journal of the Geological Society of Australia, 13(2), 315–338. https://doi.org/10.1080/00167616608728616
- Hobbs, B. E., & Ord, A. (2022). Vein systems and fluid pressure distribution in mineralising systems, Implications for the fault value model. In J. R. Vearncombe (Ed.), Structural Geology and Resources, Kalgoorlie 2022 (pp. 35–37). Australian Institute of Geoscientists 72.
- Hobbs, B. E., Means, W. D., & Williams, P. F. (1976). An outline of structural geology (p. 571). Wiley.
- Hobbs, B. E., Ord, A., & Regenauer-Lieb, K. (2011). The thermodynamics of deformed metamorphic rocks: A review. Journal of Structural Geology, 33(5), 758–818. https://doi.org/10.1016/j.jsg.2011.01.013
- Holyland, P. W., & Ojala, V. J. (1997). Computer-aided structural targeting in mineral exploration: Two-and three-dimensional stress mapping. Australian Journal of Earth Sciences, 44(4), 421–432. https://doi.org/10.1080/08120099708728323
- Hronsky, J. M. A. (2011). Self-organized critical systems and ore formation: The key to spatial targeting? Society of Economic Geology Newsletter, 84, 14–16.
- Hutchinson, R. W., & Burlington, J. L. (1984). Some broad characteristics of greenstone belt gold lodes. In R. P. Foster (Ed.), Gold 82: The geology, geochemistry and genesis of gold deposits (pp. 339–371). Balkema, Rotterdam.
- Isles, D., & Cunneen, P. (2015). From a mile to a chain: The story of aeromagnetics in the Yilgarn. In J. Bevan, M. Elias & J. R. Vearncombe (Eds.), Yilgarn retrospective, extended abstracts (pp. 34–38). AIG Bulletin 60.
- JORC, Joint Ore Reserves Committee. (2012). Code for reporting of Exploration Results. Mineral Resources & Ore Reserves (p. 44). JORC. http://www.jorc.org/docs/jorc_code_2012.pdf
- Keays, R. R., Ramsay, W. R. H., & Groves D. I., Eds. (1989). The geology of Gold deposits: The perspective in 1988. Economic Geology Monograph, 6. The Economic Geology Publishing Company.
- Kerrich, R., & Feng, R. (1992). Archean geodynamics and the Abitibi-Pontiac collision: Implications for advection of fluids at transpressive collisional boundaries and the origin of giant quartz vein systems. Earth-Science Reviews, 32(1–2), 33–60. https://doi.org/10.1016/0012-8252(92)90011-H
- Maiden, K. J., Chimimba, L. R., & Smalley, T. J. (1986). Cuspate ore-wall rock interfaces, piercement structures and the localization of some sulfide ores in deformed sulfide deposits. Economic Geology, 81(6), 1464–1472. https://doi.org/10.2113/gsecongeo.81.6.1464
- Marsh, T., Young, C., Turner, G., Kinkel, J., Smith, R., & Ziramov, S. (2022). Fast, objective, structural frameworks from 3D seismic data: Automated fault tracking tolls and their ability to map minerals system controls and post mineralisation structural offsets. In J. R. Vearncombe (compiler). Structural geology and resources (extended abstracts) (pp. 31–34). AIG Bulletin 72.
- Marshall, B., & Gilligan, L. B. (1989). Durchbewegung structure, piercement cusps, and piercement veins in massive sulfide deposits; formation and interpretation. Economic Geology, 84(8), 2311–2319. https://doi.org/10.2113/gsecongeo.84.8.2311
- Marjoribanks, R. W. (1997). Geological methods in mineral exploration and mining (2nd ed.). Springer.
- McClay, K. R. (1991). Deformation of stratiform Zn–Pb(–barite) deposits in the northern Canadian Cordillera. Ore Geology Reviews, 6(5), 435–462. https://doi.org/10.1016/0169-1368(91)90040-E
- McKinstry, H. E. (1948). Mining Geology (pp. 680). Prentice-Hall Inc.
- Miller, J. (2022). The challenge of defining what is a material structure in a resource model. In J. R. Vearncombe (compiler). Structural geology and resources (extended abstracts). (pp. 65–66). AIG Bulletin 72.
- Muehlhaus, H. B., Hobbs, B. E., Ord, A. (1991). Evolution of fractal geometries in deforming material. Rock Mechanics Proceedings of the 33rd U.S. Symposium, A A Balkema.
- Mueller, A. G. (2017). Mount Charlotte deposit, Kalgoorlie goldfield. In G. N. Phillips (Ed.), Australian ore deposits (pp. 195–198). Australian Institute of Mining Metallurgy, Monograph 32.
- Mueller, A. G., & Harris, L. B. (1987). An application of wrench tectonic models to mineralized structures in the Gold Mile district. In S. E. Ho & D. I. Groves (Eds.), Recent advances in understanding precambrian gold deposits (Vol. 11, pp. 97–108). Geology Department and University Extension, University of Western Australia.
- Myers, R., Brown, C., Meitl, L., Puchner, C., Schaefer, C., & Schneider, K. (2016). An Inexpensive way to maximize and preserve the value of oriented core: The Orientation Log. SEG Discovery, 107(107), 1–19. parts of https://doi.org/10.5382/SEGnews.2016-107.fea
- Newhouse, W. H. (1940). Opening due to movement along a curved or irregular fault plane. Economic Geology, 35(3), 445–464. https://doi.org/10.2113/GSECONGEO.35.3.445
- Newhouse, W. H. (Ed.) (1942). Ore deposits as related to structural features (p. 280). Princeton University Press.
- Newhouse, W. H., & Flaherty, G. F. (1930). The texture and origin of some banded or schistose sulphide ores. Economic Geology, 25(6), 600–620. https://doi.org/10.2113/gsecongeo.25.6.600
- Nutt, T. H. C., McCourt, S., & Vearncombe, J. R. (1987). Structure of some gold and antimony–gold deposits from the Kaapvaal and Zimbabwe Cratons. In S. E. Ho & D. I. Groves (Eds.), Recent advances in understanding precambrian gold deposits (Vol. 12, pp. 63–80). University of Western Australia.
- Ord, A., & Hobbs, B. (2022). Orogenic gold deposits as nonlinear systems: Nonlinear analysis of data. Ore Geology Reviews, 142, 104699. https://doi.org/10.1016/j.oregeorev.2022.104699
- Orion, N., Ben-Chaim, D., & Kali, Y. (1997). Relationship between earth science education and spatial visualization. Journal of Geoscience Education, 45(2), 129–132. https://doi.org/10.5408/1089-9995-45.2.129
- Orpen, J., & Orpen, D. (2020). Error-proofing diamond drilling and drillcore measurements. SEG Discovery, 123(123), 23–34. https://doi.org/10.5382/Geo-and-Mining-09
- Perring, C. (2015). A 3D geological and structural synthesis of the Leinster area of the Agnew–Wiluna Belt, Yilgarn Craton with special reference to the volcanogenic setting of komatiite-associated nickel sulfide deposits. Economic Geology, 110(2), 469–503. https://doi.org/10.2113/ECONGEO.110.2.469
- Phillips, G. N. (1993). Metamorphic fluids and gold. Mineralogical Magazine, 57, 365–374. https://doi.org/10.1180/minmag.1993.057.388.02
- Phillips, G. N. (2017). Gold in Australia. In G. N. Phillips (Ed.), Australian Ore deposits (pp. 75–82). Australasian Institute of Mining Metallurgy, Monograph 32.
- Phillips, G. N., Hergt, J., & Powell, R. (2017). Kalgoorlie goldfield – Petrology, alteration and mineralisation of the Golden Mile Dolerite. In G. N. Phillips (Ed.), Australian Ore Deposits (pp. 185–194). Australasian Institute of Mining Metallurgy, Monograph 32.
- Phillips, G. N., Vearncombe, J. R., Clemens, J. D., Day, A., Kisters, A. F. M., & Von der Heyden, B. (2023). Formation of Cu–Au porphyry deposits: Hydraulic quartz veins, magmatic processes and constraints from chlorine. Australian Journal of Earth Sciences, 70(7), 1010–1033. https://doi.org/10.1080/08120099.2023.2237105.
- Piquer, J., Sanchez-Alfaro, P., & Perez-Flores, P. (2021). A new model for the optional structural context for giant porphyry copper deposit formation. Geology, 49(5), 597–601. https://doi.org/10.1130/geol.s.13530653
- Pumpelly, R., Wolff, J. E., & Dale, T. N. (1894). Geology of the Green Mountains in Massachusetts (vol. 23, p. 206). United States Geological Survey Monograph.
- Ramsay, J. G. (1967). Folding and fracturing of rocks (p. 568). McGraw-Hill Book Company.
- Ramsay, J. G., & Graham, R. H. (1970). Strain variation in shear belts. Canadian Journal of Earth Sciences, 7(3), 786–813. https://doi.org/10.1139/e70-078
- Reed, M. R., Askew, J. E. (1984). Innovative aspects of mining at Mount Charlotte. In Proceedings Regional Conference on Gold Mining, Metallurgy and Geology (pp. 1–9). Australasian Institute of Mining and Metallurgy.
- Reflex IQ-LOGGER. (2018). User Guide, Software v1.2.1. Reflex IQ-LOGGER.
- Reynolds, N. A., & Copp, I. A. (2017). Zn–Pb–Ag deposits of the Lennard Shelf, Canning Basin. In G. N. Phillips (Ed.), Australian Ore Deposits (pp. 441–444). Australasian Institute of Mining Metallurgy, Monograph 32.
- Reid, R. (2020). Structural Geology – The missing skeleton in the Resource geology closet. In Mineral resource estimation: Recent advances and current best practice, virtual conference (p. 9). The Geological Society.
- Reid, R., & Cowan, E. J. (2019). Toward robust and reliable implicit geological models. Australian Institute of Mining Metallurgy. mininggeology.ausimm.com #mining geology2019
- Reid, R., & Cowan, J. (2023). Towards quantifying geological models for mineral resource estimation through outside-In deposit-scale structural analysis. Australian Journal of Earth Sciences, 70(7), 990–1009. https://doi.org/10.1080/08120099.2023.2217882
- Ridler, R. H. (1970). Relationship of mineralization to volcanic stratigraphy in the Kirkland–Larder Lakes area, Ontario. Geological Association Canada. Annual Meeting Proceedings, 21, 33–42.
- Ridley, J. R. (1993). The relations between mean rock and fluid flow in the rust: With reference to vein and lode-style gold deposits. Ore Geology Reviews, 8(1–2), 23–37. https://doi.org/10.1016/0169-1368(93)90026-U
- Ridley, J. R., & Mengler, F. (2000). Lithological and structural controls on the form and setting of vein stockwork orebodies at the Mount Charlotte gold ddeposit, Kalgoorlie. Economic Geology, 95(1), 85–98. https://doi.org/10.2113/gsecongeo.95.1.85
- Riedel, W. (1929). Zur mechanik geologischer brucherscheinungen. Zentralblatt Fur Mineralogie, Geologie Und Paleotologie B, 354–368.
- Robert, F., Paulsen, K. H., Cassidy, K. F., & Hodgson, C. J. (2005). Gold metallogeny of the Yilgarn and Superior Cratons. In J. W. Hedenquist, J. F. H. Thomson, R. J. Goldfarb & J. P. Richards (Eds.), Economic Geology 100th Anniversary Volume. (pp. 1001–1033). Society of Economic Geologists.
- Robert, F., & Poulsen, K. H. (2022). Practical structural implications of greenstone gold models. In J. R. Vearncombe (Ed.), Structural Geology and Resources (pp. 98–103). AIG Bulletin 72.
- Roberts, D. E., & Elias, M. (1990). Gold deposits of the Kambalda–St Ives region. In F. E. Hughes (Ed.), Geology of the Mineral Deposits of Australia and Papua New Guinea (pp. 479–492). Australasian Institute Mining and Metallurgy Monograph 14.
- Roberts, P., Murphy, F., & Nganare, A. (2021). The Bankan gold camp: A greenfields discovery in Guinea, West Africa. In K. Yates (Ed.), NewGenGold 2021 (pp. 209–221). Paydirt Media.
- Sangster, D. F. (Ed.) (1996). Carbonate-hosted Lead–Zinc Deposits (p. 664). Society of Economic Geologists Special Publication 4.
- Sibson, R. H. (1987). Earthquake rupturing as a hydrothermal mineralising agent. Geology, 15(8), 701–704. https://doi.org/10.1130/0091-7613(1987)15 < 701:ERAAMA>2.0.CO;2
- Sibson, R. H., Robert, F., & Poulsen, K. H. (1988). High-angle reverse faults, fluid-pressure cycling, and mesothermal gold–quartz deposits. Geology, 16(6), 551–555. https://doi.org/10.1130/0091-7613(1988)016 < 0551:HARFFP>2.3.CO;2
- Skarmeta, J. (2021). Structural controls on alteration stages at the Chuquicamata copper–molybdenum deposit Northern Chile. Economic Geology, 116(1), 1–28. https://doi.org/10.5382/econgeo.4769
- Skinner, B. J., & Barton, P. B. Jr. (1973). Genesis of mineral deposits. Annual Review of Earth and Planetary Sciences, 1(1), 183–211. https://doi.org/10.1146/annurev.ea.01.050173.001151
- Stuart, H., McDonnell, L., & Yapo, N. (2021). The Koné Golkd Prject, Cote D’Ivoire: Persistence pays off!. In K. Yates (Ed.), NewGenGold 2021 (pp. 43–55). Paydirt Media.
- Sullivan, S. (2021). Recognising the impact of uncertainty in resource models. In Proceedings of AEGC’s 3rd Australasian Exploration Geoscience Virtual Conference, 15–17th September 2021.
- Sullivan, S. (2022). Harnessing data complexity – How machine learning applies all project data for accurate resource modelling. International Mining Geology Conference 2022, 22–23 March, 1–13.
- Tarampi, M. R., Atit, K., Petcovic, H. L., Shipley, T. F., & Hagarty, M. (2016). Spatial skills in expert structural geologists. In B. Krantz, C. Ormand, & B. Freeman (Eds), 3D structural interpretation (pp. 65–73). American Association of Petroleum Geologists, Memoir. 111.
- Tchalenko, J. S. (1970). Similarities between shear zones of different magnitudes. Geological Society of America Bulletin, 81(6), 1625–1640. https://doi.org/10.1130/0016-7606%281970%2981%5B1625%3ASBSZOD%5D2.0.CO%3B2
- Thorne, W., Dalstra, H., Gordon, J., Paine, M., & Hagemann, S. G. (2017). Mt Tom Price, Paraburdoo and western Hamersley Iron ore deposits. In G. N. Phillips (Ed.), Australian Ore Deposits (pp. 363–368). Australasian Institute of Mining Metallurgy, Monograph 32.
- Thompson, M. J., Watchorn, R. B., Bonwick, C. M., Frewin, M. O., Goodgame, V. R., Pyle, M. J., & MacGeehan, P. J. (1990). Gold deposits of Hill 50 Gold Mine NL at Mount Magnet. In F. E. Hughes (Ed.), Geology of the Mineral Deposits of Australia and Papua New Guinea (pp. 221–241). Australasian Institute Mining and Metallurgy Monograph. 14.
- Titus, S., & Horsman, E. (2009). Characterising and improving spatial visualisation skills. Journal of Geoscience Education, 57(4), 242–254. https://doi.org/10.5408/1.3559671
- Torckler, L., Gardner, T., & Feebrey, C. (2021). Wharekiauponga: A low sulphidation epithermal gold–silver discovery in New Zealand. In K. Yates (Ed.), NewGenGold 2021 (pp. 105–116). Paydirt Media.
- Tripp, G. I., & Vearncombe, J. R. (2004). Fault/fracture density and mineralization: A contouring method for targeting in gold exploration. Journal of Structural Geology, 26(6-7), 1087–1108. https://doi.org/10.1016/j.jsg.2003.11.002
- Tripp, G. I., Tosdal, R. M., Blenkinsop, T., Rogers, J. R., & Halley, S. (2020). Neoarchean Eastern Goldfields of Western Australia. In R. H. Sillitoe, R. J. Goldfrab, F. Robert & S. F. Simmons (Eds.), Geology of the World’s Major Gold Deposits and Provinces (Chapter. 33, pp. 709–734). Society of Economic Geologists Special Publication 23. https://doi.org/10.5382/SP.23.33
- Tully, R. B., Platt, H. K., Chirnside, A. R., & Murray, A. L. (2017). Gold deposits of the Granny Smith – Wallaby district. In G. N. Phillips (Ed.), Australian Ore Deposits. (pp. 255–259) Australasian Institute of Mining Metallurgy. 32.
- Vann, J., & Stewart, M. (2011). Philosophy of science: A practical tool for applied geologists in the minerals industry. Applied Earth Science, 120(1), 21–30. https://doi.org/10.1179/1743275811Y.0000000018
- Vearncombe, J. R. (1998). Shear zones, fault networks and Archean gold. Geology, 26(9), 855–858. https://doi.org/10.1130/0091-7613%281998%29026%3C0855%3ASZFNAA%3E2.3.CO%3B2
- Vearncombe, J. R. (compiler) (2022). Structural Geology and Resources (extended abstracts) (p. 136). Australian Institute of Geoscientists 72.
- Vearncombe, J. R., & Hill, A. P. (1993). Strain and displacement in the Middle Vale Reef at Telfer, Western Australia. Ore Geology Reviews, 8(1–2), 189–202. https://doi.org/10.1016/0169-1368(93)90034-V
- Vearncombe, J. R., & Vearncombe, S. (1998). Structural data from drill core. In B. Davis & S. E. Ho (Eds.), More meaningful sampling in the mining industry (pp. 67–82). Australian Institute of Geoscientists, Bulletin 22.
- Vearncombe, J. R., & Zelic, M. (2015). Structural paradigms for Gold: Do they help us find and mine? Applied Earth Science, 124(1), 2–19. https://doi.org/10.1179/1743275815Y.0000000003
- Vearncombe, J. R., & Phillips, G. N. (2020). The importance of brownfields gold exploration. Mineralium Deposita, 55(2), 189–196. https://doi.org/10.1007/s00126-019-00897-1
- Vearncombe, S., Vearncombe, J. R., & Barley, M. E. (1998). Fault and stratigraphic controls on volcanogenic massive sulphide deposits in the Strelley Belt, Pilbara Craton, Western Australia. Precambrian Research, 88(1–4), 67–82. https://doi.org/10.1016/S0301-9268(97)00064-8
- Wood, B. J., & Walther, J. V. (1986). Fluid flow during metamorphism and its implications for fluid rock ratios. Springer-Verlag.
- Yates, K. (1995). New generation gold mines: Case histories of discovery (pp. 1.1–16.8). Australian Mineral Foundation.
- Yates, K. (1997). New generation gold mines: Case histories of discovery (pp. 1.1–16.0). Australian Mineral Foundation.
- Yates, K. (1999). New generation gold mines: Case histories of discovery. Australian Mineral Foundation.
- Yates, K. (2001). NewGenGold 2001 (p. 216). Australian Mineral Foundation.
- Yates, K. (2003). NewGenGold 2003 (p. 219). Australian Mineral Foundation.
- Yates, K. (2005). NewGenGold 2005 (p. 235). Australia’s Paydirt.
- Yates, K. (2007). NewGenGold 2007 (p. 186). Paydirt Media.
- Yates, K. (2009). NewGenGold 2009 (p. 242). Paydirt Media.
- Yates, K. (2011). NewGenGold 2011 (p. 250). Paydirt Media.
- Yates, K. (2013). NewGenGold 2013 (p. 282). Paydirt Media.
- Yates, K. (2015). NewGenGold 2015 (p. 290). Paydirt Media.
- Yates, K. (2017). NewGenGold 2017 (p. 295). Paydirt Media.
- Yates, K. (2019). NewGenGold 2019 (p. 251). Paydirt Media.
- Yates, K. (2021). NewGenGold 2021 (p. 230). Paydirt Media.