
 ?Mathematical formulae have been encoded as MathML and are displayed in this HTML version using MathJax in order to improve their display. Uncheck the box to turn MathJax off. This feature requires Javascript. Click on a formula to zoom.
ABSTRACT
Clinical relevance
The measurement and simulation of corneal and lenticular curvature radii using a single swept-source biometry device enables a more thorough evaluation of the shape and refractive power of the cornea and lens during emmetropization or myopia progression in children.
Background
This study aimed to evaluate the distribution characteristics of corneal and lenticular parameters in Chinese children with myopia and explored their association with other ocular components.
Methods
In this cross-sectional study, all ocular biometric parameters were measured using a Zeiss IOLMaster 700 Biometry. Simulations of the corneal and lenticular curvature radii were implemented using a customised MATLAB program based on cross-sectional swept-source optical coherence tomography images obtained from the same device. The associations of the calculated and simulated refractive powers of the cornea and lens with other ocular parameters were evaluated.
Results
In total, 119 children with myopia were recruited. Boys had a deeper anterior chamber and longer axial length (AL) than girls, while girls had steeper anterior corneal and lenticular curvatures and greater corneal and lenticular power. Children aged 10 years and older showed a larger anterior lenticular radius of curvature (sRal) and less lenticular power (PL,OCT) than younger participants. There was a significant positive correlation between AL and the anterior corneal radius of curvature, regardless of sex or age. The sRal exhibited a significant increasing trend, and PL,OCT exhibited a declining trend with a longer AL only in children younger than 10 years.
Conclusion
AL is the most influential factor in the determination of spherical equivalent refractive error, while decreases in both corneal and crystalline lens power are significantly inversely correlated with axial elongation.
Introduction
Ocular growth is dynamic from infancy to adulthood, with the cornea and crystalline lens being the two primary dioptric components responsible for compensating gradual axial elongation to maintain emmetropia.Citation1 The decoupling of the interplay by excessive eye growth or increased optical power leads to myopia, which has become the most prevalent refractive error condition in recent decades. If left uncorrected or with developing ocular complications, excessive eye growth could lead to severe visual impairment.Citation2 Hence, evaluation of the cornea and lens biometry of myopic eyes is important for understanding the underlying mechanisms of myopia and finding new strategies for myopia control.
Methods for measuring the optical power of the cornea and lens have been divided into two categories: (1) indirect calculation using other ocular component data instead of the cornea or lens variables; and (2) direct evaluation of both anterior and posterior curvatures, and an equivalent refractive index of the cornea or lens. Since the anterior radius of curvature of the cornea can be easily measured, corneal power can be indirectly calculated with an assumed fixed ratio between the radii of curvature of two corneal surfaces.Citation3 However, accurate measurement of the posterior corneal surface is essential for a better understanding of the contribution of corneal geometry to the optical changes that occur during myopia development. Regarding lenticular power measurement, the indirect calculation is unaffected by the shape and accommodation status of the lens,Citation4 while the use of other ocular components worsens the repeatability of the calculation and confounds the statistical analysis of the relationship between lens power and those components.Citation5
IOLMaster 700, the first swept-source biometry device, incorporates swept-source optical coherence tomography (SS-OCT) that enables 2000 A-scans per second for the full-eye length tomogram acquisition.Citation6 In the present study, one single OCT biometry device combined with a customised MATLAB program was used to thoroughly evaluate ocular parameters in children with myopia, including the radii of curvature and refractive power of the cornea and crystalline lens, and to explore their relationship with other ocular components, which could provide insights into the underlying compensatory changes of the cornea and crystalline lens during myopia progression.
Methods
Subjects and measurements
Participants were children aged 6–14 years, with cycloplegic spherical refractive error of ≤ −0.75 D, astigmatism of < −2.00 D and best-corrected visual acuity (BCVA) of logMAR 0.1 or better. The exclusion criteria were as follows: those with too flat (K < 40.00 D) or steep (K > 47.00 D) corneas; with ocular diseases (such as amblyopia, strabismus, glaucoma, cataract, and retinal diseases) or severe systemic diseases (for example, cardiac, nephroztic, and respiratory diseases); current or previous use of atropine or orthokeratology lenses. Written informed consent was obtained from the legal guardians of all enrollees, and written or verbal consent was obtained from each participant. This study was approved by the Ethics Committee of the Eye & ENT Hospital of Fudan University, and all procedures adhered to the tenets of the Declaration of Helsinki.
Before the measurement of the ocular biometry, each participant underwent a washout period of at least 10 minutes, during which any near tasks were avoided to minimise any impact from prior visual activities or the screening eye examination. All ocular biometric parameters were measured using the IOLMaster 700 (Carl Zeiss Meditec, Inc., Dublin, CA, USA) at 400 lux room illuminance before cycloplegia, including axial length (AL), anterior chamber depth (ACD), central corneal thickness (CCT), lens thickness (LT), horizontal (K1), and vertical (K2) corneal power. The average K (Km) was the mean of K1 and K2.
Cycloplegia was achieved with four drops of compound tropicamide eye drops (0.5% tropicamide and 0.5% phenylephrine eye drops; Mydrin-P, Santen Pharmaceutical, Shanghai, China) administered approximately 5 min apart. Cycloplegic retinoscopy was performed by an experienced optometrist 30 min after the last drop. BCVA was measured at a distance of 4 m and converted to the logarithm of the minimum angle of resolution (logMAR) scale.
Simulation and calculations
The radius of curvature of the anterior cornea surface (Rac) was calculated as follows:
The calculated corneal power (PC,GE) was according to a historical formula based on a single refracting surface cornea in the Gullstrand-Emsley eye model, with the refractive index of the aqueous and vitreous humours equal to 4/3:
The calculated lenticular power (PL,Bennett) was based on Bennett’s formula,Citation2 using direct measurements of SE, ACD, AL, LT, and Km, and two constants (c1 = 0.596, c2 = −0.358) estimated from the Gullstrand-Emsley eye model.
Scv was defined as spherical refraction at the corneal vertex. In addition, the ACD in this formula contained the CCT and the vitreous chamber depth (VCD) was calculated as follows:
The simulated corneal power (PC,OCT) and lens power (PL,OCT) were assumed using the Gullstrand-Emsley schematic values and curvature data obtained from a customised MATLAB program. The optical distortion due to the refraction of the anterior corneal surface was considered to be automatically corrected by built-in software of IOLMaster 700, as the image showing the corneal and lens boundaries automatically () and the image exported and further simulated () were found to be identical by image subtraction which yielded pixel values of only zeros.
Figure 1. A: One cross-sectional image of the eye obtained by the IOLMaster 700 showing the corneal and lens boundaries automatically, B: The same cross-sectional image of the eye exported and further simulated using a customised MATLAB program, C: Simulation of the radii of curvature of the cornea and lens with four curves generated and fitted with the edges of anterior and posterior surface of the cornea and the lens, respectively.
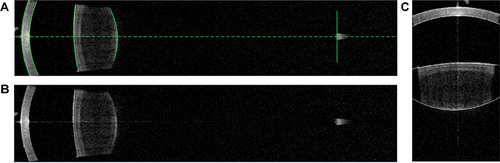
Six full-length cross-sectional images of the same eye at 30-degree intervals were obtained and transformed into a binary digital format which was defined as a two-dimensional function f(x,y). Four curves were generated, and two study-certified examiners manually changed the position and curvature of these curves by a fixed number of pixels to fit the edges of the cornea and the lenticular surface to the best sphere in a 6 mm diameter (). The coordinates of the vertices and curvatures of the curves were then outputted. The simulated radii of the posterior corneal curvature (sRpc), anterior lenticular surface (sRal), and posterior lenticular surface (sRpl) were converted with a conversion factor, which was calculated as Rac divided by the pixel of the simulated anterior corneal curvature.
PC,OCT was calculated using the Gaussian optics formula for thick lenses:
PL,OCT was calculated by:
where nair = 1, ncornea = 1.376, naqueous humour = nvitreous body = 1.333, and nlens = 1.427.
Statistical analysis
The right eye of each subject was enrolled and analysed. To evaluate the shape of the cornea and lens, anteroposterior ratios for the corneal curvature (C ratio) and lens curvature (L ratio) were calculated. The AL/Rac, AL/sRal, and PC,OCT/PL,OCT were included in the analysis as AL/Rac and AL/sRal indicate potential compensatory effects on the cornea or the crystalline lens, and PC,OCT/PL,OCT represents a refractive factor between the cornea and the lens.Citation7
Inter-observer agreement was determined using an intra-class correlation coefficient (ICC).Citation8 The agreement between the calculated and simulated refractive powers of the cornea and lens was tested using the Bland-Altman analysis.Citation9 The normality of all data sets was evaluated with the Shapiro-Wilk test, and parametric or non-parametric tests were then chosen based on the normality and variance of data distribution. A two-sample t-test or Mann-Whitney U test was used to test the differences in continuous data. The χ2 test and Fisher’s exact test were used to test for differences in categorical data.
One-way analysis of variance (ANOVA) followed by Tukey’s post-hoc test or Kruskal-Wallis test followed by Dunn’s post hoc test was performed to determine statistical differences between groups. Correlation analyses between measured, assumed, and calculated ocular parameters and several ratios were assessed using Pearson correlation or Spearman’s rank correlation. Subgroup analyses of univariate and multivariate regression were conducted by age and sex groups to examine the cornea and lens power-associated factors. Statistical significance was defined as 0.05 (2-tailed). All statistical tests were performed using SPSS software v.22 (IBM corp., Armonk, NY, USA).
Results
A total of 119 children with myopia (60 girls and 59 boys) were recruited for this study (). The distribution of SE was left-skewed (skewness = −1.05) with a median and interquartile range of −2.00 D and 1.50 D, respectively.
Table 1. Primary demographic and clinical characteristics of participants stratified by age and gender.
The overall ICC for all four simulated radii of curvature was 0.881, indicating a good agreement between the two observers. The mean measured Rac was 7.85 ± 0.21 mm, and the mean simulated sRpc, sRal, and sRpl were 7.02 ± 0.31, 13.15 ± 1.58, and 6.05 ± 0.31 mm, respectively (). The simulated and calculated refractive powers of the cornea were 41.89 ± 1.12 D and 42.46 ± 1.15 D, respectively. The lower and upper limit of agreement (LoA) was 0.12 D (95% confidence interval (CI) [0.05 D, 0.19 D]) and 1.01 D (95% CI [0.94 D, 1.08 D]), respectively, indicating that the values of the two methods were in good agreement (). For the lens, the simulated and calculated refractive powers were 22.56 ± 1.21 D and 23.48 ± 1.47 D, respectively. The 95% LoA was −1.75 D (95% CI [−2.17 D, −1.33 D]) to 3.59 D (95% CI [3.17 D, 4.01 D]), and the difference within ±1.0 D was only in 47.9% of the eyes ().
Figure 2. Bland-Altman plots show the differences between the calculated and simulated corneal power (Left plot) and the calculated and simulated lens power (Right plot). The mean of two values was plotted against the difference between two values (the mean difference is shown with the thick dashed line; the 95% limits of agreement are shown with the thin dotted lines).
Table 2. Measured, simulated and calculated parameters of the cornea and the lens of participants stratified by age and gender.
Certain correlations were observed within and between the measured and simulated parameters of the cornea and lens (). Rac was significantly positively correlated with LT (r = 0.234, P = 0.010), and negatively correlated with PL,OCT (r = −0.204, P = 0.026). sRpc was significantly positively correlated with LT (r = 0.203, P = 0.027) and negatively correlated with PL,OCT and PL,Bennett (r = −0.292, P = 0.001 and r = −0.216, P = 0.018, respectively). In addition, Rac and sRpc were positively correlated (r = 0.711, P < 0.001). sRal and sRpl were negatively correlated with LT (r = −0.348, P < 0.001 and r = −0.206, P = 0.024, respectively), but were not correlated with each other.
Table 3. Correlation between corneal and lenticular parameters and other associated factors*.
Ocular biometric data were stratified by sex and age in . Boys exhibited significantly deeper ACD and longer AL than the girls. Rac was significantly higher in boys than in girls. In addition, PC,GE, PC,OCT, PL,Bennett were all significantly lower in boys than in girls. In light of the influence of age on ocular component growth patterns implied by previous studies,Citation10,Citation11 participants were stratified into a younger group (6–9 years) or older group (10–14 years). Children aged ≥10 years showed longer AL and thicker CCT. There was no significant difference in corneal parameters between the two groups. However, the sRal was remarkably larger, and the PL,Bennett and PL,OCT were significantly lower in older than younger participants.
The differences in ocular parameters according to age were further analysed ( and ). AL and VCD showed an increasing trend with older age (both P < 0.05), whereas ACD remained stable over time. No cornea-related parameters were correlated with age, except CCT (r = 0.269, P = 0.003). LT exhibited a decreasing trend with age, but the difference was not significant between the groups. Compared to sRpl, the increase in sRal was significantly correlated with an increase in age (r = −0.267, P = 0.003). There was a significant negative correlation between both PL,OCT (r = −0.363, P < 0.001) and PL,Bennett (r = −0.242, P = 0.008) with age. The L ratio significantly increased with age (r = 0.219, P = 0.017), whereas there was no correlation between the C ratio and age.
Figure 3. Variations of ocular biometric parameters by age. The 12-14-year-old group contains 12-, 13- and 14-year-old subjects. Ocular biometric parameters include spherical equivalent (SE), axial length (AL), central corneal thickness (CCT), lens thickness (LT), the radius of curvature of the anterior cornea surface (Rac), the simulated radii of curvature of the posterior corneal surface (sRpc) and two lenticular surfaces (sRal and sRpl), the calculated cornea power (PC,GE), the calculated lens power (Pl,bennett), the simulated cornea power (PC,OCT), and the simulated lens power (PL,OCT). * Between-group significant differences at P < 0.05.
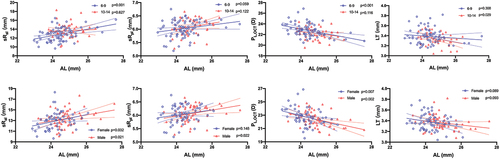
Significant correlations were observed between AL and parameters of cornea and lens in all participants (). In both sexes, there were significant positive correlations between AL and the radii of the anterior and posterior corneal curvature. The correlation between Rac and AL was similar between the two age groups, while sRpc was no longer significantly positively correlated with AL when the age exceeded 9 years. PC,OCT was negatively correlated with AL, whereas PC,OCT/PL,OCT remained stable regardless of sex and age subgroups (). Although LT noticeably declined with elongation of AL in children older than 9 years, sRal exhibited a significant increasing trend, and PL,OCT showed a declining trend with a longer AL only in children younger than 10 years. sRal and PL,OCT were remarkably correlated with AL regardless of sex, whereas the correlation between sRpl and AL was only statistically significant in boys (). There was no correlation between the C and L ratios and AL.
Figure 4. The association between axial length and corneal parameters in different age groups (Upper row) and gender groups (Lower row) by univariate linear regression analyses. Corneal parameters include the radius of curvature of the anterior cornea surface (Rac) and the simulated radius of curvature of the posterior cornea surfaces (sRpc), the simulated cornea power (PC,OCT), and PC,OCT/PL,OCT ratio. Solid lines represent the linear regression with 95% confidence intervals indicated by the dashed lines.
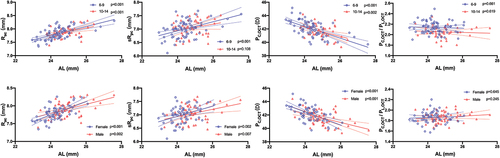
Figure 5. The association between axial length and lenticular parameters in different age groups (Upper row) and gender groups (Lower row) by univariate linear regression analyses. Lens parameters include the simulated radii of curvature of the anterior and posterior lens surfaces (sRal and sRpl), the simulated lens power (PL,OCT), and lens thickness (LT). Solid lines represent the linear regression with 95% confidence intervals indicated by the dashed lines.
Subsequently, independent predictors were selected for multivariate linear regression based on the demographic features and ophthalmic parameters associated with AL in the univariate analyses (). According to the model, both the decline of corneal power and lenticular power were associated with a longer AL, with PC,OCT exhibiting a greater impact than PL,OCT (standardised coefficient β: −0.49 vs. −0.20). In addition, a longer AL was also independently associated with older age (unstandardised coefficients B = 0.06), boys (unstandardised coefficients B = −0.28), and a high degree of myopia (unstandardised coefficients B = −0.38). In contrast, there was no significant correlation between SE and the corneal or lenticular parameters. Furthermore, none of the ratios including AL/Rac, AL/sRal, and PC,OCT/PL,OCT were associated with SE.
Table 4. Multivariate linear regression analysis of the axial length as a function of factors known to affect eye growth*.
Discussion
To date, there has been limited knowledge regarding the variation in corneal and lenticular surfaces during emmetropization or myopia progression in children. The measurement and simulation of the radii of the corneal and lenticular curvature in this study enabled direct evaluation of the shape and simulation of the refractive power. Data and images obtained from a single swept-source biometry device simultaneously reduce measurement uncertainty owing to potential differences in instrument precision and patient alignment.Citation12
The posterior corneal surface has been less frequently examined than the anterior surface. Using the Purkinje method, Garner et al.Citation13 reported a wide range of posterior radius of corneal curvature in the vertical meridian (from 5.62 to 7.22 mm) and a mean anterior-posterior ratio of 1.21 in Nepali children. Yeter et al.Citation14 investigated corneal curvatures in children aged 3–6 years using a Scheimpflug Analyser and found the mean anterior and posterior best-fit sphere were 7.89 and 6.68 mm, respectively, which resulted in an anterior-posterior ratio of 1.18.
In the present study, high-resolution cross-sectional images of the anterior eye segment enabled the direct measurement of the anterior and posterior corneal radii of curvature. The radius of curvature of the anterior cornea in this study was consistent with the aforementioned studies. However, the C ratio was 1.12 ± 0.04, owing to a relatively large posterior corneal radius of curvature. There is a paucity of research on quantitative measurements of lenticular radii of curvature in myopic children. Shoji et al.Citation15 found that another commercially available SS-OCT, CASIA2, could provide reproducible measurements of lens curvature in healthy adults. Chen et al.Citation16 reported that the radii of anterior and posterior lenticular curvature were 12.70 ± 1.26 and 5.98 ± 0.36 mm, respectively, in Chinese children with low-to-moderate myopia (mean age of 9.51 years and mean SE of −1.9 D) using CASIA2.
In the current study, the simulated radii of curvature of the anterior and posterior lens were 13.15 ± 1.58 and 6.05 ± 0.31 mm, respectively. The severity of myopia (mean SE of −2.22 D) could be attributed to the relatively larger anterior lenticular radius of curvature in this study. In accordance with prior findings,Citation13,Citation17 a significant correlation and independence was observed between the radii of curvature of the two corneal surfaces. Independence was shown by the variation in the correlations between the anterior and posterior corneal radii of curvature and other ocular parameters. Conversely, no significant association was observed between the two simulated lenticular curvatures.
During emmetropization, flattening of the corneal and lenticular curvatures and a decrease in corneal and lenticular equivalent power were observed along with lengthening of the eye.Citation18 Compared to the general stability of corneal power over time, the relationship between lens power and refractive status has been a question of interest to researchers. Nevertheless, there has been a discrepancy in the compensatory changes of the lens during the onset or progression of myopia. The Orinda Longitudinal Study of Myopia (OLSM) demonstrated a similar rate of decrease in Gullstrand lens power in four refractive error groups, including persistent hyperopia, persistent emmetropia, emmetropizing hyperopia, and myopia.Citation19 The Singapore Cohort Study of the Risk Factors for Myopia further distinguished newly developed myopes from persistent myopes. It was reported that parallel patterns of lens power loss were relatively steep before the age of 10 and then flattened, while the newly developed myopia group had a greater loss of lens power than the other four groups.Citation20 However, the Collaborative Longitudinal Evaluation of Ethnicity and Refractive Error study indicated that the compensating response of the Gullstrand-Emsley lens power loss was interrupted at the onset of myopia and for at least the following 5 years in children.Citation21 The Guangzhou Twin Eye Study illustrated that the rate of lens power loss fluctuated at approximately −0.2 D annually and the changes were not significant around the onset of myopia.Citation22
Bennett’s formula is one of the best-known crystalline lens power formulas.Citation4 There is good agreement between Bennett’s method and phakometry in adult populations,Citation17 although the differences could be up to 3.5 D.Citation23 The mean calculated lenticular power by Bennett’s formula was 23.48 ± 1.47 D in the present study. The lens power calculated with the Gullstrand-Emsley schematic eye indices in the OLSM study was 20.79 ± 1.5 D for the myopic group.Citation19 The Shanghai Children Eye Study reported that the mean lens power calculated using Bennett’s formula was 25.28 ± 1.93 D.Citation24 The inconsistencies among different studies could be attributed to differences in the study cohorts and measurement approaches.
In the present study, changes in the radii of the corneal curvature and its refractive power were invariant to age. The CCT thickened with increasing age, which is contrary to previous studies.Citation25 This discrepancy might be attributed to differences in study cohorts, given that many demographic, ethnic, or ophthalmologic factors could potentially affect corneal thickness. The lens was notably thinner, curvature was steeper, and lenticular power was lower in younger myopic children. In previous studies, a U-shaped curve of LT with age was observed, with the trough in myopic children occurring at approximately 10 years.Citation11,Citation19 The two-phase growth of the lens can be explained by a balance between the compaction inside the lens nucleus and the growth of new fibres in the lens cortex. LT decreased from the age of 6 years to 10 years, increased at 11 years of age, and decreased again after that in this study. Notably, the results could be biased due to the relatively small sample size of the 12–14-year-old group (N = 9).
As expected, girls in this study had a more curved lenticular surface and greater lens power than boys, consistent with previous studies.Citation24,Citation26,Citation27 However, only the difference in the calculated lens power between the groups was statistically significant.
In the present study, AL was the most important factor in the determination of SE, while both the cornea and crystalline lens played partial coordinative roles in off-setting excessive eye growth. In addition, PC,OCT/PL,OCT were independent of the change in AL regardless of sex or age, suggesting that the refractive factor between the cornea and lens remained stable in children with myopia. These results concur with the findings of Ip et al.Citation28 that stronger correlations between AL and SE in older children and in the East Asian ethnic group corresponded well with a refractive development model of continuing axial elongation in the absence of compensatory lens changes.
It was also noted that the correlation between anterior lenticular curvature flattening and axial growth was only significant before the age of 10 years, as was the association between lens power loss and axial growth. This phenomenon was consistent with a cross-sectional study, which indicated that the compensatory ability of lens power declined not only with increasing age for its natural development, but also with axial elongation in myopia development.Citation24 Flattening of the cornea could exert an emmetropizing effect to compensate for the elongation of the AL. Paradoxically, the cornea was found to be steeper and the AL/Rac ratio was higher in myopic eyes, which might be explained by the stretching of the eye that occurs during the development of myopia,Citation29 as the cornea fails to continue to flatten to compensate for the abnormal growth of the eye.Citation30,Citation31
The AL/Rac was 3.13 ± 0.09 in this study, which was above the cut-off value of 3.0 for eyes likely to have myopia.Citation30 However, AL/Rac was not associated with the SE magnitude. It was speculated that in this study group, the cornea had reached its limit of compensative capacity, facing excessive increases in AL. Similarly, there was no significant correlation between AL/sRal and SE, suggesting that the crystalline lens also failed to compensate fully for excessive axial elongation.
There are two potential theories regarding the mechanisms underlying changes in corneal and lenticular power and axial elongation. The passive mechanism proposed by van AlphenCitation29 indicates that the cornea flattens due to the increased eye size and lens flattens because of equatorial stretch. An active mechanism suggests an active reshaping process of the lens during emmetropization or the development of myopia. The findings of this study support the passive mechanism.Citation7
This study has certain limitations. First, the distortions of measurements of the corneal and lenticular biometry owing to the refraction at each intraocular surface were not all corrected except for the air-corneal interface. Individual corrections for each surface by applying methods such as ray tracing would increase the accuracy of simulating anterior and posterior lens curvatures.Citation32 Second, because the calculations of refractive power were based on the paraxial schematic model eye, the gradient index profile of the lens and the asphericity of both the corneal and lenticular surfaces were omitted, and therefore only on-axis predictions at small field angles were considered accurate.Citation33,Citation34
In addition, the simulated radius of curvature of each surface was an average of six cross-sectional images; therefore, the accuracy of the simulation could be affected in subjects with significant astigmatism. Further, the eyes of participants were not cycloplegic before the IOLMaster 700 test, which might trigger some degree of accommodation and result in slightly more myopic refraction, and decrease the accuracy of simulating the crystalline lens geometry in participants with natural pupil diameters smaller than 6 mm, which accounted for 67.2% of the eyes enrolled (pupil diameters following a normal distribution in the range of 3.1 to 7.2 mm).Citation35 Furthermore, this was a cross-sectional study with a relatively small sample size; thus, the associations observed in this study require further confirmation from longitudinal studies with larger sample sizes.
In summary, this study utilised a single biometry device combined with a customised program to evaluate ocular parameters thoroughly in Chinese children with myopia. AL appeared to be the most influential factor in determining spherical equivalent refractive error, while decreases in both corneal and crystalline lens power were significantly inversely correlated with axial elongation after adjusting for the effects of SE, age, and sex.
Acknowledgements
The authors are grateful to the children and their parents or guardians who participated in the study.
Disclosure statement
No potential conflict of interest was reported by the author(s).
Additional information
Funding
References
- Iribarren R. Crystalline lens and refractive development. Prog Retin Eye Res 2015; 47: 86–106.
- Sankaridurg P, Tahhan N, Kandel H et al. IMI impact of myopia. Invest Ophthalmol Vis Sci 2021; 62: 2.
- Olsen T. On the calculation of power from curvature of the cornea. Br J Ophthalmol 1986; 70: 152–154.
- Bennett AG. A method of determining the equivalent powers of the eye and its crystalline lens without resort to phakometry. Ophthalmic Physiol Opt 1988; 8: 53–59.
- Mutti DO, Zadnik K, Adams AJ. A video technique for phakometry of the human crystalline lens. Invest Ophthalmol Vis Sci 1992; 33: 1771–1782.
- Akman A, Asena L, Güngör SG. Evaluation and comparison of the new swept source OCT-based IOLMaster 700 with the IOLMaster 500. Br J Ophthalmol 2016; 100: 1201–1205.
- Muralidharan G, Martínez-Enríquez E, Birkenfeld J et al. Morphological changes of human crystalline lens in myopia. Biomed Opt Express 2019; 10: 6084–6095.
- Bartko JJ. The intraclass correlation coefficient as a measure of reliability. Psychol Rep 1966; 19: 3–11.
- Bland JM, Altman DG. Measuring agreement in method comparison studies. Stat Methods Med Res 1999; 8: 135–160.
- Mutti DO, Zadnik K, Fusaro RE et al. Optical and structural development of the crystalline lens in childhood. Invest Ophthalmol Vis Sci 1998; 39: 120–133.
- Wong HB, Machin D, Tan SB et al. Ocular component growth curves among Singaporean children with different refractive error status. Invest Ophthalmol Vis Sci 2010; 51: 1341–1347.
- Chang YC, Mesquita GM, Williams S et al. In vivo measurement of the human crystalline lens equivalent refractive index using extended-depth OCT. Biomed Opt Express 2019; 10: 411–422.
- Garner LF, Owens H, Yap MK et al. Radius of curvature of the posterior surface of the cornea. Optom Vis Sci 1997; 74: 496–498.
- Yeter V, Aritürk N, Bİrİncİ H et al. Effects of birth weight on anterior segment measurements in full-term children without low birth weight by dual-Scheimpflug analyzer. Am J Ophthalmol 2015; 160: 832–840.e831.
- Shoji T, Kato N, Ishikawa S et al. In vivo crystalline lens measurements with novel swept-source optical coherent tomography: an investigation on variability of measurement. BMJ Open Ophthalmol 2017; 1: e000058.
- Chen Z, Li T, Li M et al. Effect of tropicamide on crystalline lens rise in low-to-moderate myopic eyes. BMC Ophthalmol 2020; 20: 327.
- Dunne MC, Barnes DA, Royston JM. An evaluation of Bennett’s method for determining the equivalent powers of the eye and its crystalline lens without resort to phakometry. Ophthalmic Physiol Opt 1989; 9: 69–71.
- Mutti DO, Mitchell GL, Jones LA et al. Axial growth and changes in lenticular and corneal power during emmetropization in infants. Invest Ophthalmol Vis Sci 2005; 46: 3074–3080.
- Jones LA, Mitchell GL, Mutti DO et al. Comparison of ocular component growth curves among refractive error groups in children. Invest Ophthalmol Vis Sci 2005; 46: 2317–2327.
- Iribarren R, Morgan IG, Chan YH et al. Changes in lens power in Singapore Chinese children during refractive development. Invest Ophthalmol Vis Sci 2012; 53: 5124–5130.
- Mutti DO, Mitchell GL, Sinnott LT et al. Corneal and crystalline lens dimensions before and after myopia onset. Optom Vis Sci 2012; 89: 251–262.
- Xiang F, He M, Morgan IG. Annual changes in refractive errors and ocular components before and after the onset of myopia in Chinese children. Ophthalmology 2012; 119: 1478–1484.
- Rozema JJ, Atchison DA, Tassignon MJ. Comparing methods to estimate the human lens power. Invest Ophthalmol Vis Sci 2011; 52: 7937–7942.
- Xiong S, Zhang B, Hong Y et al. The associations of lens power with age and axial length in healthy Chinese children and adolescents aged 6 to 18 years. Invest Ophthalmol Visual Sci 2017; 58: 5849–5855.
- Tong L, Saw SM, Siak JK et al. Corneal thickness determination and correlates in Singaporean schoolchildren. Invest Ophthalmol Vis Sci 2004; 45: 4004–4009.
- Zadnik K, Manny RE, Yu JA et al. Ocular component data in schoolchildren as a function of age and gender. Optom Vis Sci 2003; 80: 226–236.
- Twelker JD, Mitchell GL, Messer DH et al. Children’s ocular components and age, gender, and ethnicity. Optom Vis Sci 2009; 86: 918–935.
- Ip JM, Huynh SC, Kifley A et al. Variation of the contribution from axial length and other oculometric parameters to refraction by age and ethnicity. Invest Ophthalmol Vis Sci 2007; 48: 4846–4853.
- van Alphen AG. On emmetropia and ametropia. Opt Acta (Lond) 1961; 142: 1–92.
- Grosvenor T, Scott R. Role of the axial length/corneal radius ratio in determining the refractive state of the eye. Optom Vis Sci 1994; 71: 573–579.
- González Blanco F, Sanz Fernandez JC, Munoz Sanz MA. Corneal radius, and age of myopia onset. Optometry Vision Sci 2008; 85: 89–96.
- Dubbelman M, Van der Heijde GL, Weeber HA. Change in shape of the aging human crystalline lens with accommodation. Vision Res 2005; 45: 117–132.
- Atchison DA, Thibos LN. Optical models of the human eye. Clin Exp Optom 2016; 99: 99–106.
- Bakaraju RC, Ehrmann K, Papas E et al. Finite schematic eye models and their accuracy to in-vivo data. Vision Res 2008; 48: 1681–1694.
- Ortiz S, Pérez-Merino P, Gambra E et al. In vivo human crystalline lens topography. Biomed Opt Express 2012; 3: 2471–2488.