
 ?Mathematical formulae have been encoded as MathML and are displayed in this HTML version using MathJax in order to improve their display. Uncheck the box to turn MathJax off. This feature requires Javascript. Click on a formula to zoom.
ABSTRACT
Clinical relevance
Horizontal fusional reserves are used in the diagnosis and monitoring of common vergence disorders, such as convergence insufficiency, which can cause asthenopia and impact near work. Infrared eyetracking technology shows promise for obtaining automated and objective measurements of fusional reserves, expanding options for screening, clinical testing, and at-home monitoring/vision training.
Background
Current clinical tests for fusional reserves rely on subjective judgements made by patients (for diplopia) and clinicians (for eye movements). This paper describes an objective and automated “digital fusion-range test” pilot-tested in adults without current eye disease or binocular vision anomalies. This test combines a consumer-grade infrared eyetracker, a dichoptic display, and custom analyses programs to measure convergence and divergence reserves.
Methods
Twenty-nine adult participants completed the study. Horizontal fusional reserves at 55 cm were measured using prism bars and with our computer-based digital fusion-range test. For the digital test, observers viewed dichoptic targets whose binocular disparity modulated over time (at speeds of 0.5, 1.0, or 2.0 Δ/s) while their eye movements were continuously recorded. Subjective reports of break and recovery (by keyboard button press) were compared to objective estimates extracted from eyetracking recordings (via automated analyses).
Results
Objective and subjective measures of break and recovery agreed closely. Clinically small (0.3-2Δ) but statistically significant (p < 0.012) differences were found between measurement types for divergence breaks/recoveries and convergence recoveries. No significant differences were found for convergence breaks (p = 0.11). Such differences are consistent with an average 0.91 (SD 1.66) seconds delay between objective break/recovery and subjective responses. The digital test produced comparable results to the standard clinical prism bar method.
Conclusion
The digital fusion-range test supports an automated, reliable assessment of horizontal fusional reserves, which do not depend on subjective responses. This technology may prove useful in a variety of clinical and community-based settings.
Introduction
Fusional reserves measure how well the oculomotor system can maintain binocular single vision (BSV) under increasing vergence demand. Assessment of fusional reserves is useful for diagnosing and monitoring vergence disorders such as convergence insufficiency and intermittent exotropia. These conditions are commonly encountered in school-aged children, where asthenopic symptoms can lead to disengagement from near-work.Citation1 Estimates of prevalence for vergence disorders vary greatly from 2.2% to 33%,Citation2 and the reliability of standard measures used in clinical diagnosis likely contributes to this variability.
In a standard assessment of fusional reserves, the clinician increases binocular disparity – using prisms or by changing physical target separation – to estimate the minimum vergence demand that leads to blur, then break of BSV and diplopia. Disparity is then reduced until recovery of BSV. Results from different methods, such as prism bars, Risley prisms, vectograms, and the synoptophore, correlate poorly and suffer from high test–retest variability.Citation3–5 Clinical measures all rely on either the patients’ subjective self-report or the clinicians’ observation of the patients’ eye movements,Citation6 and are thus not truly “objective”. Subjective results are influenced by criterion effects – some patients consider partial splitting diplopic, while others wait for full separation of images. Further variance can be caused by patient reaction times,Citation7 testing speedCitation8 and order,Citation9 examiner encouragement, and patient concentration.Citation10
Direct observation of eye movements can reduce patient-based variability, but is generally only possible using prism bars. The prism bar method has several limitations: a) disparities are introduced in discrete intervals with non-uniform step sizes, limiting precision; b) clinicians can only fixate on one eye at a time during observations; and c) vergence dynamics such as momentary loss and regaining of BSV can only be qualitatively described in clinical notes. Given the importance of fusional reserves assessment and the extent to which non-visual factors influence testing, there is an unmet need for a more objective and standardised test.
Eyetracking technology has been used to study binocular eye movements, combined with dichoptic presentation methods where different stimuli are shown to each eye via haploscopes,Citation11,Citation12 or target disparities introduced using prisms.Citation13 While these methods are precise and accurate, their relationship to existing clinical measures is unclear. The bulky equipment used is also impractical for the clinic. However, advances in consumer eyetracking and displays have now made clinically relevant digital tests possible. Infrared eye-trackers are economical, easy-to-operate, and portable. Paired with dichoptic display systems, eyetracking can support objective, affordable, and user-friendly tests of binocular vision and oculomotor function that can be used in a variety of clinical and community-based settings.
This study investigated whether consumer-grade eye tracking can be used for automated, and objective quantification of horizontal fusional reserves, in an assessment which the authors refer to as the digital fusion-range test. Specifically, objective eyetracking measures were compared with simultaneously measured subjective break/recovery, and digital test results were compared with standard clinical assessment. Adult observers were tested rather than children, as this was a first proof-of-concept study.
Methods
Participants
Adult participants (≥18 years) were recruited from University of Auckland staff and students. The study was approved by the University of Auckland Human Participants Ethics Committee and adhered to the principles of the Declaration of Helsinki.
Following provision of written informed consent, participants were deemed eligible if they had no current eye diseases or binocular vision abnormalities, best-corrected visual acuity of 6/9.5 or better in each eye, 1 logMAR line or less difference in acuity between eyes, no detectable strabismus on cover test, and measurable stereopsis (1200 seconds or better) on the TNO test (Lameris Ootech). Participants with refractive error needed to either wear soft contact lenses or be able to view the computer screen unaided, as wearing 3D glasses on top of spectacles can attenuate the eyetracking signal. These eligibility criteria were intended to allow recruitment of participants with a range of vergence ability, within and outside normal ranges.
Thirty-four participants were screened and 32 were eligible. One ineligible participant had an acuity worse than 6/9.5; the other had previously undiagnosed convergence insufficiency and could not complete testing due to fatigue.
The digital fusion-range test
Eyetracking was conducted in a darkened room using a consumer-grade infrared eyetracker (Tobii 4C, Tobii, Danderyd, Sweden) attached to a Windows 10 PC, running the Tobii Pro Software Developer’s Kit. The Tobii eyetracker recorded eye position at 90 Hz and incorporated compensation for head movement. Stimulus-generation, digital tests, and analyses were run in MATLAB (Mathworks, Nantick, USA), with Psychtoolbox 3.0.Citation14,Citation15 Stimuli were displayed on an LG Flatron W2363D-PF monitor with a background luminance of 132 cd/m2 and a spatial resolution of 1920 × 1080 pixels, operating at 120 Hz. Dichoptic display was achieved using 3D frame-sequential stereo glasses (Nvidia 3D Vision 2, Nvidia, Santa Clara, USA). A darkened room was used to reduce peripheral fusion cues, and also to improve eyetracking signal reliability.
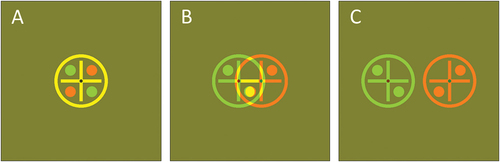
Participants viewed the computer screen from 55 cm (the optimal distance for this specific eyetracker) without a headrest, but were instructed to minimise movement. They were instructed to focus on the target () and “try to maintain the target as clear and single”. Participants indicated using the keyboard whether the target appeared single or double. Practice stimuli were shown before testing to ensure all participants used the same subjective criterion for diplopia (seeing two completely separate targets).
Figure 1. Typical fixation stimuli, adapted for red-green anaglyph display. Actual stimuli were greyscale. A: Zero disparity. B: overlapping targets for the left and right eyes. Participants were instructed that this percept was not considered “double”. C: Separated targets, which are considered “double” if seen. (A movie of a typical break-inducing sequence is available at this link: https://youtu.be/e_-CrM14XwU).
Digital measures of horizontal fusional reserves were made at three different speeds of disparity change: 0.5, 1.0, and 2.0 Δ/s. Testing order was randomised across speeds. For each speed, divergence was tested before convergence, giving six total test conditions. To minimise vergence adaptation and fatigue, participants rested for at least 2 min between each condition.
illustrates the test sequence. Each run commenced with a zero-disparity target at the screen-centre, then target disparity smoothly increased until the participant indicated diplopia by depressing the spacebar. At this point, the target disparity was fixed for 4 s, allowing the participant to confirm a sustained break. After confirming loss of fusion, the target disparity smoothly decreased until the participant released the spacebar to indicate they now saw a single fused target. The target disparity was fixed for 4 s to allow confirmation of sustained subjective recovery. Within each run, five measurements of subjective break and recovery points were made, with the eyetracker recording continuously throughout (). Data were analysed after testing.
Figure 2. Eye tracking data from author TYG, for measuring convergence with stimuli moving at 2 Δ/s. A: Horizontal on-screen position of stimuli (purple/blue) and estimated gaze point (red/green) over time. B: Target separation (blue line), target diameter (blue shading), and smoothed gaze vergence (black). The magenta and cyan diamonds indicate break and recovery points identified by automated analyses.
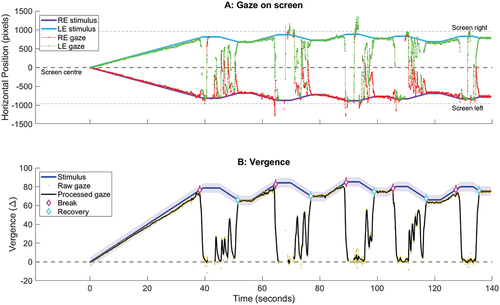
Objective endpoints for fusional reserves were extracted from the eyetracking record using MATLAB (). First, data were pre-processed: blink artefacts were removed, gaps in the eye position record of ≤1 s were interpolated, and the data stream smoothed using a Savitzky-Golay filter.Citation16 Next, horizontal gaze point separation (“gaze vergence”) was calculated using the difference between left and right eye gaze positions on screen. This gaze vergence estimate was compared against the horizontal target separation displayed on each stimulus frame. If the gaze vergence differed from target separation by less than the target diameter, then the participant was considered fused.
When gaze vergence differed from the target separation by more than the target diameter, the participant was not matching their vergence to target disparity within the diplopia criterion instructed, so was classed as non-fused. Transitions from fused to non-fused states were counted as breaks, and transitions from non-fused to fused states were counted as recovery. As participants can momentarily lose and then regain fusion before the actual end point of sustained break a criterion was set that objective break points would be counted only if followed by at least 2 s of sustained loss of fusion. A similar 2-s fusion rule was set for recovery points.
For each digital test run, subjective break and recovery were calculated using the average of five keypress endpoints for each measure. Objective break and recovery were extracted using the average of all break and recovery points extracted from eyetracking analyses. Reaction times were calculated as the time difference between the keypress response by the participant, and the nearest objective response of the same type found from automated analyses.
Clinical test of fusional reserves
Measures of horizontal fusional reserves were made using prism bars while participants viewed a static 2.93-degree diameter target () on a computer monitor at 55 cm (to match the digital test). The room was well lit to allow the examiner to observe eye movements. As is conventional, Base In (divergence) was tested first followed by Base Out (convergence), to reduce prism adaptation effects on Base In measures.Citation10 The examiner held the prism bar over the left eye of the participant and slowly incremented the prism stepwise. Participants reported whether the target was clear and single at each step, and the examiner only incremented the prism if the target remained single (for blur/break) or decreased the prism until the participant reported seeing single to indicate recovery.
To reduce variability in subjective criterion, participants were instructed to only consider the target double if they saw the outer circle completely separate. Where the highest value on the prism bar (40Δ) was reached without a break, a 40Δ loose prism was held in front of the right eye and the prism bar incremented in front of the left eye until break was reached. The first prism values at which sustained blur, break, and recovery were achieved were taken as end points. Only break and recovery points were analysed, as the digital test is not able to measure blur points.
Statistical analyses
Statistical analyses were conducted in MATLAB. A p-value of <0.05 was used for statistical significance. For each of convergence break, convergence recovery, divergence break, and divergence recovery measured using the digital test, results were analysed using two-way repeated measures ANOVA with factors of response type (Subjective vs Objective) and stimuli speed (0.5, 1, and 2 Δ/s). Post-hoc analyses with Tukey-Kramer correction were used where significant simple main effects were found.
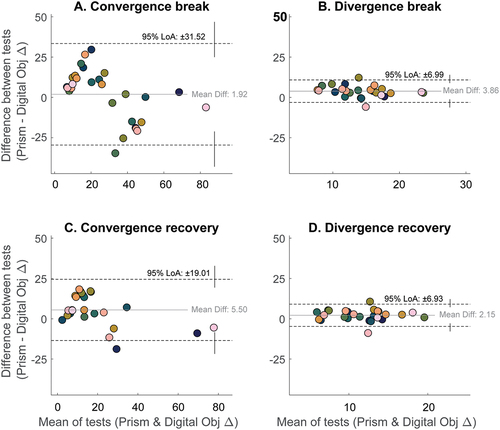
Agreement of measures () and Pearson’s Correlations were quantified based on linear regression of the log-transformed data. Clinical prism bar break and recovery results were compared with the equivalent digital test results using Bland-Altman plots.
Figure 3. Plots of objective versus subjective break points measured for A-C: convergence and D-F: divergence. Data are from 29 participants and were collected with stimuli moving at: (a,d) 0.5, (b,e) 1.0 and (c,f) 2.0Δ/s. Error bars show 95% confidence intervals, the red line is the unity line, the grey line is the best-fitting straight line. indicates outliers (where the difference between subjective and objective estimates fell more than 3 standard deviations from the mean difference).
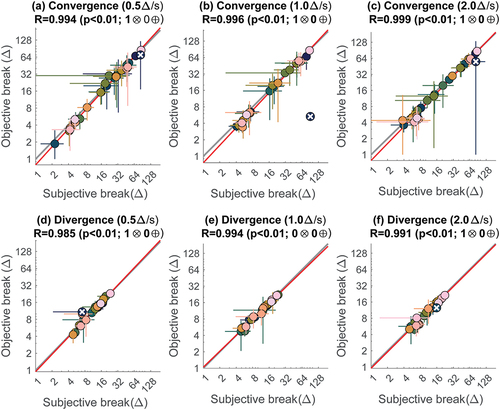
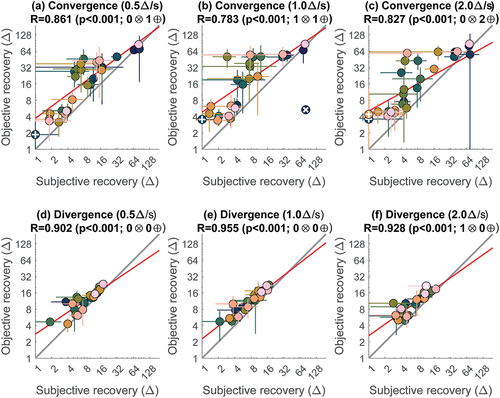
Figure 4. Plots of objective versus subjective recovery points measured for (a-c) convergence and (d-f) divergence. Plotting conventions are as , but in addition indicates one participant with poor convergence recovery (<1δ), which falls out of range for this log-scale plot.
One-way intraclass correlation coefficients (ICCs)Citation17 quantified the test–retest reliability of the digital test, and were calculated separately for objective and subjective estimates of breaks and recoveries, based on absolute-agreement of randomly selected measurements (a type ‘1-1’ measure). Final ICC estimates were based on a bootstrap, where a new dataset was constructed by taking four measures from each participant/condition from the values available (some participants had more than four measures). This process was repeated 100 times, and the ICC reported was the mean of the 100 ICC estimates.
Results
Eyetracking data from 29 (91%) out of 32 participants could be analysed. One participant did not complete testing as they reported nausea during dichoptic viewing. In addition, eyetracking data were poor for two participants, likely due to dry eye (with dry contact lenses and excessive blinking) and false eyelashes, respectively. The 29 analysed participants (7 males and 22 females) had a mean age of 22.9 years (SD 5.6 years). Fourteen were staff or students at the School of Optometry and Vision Science.
At a speed of 0.5 Δ/s, the digital test had a mean duration of 121.0 (SD 36.4) and 311.6 (SD 237.6) seconds for divergence and convergence, respectively. At 2.0 Δ/s, average test durations were only 67.1 (SD 11.7) and 120.0 (SD 76.1) seconds, respectively.
Comparison of objective and subjective digital test results
Very good agreement was found between objective and subjective measures of break () and recovery (). Subjective responses occurred on average 0.91 (SD 1.66) seconds after objective break/recovery, reflecting participant reaction times.
No significant effects of response type or stimulus speed were found for convergence breaks (p = 0.26). Objective divergence breaks were lower than subjective breaks for the 1.0 and 2.0 Δ/s speeds (F1,21 = 7.53, p < 0.012). For convergence and divergence recoveries, the objective results were consistently higher than the subjective results for both convergence (F1,26 = 7.66, p = 0.01) and divergence (F1,21 = 71.6, p < 0.001) at all speeds. However, the mean differences between objective and subjective measures were <2Δ for all speed and vergence conditions, with a slight trend towards greater differences at higher speeds. The effect of speed was only statistically significant for divergence recovery, and only between the 0.5 and 2.0 Δ/s speeds (F2,42 = 6.27, p = 0.011) with a mean difference of 1.05Δ (SEM 0.32Δ) and 1.25Δ (SEM 0.36Δ) for objective and subjective recoveries, respectively. Detailed results can be found in Supplementary Table 1.
To assess test–retest reliability, intraclass correlation (ICC) was calculated for the digital test data collected under various stimulus-speed conditions (Supplemental Table 2). There was a high level of agreement across measures made using both objective and subjective procedures, with a minimum ICC of 0.964 and a maximum of 0.994. There was no substantial variation in reliability across test-type (objective vs subjective) or across test-speeds.
Comparison of the digital test with clinical prism bar test results
shows a representative Bland-Altman plot comparing objective digital test results from the 1.0 Δ/s condition with results from the clinical prism bar test. Supplementary show comparison plots for all other conditions. The prism bar test tended to produce higher breaks and recoveries than the digital test, particularly for divergence.
Figure 5. Bland-Altman plots of fusional range estimates made using prism bars or objective responses from the digital test (1.0 Δ/s condition). Participant colour codes are as .
Discussion
This proof-of-principle study demonstrated that objective and repeatable measurements of horizontal fusional reserves are feasible using a low-cost eye tracker and dichoptic display, which may allow the development of a more accurate and reliable digital measure. For adult participants without major binocular vision disorders or eye diseases, only small (<2Δ), clinically unimportant differences were found between objective eyetracking and subjectively reported measures. Objective endpoints generally occurred before subjective report, likely due to the time required for participants to notice the visual change of single versus double and to then respond, during which time the stimuli continued to move. This likely explains the tendency for larger differences in objective and subjective measures at higher speeds. As different testing speeds did not lead to clinically important differences in outcomes in mostly visually normal adults, faster stimuli can be used to reduce testing time. However, slower speeds may be appropriate for patients with tenuous fusion (e.g. due to vergence disorders), or those with slower reaction times (e.g. children, patients with neurological disorders).
Infrared eyetracking relies on pupil imaging, and changes in pupil size have been reported to reduce the accuracy of gaze estimation.Citation18,Citation19 Additional analyses of our recorded pupil size and gaze position data were conducted (Supplementary Results). Though a portion of participants showed pupil miosis on convergence, only the results for one participant were impacted in terms of eyetracking accuracy (outlier marked by a dark blue “X” in ). For this participant, the measured gaze vergence was less than the target separation by a proportional amount, leading the threshold-based automated analysis to underestimate objective breaks and recoveries. Future iterations of eyetracking analyses could potentially apply compensation to overcome this. Alternatively, testing could be conducted under bright lighting to guarantee smaller pupils at the start of the test, which would show less proportional change during convergence. A follow-up experiment to examine the effects of room lighting is currently underway.
Differences between digital results and clinical tests
For most stimuli speeds – and particularly for divergence – breaks and recoveries from the prism bar test were higher than the digital test. This is likely attributable to several factors. First, in the prism bar test, participants had unlimited time to attempt to fuse each prism step. Second, larger step sizes of prism bars at higher values (4-20Δ in 2Δ steps, then 25-40Δ in 5Δ steps) reduced precision of results. Finally, Feldman, et al.Citation5 suggested that the greatest fusion ranges are found when the whole visual field contains consistent disparity, which was true for prism bars held close to the eye but not for the digital test. The 3D display is only able to alter target disparity within the physical confines of the computer screen. Peripheral objects, including the border of the computer monitor, continue to have zero binocular disparity, in conflict with the induced target disparity on screen, potentially resulting in lower measured reserves on the digital test.
Convergence results in this study showed wider limits of agreement than studies comparing only clinical techniques, while divergence limits of agreements were comparable.Citation3–5 This may be due to the high convergence ranges exhibited by some participants who were experienced with optometric testing. Test–retest variability should be expected to be a proportion of the baseline fusion range value rather than a fixed number. The prism dioptre scale is also not linear with respect to rotation of the eyes, with the scale becoming more compressed at higher values. The issue of larger prism bar step sizes at higher values may also contribute. Considering all these factors, one should expect larger magnitude errors in both the clinical and digital measures when convergence reserves are high. Convergence has also been found to be more prone to vergence adaptation,Citation20 which – given the duration of test runs in this study – could have contributed to the observed variability.
Advantages of the digital test
This is the first reported attempt at an automated binocular eye movement measurement system using only consumer-grade equipment. Automated testing allows for rapid and efficient data collection in a range of settings, which can be completed by lay screeners or technicians. Objective eyetracking allows break and recovery to be detected from eye movements alone, useful for patients who are unable to accurately report diplopia: for example, those with suppression due to intermittent exotropiaCitation21 or amblyopiaCitation22; or when reaction speed or communication is impaired, such as in stroke and traumatic brain injury.Citation23 Future implementations of this test will support self-testing, for potential use in home-based self-monitoring/vision therapy, and community-based vision screening.
The digital test not only delivers clinically relevant results but also retains the unprocessed eyetracking data, preserving information about the dynamics of vergence responses, blink rates, and (by signalling periods where participants are not looking at the screen) inattentiveness. For example, a clinician can review the eye tracking trace and see whether a patient with poor recovery made attempts at regaining fusion, and their strategies for doing so (e.g. blinking). Future improved analyses methods can be applied to previously recorded data, allowing clinicians and researchers to directly compare newly collected to historic data.
Limitations of the digital test
The current dichoptic display system required participants to wear LCD shutter glasses, which were relatively heavy and, when worn over spectacles, attenuated the eye tracking signal in most participants due to multiple layers of reflections. Because of this, only participants who were emmetropic, had low myopia, or willing to wear contact lenses were recruited in this pilot study.
Dichoptic presentation was not tolerated by one participant, and dry eye and false eyelashes hindered eyetracking recording in two others. These issues are likely to arise with any form of eyetracking and would need to be considered in clinical implementations.
The consumer-grade eyetracker used in this study records pupil size but not accommodation state, making it impossible to extract an objective blur point. Measuring accommodation in concert with vergence would require more complex methods with more advanced hardware (e.g. higher-order Purkinje images for gaze tracking.Citation24
The current automated analysis uses a fixed cut-off value (the target diameter) for determining fused vs non-fused states, as this matched instructions to participants for judging BSV versus diplopia. Because of this, the analysis could not reliably identify break and recovery points when the fusional reserves of participants were close to or lower than the target diameter (approximately 5). Re-analysing the current data using a lower threshold for fusion loss produced usable results in the small number of participants affected, but complicated analyses for participants with better vergence reserves as it detected many brief instances fusion loss and recovery. This issue of an optimal cut-off criterion also limited measurement accuracy for vertical fusional reserves (which are generally much lower than horizontal reserves)Citation7 which were piloted before this study. More precise analyses may be needed to accurately measure low values of fusional reserves. Alternatively, if the digital test is used as a screening tool for horizontal fusional reserves only, the automated analysis can simply flag low values for referral without requiring further analyses.
Future development
The Nvidia display system used in this study is no longer commercially available – a casualty of the decline in popularity of consumer 3D displays. The authors are currently conducting a follow-up study investigating colour-anaglyph glasses for dichoptic presentation, as well as the effects of room lighting. Colour-anaglyph display removes the need for specialised computer monitors but may be affected by issues such as colour rivalry and differences in target visibility between eyes. Another approach is the use of virtual reality (VR) systems, some of which (such as the HTC Vive Pro Eye) feature built-in eye tracking. VR headsets minimise the impact of head motion and illumination changes on eye tracking but confound the near triad reflex and are not generally designed for testing children.
Finally, smartphone- and tablet-based systems with built-in eyetracking capabilities, combined with anaglyph glasses, may also be feasible to objectively measure fusion ranges. An entirely software-based implementation of our test would drastically lower barriers to adoption. These novel methods would need to be formally validated against existing clinical methods, with new normative ranges established, before widespread adoption. Early testing also suggests these consumer-grade technologies can be used for a ”digital cover test”, performing automated assessment of eye alignment in subjects with and without strabismus.Citation25
To improve test acceptability to children, it may help to “gamify” the test by (a) showing a “score” associated with maintaining BSV or recovering quickly after breaks; and (b) running the automated analyses in real-time so that target motion responds to eye movements, eliminating the need for subjective responses. This type of game may also be useful in vision training to treat vergence disorders, particularly as the eyetracker can be used to support live feedback and objectively record treatment adherence, which are critical for successful home-based vision therapy.
Conclusion
This paper proves that in-principle it is possible to obtain reliable, objective, and clinically useful measures of horizontal fusional reserves using consumer-grade eyetracking and dichoptic displays. Eyetracking is a promising avenue for use in improving objective measures of binocular status, providing tools and treatment options for vergence disorders in clinical and community settings.
Supplemental Material
Download MS Word (3.6 MB)Acknowledgements
We thank Dr Soheil Mohammadpour Doustkouhi for providing programming advice. Thank you also to all participants.
Disclosure statement
No potential conflict of interest was reported by the author(s).
Supplementary material
Supplemental data for this article can be accessed online at https://doi.org/10.1080/08164622.2022.2134763.
Additional information
Funding
References
- Borsting EJ, Rouse MW, Mitchell GL et al. Validity and reliability of the revised convergence insufficiency symptom survey in children aged 9 to 18 years. Optom Vis Sci 2003; 80: 832–838.
- Cacho-Martínez P, García-Muñoz Á, Ruiz-Cantero MT. Do we really know the prevalence of accommodative and nonstrabismic binocular dysfunctions? J Optom 2010; 3: 185–197.
- Antona B, Barrio A, Barra F et al. Repeatability and agreement in the measurement of horizontal fusional vergences. Ophthalmic Physiol Opt 2008; 28: 475–491.
- Goss DA, Becker E. Comparison of near fusional vergence ranges with rotary prisms and with prism bars. Optometry 2011; 82: 104–107.
- Feldman JM, Cooper J, Carniglia P et al. Comparison of fusional ranges measured by risley prisms, vectograms, and computer orthopter. Optom Vis Sci 1989; 66: 375–382.
- Pickwell D. Binocular vision anomalies : investigation and treatment. London; Boston: Butterworths; 1984.
- Lanca CC, Rowe FJ. Measurement of fusional vergence: a systematic review. Strabismus 2019; 27: 88–113.
- Ludden SNM, Codina CJ. Is there an ideal speed for the prism fusion range? Br Ir Ortho J 2012; 10: 51–55.
- Rosenfield M, Ciuffreda KJ, Ong E et al. Vergence adaptation and the order of clinical vergence range testing. Optom Vis Sci 1995; 72: 219–223.
- Fray KJ. Fusional amplitudes: developing testing standards. Strabismus 2017; 25: 145–155.
- Scheiman MM, Alvarez TL, Cotter SA et al. Negative fusional vergence is abnormal in children with symptomatic convergence insufficiency. Optom Vis Sci 2021; 98: 32–40.
- Erkelens IM, Bobier WR. Reflexive fusional vergence and its plasticity are impaired in convergence insufficiency. Invest Ophthalmol Vis Sci 2020; 61: 21.
- Cercenelli L, Fresina M, Bortolani B et al. Quantitative approach for the analysis of fusional convergence using eye-tracking and saclab toolbox. J Healthc Eng 2018; 2018: 3271269.
- Brainard DH, Vision S. The psychophysics toolbox. Spatial Vision 1997; 10: 433–436.
- Kleiner M, Brainard DH, Pelli DG. What’s new in psychtoolbox-3?. European Conference on Visual Perception; 2007; Arezzo, Italy: Perception.
- Schafer RW. What is a savitzky-golay filter? IEEE Signal Process Mag 2011; 28: 111–117.
- Salarian A. Intraclass correlation coefficient. Salarian A ed. Natick, Massachusetts, US: MATLAB Central File Exchange; 2021.
- Hooge ITC, Hessels RS, Nystrom M. Do pupil-based binocular video eye trackers reliably measure vergence? Vision Res 2019; 156: 1–9.
- Drewes J, Zhu W, Hu Y et al. Smaller is better: drift in gaze measurements due to pupil dynamics. PLoS One 2014; 9: e111197.
- Erkelens IM, Bobier WR. Adaptation of reflexive fusional vergence is directionally biased. Vision Res 2018; 149: 66–76.
- Serrano-Pedraza I, Manjunath V, Osunkunle O et al. Visual suppression in intermittent exotropia during binocular alignment. Invest Ophthalmol Vis Sci 2011; 52: 2352–2364.
- Babu RJ, Clavagnier SR, Bobier W, et al. The regional extent of suppression: strabismics versus nonstrabismics. Invest Ophthalmol Vis Sci 2013; 54: 6585–6593.
- Armstrong RA. Visual problems associated with traumatic brain injury. Clin Exp Optom 2018; 101: 716–726.
- Lu C, Chakravarthula P, Tao Y, et al. Improved vergence and accommodation via purkinje image tracking with multiple cameras for ar glasses. 2020 IEEE International Symposium on Mixed and Augmented Reality (ISMAR); 2020; IEEE.
- Gao TY, Hamm LM, Black J et al. Automated assessment of ocular deviations using a consumer-grade eye tracker and 3d display. Invest Ophthalmol Vis Sci 2019; 60: 4429.