
ABSTRACT
Clinical relevance
High-contrast visual acuity is disproportionately poor in patients with accommodative spasm subtype of near reflex (SNR-A), relative to uncorrected refractive errors of equivalent magnitude. This exaggerated loss of performance in SNR-A may be explained by the combination of pseudomyopia and its fluctuations, vis-à-vis, each factor considered separately.
Background
To determine how combinations of pseudomyopic refraction and its temporal variations in SNR-A impact high-contrast visual acuity by inducing these patterns in healthy cyclopleged adults, relative to their baseline acuity.
Methods
Refractive profiles of 15 patients with SNR-A were obtained from a previous study, averaged, and induced before the right eye of 14 cyclopleged adults (mean ±1 SD age: 22.7 ± 2.6 yrs) by feeding the profile into a coaxially placed, motorised, Badal optometer. LogMAR acuity was measured using the method of constant stimuli: (1) before cycloplegia, (2) after cycloplegia and post-cycloplegia with (3) combination of pseudomyopia and its temporal fluctuations, (4) only pseudomyopia, (5) only temporal fluctuations in refraction about emmetropia, (6) condition 5 with double the amplitude of induced fluctuations and (7) condition 5 with half the amplitude of induced fluctuations.
Results
The induced refractive fluctuations ranged from −0.80 to −1.75D, around a mean pseudomyopia of −1.20D. Visual acuity deterioration was maximum for the combination of pseudomyopia and temporal fluctuations condition (0.51 ± 0.07logMAR), followed by only pseudomyopia (0.27 ± 0.05logMAR) and only refractive fluctuations conditions (0.17 ± 0.04logMAR), all relative to baseline post-cycloplegia (0.13 ± 0.04logMAR) (p < 0.001). Visual acuity loss increased with doubling of refractive fluctuations (0.20 ± 0.04logMAR), relative to native fluctuations or halving the amplitude (0.15 ± 0.03logMAR) (p < 0.01). Task precision, as adjudged from the slope of psychometric function, followed a similar pattern of loss as visual acuity.
Conclusion
Combination of induced pseudomyopia and temporal fluctuations in refraction produces an additive loss of visual acuity and task precision, relative to baseline and each factor considered separately.
Introduction
Accommodative spasm, the most common subtype of spasm of near reflex (SNR-A), is characterised by a significant loss of visual acuity, pseudomyopia and large fluctuations in the refractive power around this pseudomyopia for a given viewing distance or accommodative demand.Citation1–5 While the characteristics of pseudomyopia and its fluctuations are recently described in this dysfunction,Citation2 their impact on acuity loss has remained unanswered for several reasons.
First, refractive fluctuations in SNR-A are rarely quantified in a clinical examination, precluding its comparison with visual acuity. Second, previous studies on SNR-A are majorly case reports/series arising from different research settings, each of whom may have adopted different acuity measurement techniques (e.g., type of acuity chart used, instruction set to patients, endpoint criteria for acuity, etc), preventing comparison of results.Citation4 Third, even if both acuity and the refractive fluctuations were recorded systematically in patients with SNR-A2 establishing a relation between them is not straightforward because the manifest pseudomyopia and its fluctuations may vary independently in a given patient, with differential effects on visual acuity. Fourth, the outcomes of such comparisons may also be confounded by associated dysfunction that may unduly influence acuity measurements (e.g. esodeviation)Citation3,Citation4 and/or by unique strategies adopted by the patient to optimise vision from their prior visual experience with this dysfunction (e.g., learning to use the sharpest retinal image during the fluctuation cycle, albeit with no direct evidence for the usage of such strategies presently).
This study focuses on the impact of manifest pseudomyopia and its fluctuations in SNR-A on high-contrast visual acuity. While image quality changes with temporal fluctuations in blur have been addressed previously for general optical systems,Citation6 only recently has this issue been extended to human visual optics.Citation7–10 For instance, Bartuzel et al. reported an improvement in visual acuity when induced static myopic blur was combined with 50 Hz trapezoidal variations in temporal blur profile, relative to when it was absent.Citation7 Goswami and Bharadwaj reported losses in high-contrast visual acuity with induced temporally-varying sinusoidal blur of a single frequency and amplitude (ranging between 0.25 and 2.0 Hz and 0.25 and 2.0D) – visual acuity deteriorated with increasing blur amplitude, more so for lower than higher-temporal frequency.Citation8
Even while these studies provide some initial insights into how temporal variations in blur impact visual acuity, they depart from the present study aim on three important fronts. First, temporal blur fluctuations in SNR-A contain a broadband frequency spectrum (0.1–2.5 Hz)2 unlike the single frequency fluctuations induced in these two studies.Citation7,Citation8 Second, the frequency of temporal blur induced by Bartuzel et al. (50 Hz) is significantly higher than what is experienced in SNR-A.Citation7 Third, temporal blur induced by Goswami and Bharadwaj were all about a mean emmetropic refractive state,Citation8 while those experienced in SNR-A all occur about a pseudomyopic refractive state (-0.5 to −3.75D).Citation1,Citation2 For these reasons, the main aim of the present study thus remains unsatisfactorily answered.
To address the proposed aim, this study took the approach of measuring visual acuity by inducing the pattern of refractive blur experienced in SNR-A on cyclopleged, healthy adults. The relative impacts of pseudomyopia and its refractive fluctuations on visual acuity were disentangled by inducing each component separately and comparing the results against their combined impact. The impact of exaggerated or diminished refractive power fluctuations, reflecting the intersubject variability of blur fluctuations in SNR-A2 was also addressed by measuring visual acuity with double or half the magnitude of these fluctuations. Overall, the induced refractive blur paradigm allowed for a systematic dissection of the said problem, without being unduly influenced by intersubject variability that will be manifest in cross-sectional study designs involving real patients with SNR-A.
Methods
Fourteen subjects (21 to 31 years; 7 males and 7 females), free of any ophthalmic pathology as deemed from a comprehensive eye examination, were recruited from amongst the staff and student pool of the LV Prasad Eye Institute (LVPEI), Hyderabad, India. The study protocol was in accordance with the tenets of the Declaration of Helsinki and was approved by the institutional review board of LVPEI. The study was initiated after subjects signed a written informed consent form. Spherical equivalent refractive error of the subjects ranged between ±1.00D, with a maximum of 1.00D astigmatism. These errors, obtained from non-cycloplegic subjective refraction for the baseline condition and cycloplegic subjective refraction for all other conditions, were fully corrected during the study using trial lenses placed in the trial frame at 14 mm vertex distance. Subjects with low magnitude of refractive errors were chosen for this study to ensure that their blur detection/discrimination capabilities did not unduly impact the outcomes of the study.Citation11,Citation12
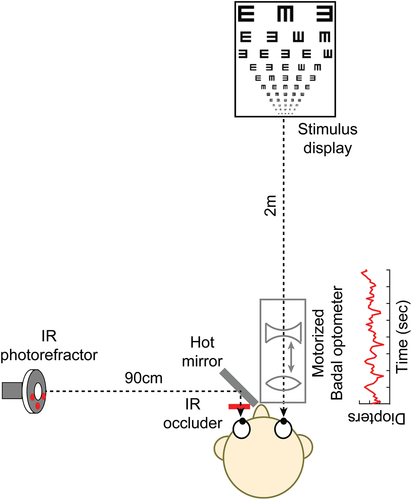
High-contrast visual acuity of the right eye of all subjects was measured using a method of constant stimuli psychophysical procedure written in Matlab® (Mathworks Inc, Natick, MA). The left eye remained occluded using an infrared filter (Optcast filter Edmund Optics®, NT43–954) at all times during the experiment. Subjects identified single Sloan optotypes without any flankers that were presented using the Matlab Psychtoolbox interface on a CRT monitor (1024 × 768 pixel resolution) for 300 ms each from 2 meters viewing distance ().Citation13 The psychometric function was generated by presenting 11 different optotype sizes, each 10 times, all in random order, resulting in a total of 110 presentations for each test condition.
Figure 1. The experimental set-up. Subjects performed the visual acuity task with their right eye through a custom-designed, motorised, Badal optometer while their left eye was occluded using an infrared transmitting filter. The refractive state of the left eye was monitored using a dynamic eccentric infrared photorefractor that was aligned orthogonal to that eye and obtained images through a hot-mirror aligned 45° to that eye.
For each presentation, one of the 10 Sloan optotypes of a given size was randomly chosen from the image database. However, since the subjects were not aware that only 10 out of 26 English alphabets were to be presented, the task was rendered a 26-AFC procedure, with a chance level of 3.85%. The resultant data was fit with a cumulative Gaussian function and the 50% correct response of the psychometric function was considered as the threshold visual acuity (correction for aforementioned guessing was ignored).Citation14 The slope of psychometric function was also determined as a measure of task precision.Citation14
The visual acuity task was performed on each subject under seven test conditions: (1) pre cycloplegia, (2) post-cycloplegia (considered herein as baseline) and post-cycloplegia with (3) induced pseudomyopia and temporal fluctuations of SNR-A, (4) only induced pseudomyopia of SNR-A, (5) with only induced temporal fluctuations in refraction of SNR-A about baseline emmetropia, (6) condition 5 with double the amplitude of induced temporal fluctuations, and (7) condition 5 with half the amplitude of induced temporal fluctuations.
Condition 1 was always performed as the first measurement and the testing order of the remaining conditions was randomised across subjects. Cycloplegia was achieved after 40 min of instilling 1% Cyclopentolate HCl eye drops in two ways. First, the subject was unable to read the N10 line of a near vision chart at 40 cm viewing distance, without the aid of +2.50D addition lenses. Second, they were able to the N10 line with the near-addition of +2.50D at 40 cm, but unable to do so for viewing distances closer than 40 cm. That the innate accommodative microfluctuations of the eye was eliminated after cycloplegia was also verified for every subject by monitoring the refraction profile of their cyclopleged, infrared filter occluded left eye during the experiment using a dynamic (50 Hz sampling rate), eccentric, infrared photorefractor (PowerRef 3®, Plusoptix GMBH, Nuremberg, Germany) ().Citation15,Citation16
The photorefractor was placed orthogonal to the eye and obtained images reflected off an infrared-light reflecting hot mirror (Holmarc opto-mechatronics Ltd., Kerala, India) aligned before the left eye at 45° angle (). Overall, the refractive power of the eye varied temporally in condition 1 owing to the accommodative microfluctuations of the subject while they varied temporally in conditions 3, 4, 6 and 7 owing to the induced pattern of refractive fluctuations. The refractive power remained stable over time in conditions 2 and 5. Cycloplegia also ensured that the pupils remained dilated throughout the study (7 mm) and did not unduly influence the visual acuity measurements reported in this study.Citation17,Citation18
A custom-designed motorised Badal optometer was used to generate the pattern of refractive fluctuations, using a paradigm similar to Winn et al. for determining the perceptual detectability of blur with physiological microfluctuations of accommodation.Citation19 The optometer was aligned such that the right eye of the subject, the optometer and the visual acuity test were all coaxial (). The optometer followed the design specifications outlined in Atchison et al.,Citation20,Citation21 with a Badal lens of +10.00D placed at 10 mm before the nodal point of the eye and a −20.00D auxiliary lens that could be moved towards and away from the Badal lens to generate refractive error between +5.00D of hyperopia to −10.00D of myopia for an emmetropic eye (). A 1 mm movement of the auxiliary lens towards the Badal lens generated a hyperopic refractive error of 0.10D while the same movement away from the Badal lens generated a myopic refractive error of 0.10D for this emmetropic eye, in accordance with geometric optics calculations.Citation20,Citation21
The auxiliary lens was motorised using ATMega-328 micro-controller (Arduino Uno, Arduino LLC) using custom-written software in Python® (Python software foundation, Wilmington, USA). Automation of movement was achieved by moving this assembly using a stepper motor, controlled using a compatible software driver (NEMA-17, SunRobotics, Ahmedabad, India). Motion of the auxiliary lens was achieved using a belt-operated system with a standard GT2 belt. Accuracy and precision of the induced refractive error was ensured using a gear and shaft mechanism, such than 53 steps of movement of the belt resulted in 1 cm (1D) of motion of the auxiliary lens.
The pattern of refractive fluctuations used in this study was obtained from the left eye of 15 patients of SNR-A (age range: 9–23 yrs) that participated in the previous study by Bharadwaj et al.Citation2 The data collection and analyses are described in detail in that study.Citation2 Briefly, continuous measurements of refractive power from both eyes of these subjects were obtained for 90 seconds duration using the Plusoptix photorefractor while they steadily fixated on a target at 2 m viewing distance.Citation2 The raw data were scaled for the photorefractor luminance calibration slope of Indian eyes and smoothed using a 100 ms running-average filter to remove noise.Citation2,Citation22 The refraction data was found to be well correlated between eyes and data from only the left eye of patients were used for the present study.Citation2
The refraction data of each subject was Fourier-transformed using custom-written algorithms in Matlab to derive the amplitude spectrum in the frequency domain.Citation2 The amplitude spectrum of each subject was then averaged and then inverse Fourier-transformed to recreate the refractive fluctuations in the time domain. These averaged refractive fluctuations were induced before each subject using the Badal optometer set-up through a custom-designed algorithm that converted the dioptre values into the equivalent steps per revolution.
The temporal sequence of blur was repeated in an infinite loop to ensure that the blur fluctuations persisted throughout the visual acuity testing period. The approach of averaging the refractive fluctuations data in the frequency domain, as opposed to averaging in the time domain, ensured that inter-subject phase differences in fluctuation did not adversely affect the outcomes of the averaging process. For conditions 1, 2 and 5, where refractive fluctuations were not induced, the Badal optometer was kept at 0.00D position, ensuring emmetropic refraction.
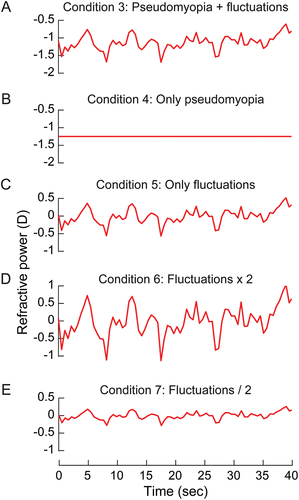
shows the pattern of refractive fluctuations used to induce blur in conditions 3–7 of the study. The temporal variations in blur happened about a mean refractive state of −1.20D and with a range from −0.80 to −1.75D. This blur pattern was used as is in Condition 3 (), with no temporal fluctuations but only the mean pseudomyopia of −1.20D in Condition 4 (), with the mean value reset to 0.00D but with the temporal fluctuations intact in Condition 5 (). Condition 5 was repeated with the blur fluctuations doubled and halved in amplitude in Conditions 6 and 7, respectively, both with the mean value of blur at 0.00D . In all experiments, the head of the subject was stabilised using a chin and forehead rest. All experimental sessions were completed on the same day in 90 minutes and, with sufficient breaks to minimise fatigue.
Figure 2. The mean pattern of refractive fluctuations plotted as a function of time for patients with SNR-A that participated in the study of Bharadwaj et al.Citation2 These fluctuations were induced before the right eye of healthy subjects in this study as is (panel A), with only pseudomyopic refraction (panel B), with only the temporal fluctuations in refractive power about baseline emmetropia (panel C), with only temporal fluctuations in refractive power but with double its amplitude (panel D) and half its amplitude (panel E).
Data entry was performed on Microsoft Excel version 16.0 (Microsoft Inc, Redmond, USA). All statistical analyses were performed with SPSS version 21® (IBM SPSS, Chicago, USA). Kolmogorov–Smirnov test indicated that the outcome variables (visual acuity and task precision) were normally distributed. Parametric one-factor repeated-measures ANOVA with Greenhouse-Geisser correction was used to determine the overall significance of results across the different testing conditions. Post-hoc Bonferroni test with appropriate Bonferroni correction for multiple comparisons was used for all pairwise comparisons. P ≤ 0.05 was considered statistically significant. Effect size was quantified using the partial Eta-squared (ηp2) value.Citation23
Results
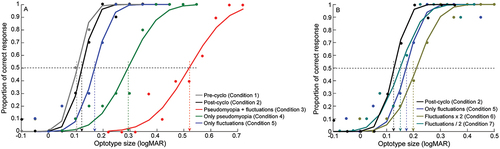
plots representative psychometric functions of percentage correct response against the optotype sizes in logMAR units for Conditions 2 to 7 of the study. The r2 values of the cumulative Gaussian function fit to the raw data were ≥0.8 in all conditions and subjects. The psychometric functions clearly showed varying magnitudes of rightward shift across Conditions 3–5, indicating a drop in visual acuity with induced pseudomyopia and/or temporally-varying blur, all relative to the baseline viewing (Condition 2) (). The lateral shift and the slope of the psychometric function was proportionally greater for Condition 3, relative to Conditions 4 and 5, reflecting greater loss of acuity and increased imprecision in performance with induced pseudomyopia and blur fluctuations, relative to other conditions (). The psychometric function showed a small rightward shift and shallower slope in Condition 6, relative to Conditions 5 and 7, indicating loss of visual acuity and task precision with doubling of temporal fluctuations, relative to native and halving the amplitudes ().
Figure 3. Psychometric functions of proportion of correct response plotted as a function of optotype size for conditions 1 to 5 (panel A) and conditions 5–7 (panel B) in this study from one representative subject. 50% correct response of the psychometric function was taken as an estimate of the visual acuity of the subject and the slope of the psychometric function was considered an estimate of task precision.
One-factor repeated measures ANOVA indicated significant impact of viewing condition on visual acuity [F(2.25,1) = 159.4, p < 0.001, ηp2 = 0.93)] and task precision [F(3.6,1) = 7.6, p < 0.001, ηp2 = 0.37)], albeit with the effect size being greater for the former than the latter outcome variable (, ). Detailed results of the multiple pairwise comparisons for both outcome variables are shown in . In general, visual acuity and task precision were worst with the combination of pseudomyopia and temporal fluctuations (Condition 3; mean ±1SEM visual acuity: 0.51 ± 0.02logMAR; task precision: 0.24 ± 0.03) followed by the only pseudomyopia condition (Condition 4; visual acuity: 0.27 ± 0.01logMAR; task precision: 0.15 ± 0.02), all relative to baseline (Condition 1; visual acuity: 0.12 ± 0.01logMAR; task precision: 0.09 ± 0.02; Condition 2; visual acuity: 0.13 ± 0.01logMAR; task precision: 0.11 ± 0.02) and the three temporal fluctuations conditions (Condition 5; visual acuity: 0.17 ± 0.01logMAR; task precision: 0.11 ± 0.03; Condition 6; visual acuity: 0.20 ± 0.01logMAR; task precision: 0.18 ± 0.02; Condition 7; visual acuity: 0.15 ± 0.01logMAR; task precision: 0.10 ± 0.03) (, ).
Figure 4. Mean (±1SEM) logMAR visual acuity (panel A) and task precision (panel B) of all subjects across the seven different viewing conditions employed in this study.
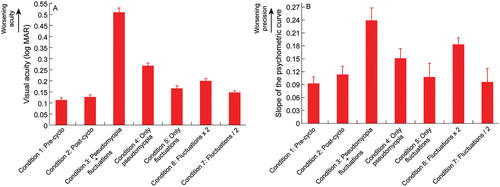
Table 1. Outcomes of the one-factor repeated measures ANOVA (RM-ANOVA) test performed to evaluate changes in visual acuity and task precision (i.e., slope of the psychometric function) in the present study. Post-hoc Bonferroni test with appropriate Bonferroni correction for multiple comparisons was used for all pairwise comparisons.
Amongst the three temporal fluctuations conditions, doubling the magnitude of fluctuations (Condition 6) worsened visual acuity and take precision relative to baseline and to the conditions with native magnitude (Condition 5) and halved magnitude of fluctuations (Condition 7) (, ).
Discussion
Unlike regular uncorrected refractive errors where the retinal image blur is more or less constant over time blur variations from accommodative microfluctuations are negligible and within the perceptual depth of focusCitation24,Citation25; see however, Winn et al.,Citation19 the large fluctuations of refraction in SNR-A renders the retinal image blur variable over time. This temporal variability in blur, coupled with the baseline manifest pseudomyopia, makes the viewing experience in SNR-A significantly more challenging than with regular uncorrected refractive errors.Citation3–5 Patients often report fluctuations in their vision as a part of their presenting history, clinicians find it challenging to neutralise the retinoscopy reflex during objective refraction and patients are unable to provide a consistent visual acuity response during subjective refraction owing to these fluctuations.Citation3–5 Expectedly, therefore, the visual acuity loss in SNR-A is rather unpredictable from the magnitude of manifest pseudomyopia and shows large inter- and intra-subject variability, all relative to controls.Citation5
The results of this study may explain the aforementioned and associated clinical observations in SNR-A.Citation5 First, the exaggerated acuity loss in SNR-A appears to arise from a combination of pseudomyopia and the fluctuations of refraction, as observed in this study (, ). Such fluctuations of refraction are minimal in regular myopia and contribute little to the loss of acuity.Citation1,Citation25 Management of SNR-A with modified optical fogging and vision therapy or with atropine eye drops reduce both pseudomyopia and refractive fluctuations, resulting in a commensurate improvement in visual acuity.Citation2,Citation5,Citation26 That the visual acuity loss was greater with induced pseudomyopia than with induced blur fluctuations about emmetropia (, ), suggests that the improvement in acuity of patients with SNR-A following the aforementioned management protocols is more from a reduction in the former than the latter.
Second, the increased variability in patient response during acuity testing in SNR-A is well reflected in the flattening of the psychometric function observed in this study in the combined pseudomyopia and blur fluctuations condition (, ). Patients with SNR-A may experience increased difficulty in veridically identifying optotypes in the presence of temporally fluctuating pseudomyopic blur, relative to when either factors are present alone (, ).
The pattern of refractive fluctuation induced in this study represented the average value obtained across the 15 patients with SNR-A that participated in a previous study from our laboratory.Citation2 The range of temporal fluctuation induced here [0.95D (−0.80 to −1.75D)] approximately matched that of four patients with SNR-A in the previous study.Citation2 Their visual acuities ranged from 0 to 1.0logMAR, with a mean value of 0.4logMAR units.Citation2 The mean visual acuity reported in this study for the pseudomyopia plus blur fluctuations condition (0.51 ± 0.07logMAR) approximately matched the aforementioned mean visual acuity of the patients with SNR-A, indicating that the induced blur paradigm employed here does produce acuity losses in the same range as what is experienced physiologically in patients with SNR-A.Citation2
The intersubject variability of results obtained from patients with SNR-A is larger than what was observed here, presumably due to the elusiveness in clinical endpoint of acuity testing alluded to earlier. It would be of interest to replicate the present study on patients with SNR-A to determine the relative impacts of pseudomyopia and blur fluctuations on their visual acuity. Such a study would involve dynamic measurement and in-sync correction of the refractive power of the eye during visual acuity testing. The technology required for such an experimental paradigm is being developed in the laboratory.Citation27
The visual acuity loss with temporal fluctuations of blur around emmetropia (Condition 5) being lower than the corresponding loss with only pseudomyopia (Condition 4) may simply be explained by the quantum of blur on the retina (). The range of temporal fluctuation in blur [0.95D (−0.80 to −1.75D)] was smaller than the pseudomyopic blur (1.12D), resulting in lesser loss of acuity in the former than the latter condition (). Additionally, the temporal fluctuations of blur happened about emmetropic refraction, raising the possibility of some optotype presentations during the psychophysical procedure may have appeared clear to the subject while the fluctuations transitioned through a zero-blur crossing from myopia to hyperopia or vice-versa ().
On the contrary, the pseudomyopic blur in Condition 4 was stable throughout the psychophysical procedure, devoiding the subject of this zero-blur crossing advantage (). When the temporal fluctuations in blur were combined with pseudomyopia, the quantum of blur dynamically varied throughout the psychophysical procedure ranging from −1.92D to −2.87D and the zero-blur crossing advantage is lost (the least blur on the retina would be −1.92D), thus rendering the acuity significantly poorer than with blur only from temporal fluctuations or pseudomyopia (). Indeed, the zero-blur crossing advantage may be a reason why some patients with mild SNR-A can still have normal visual acuity (close to 0logMAR), despite having significant pseudomyopia and blur fluctuations (see acuity of patients 4, 6 and 7 in of Bharadwaj et al).Citation2 This advantage progressively wanes with an increase in the severity of SNR-A.Citation2
Comparison of the acuity loss in Conditions 5–7 offer some insights into the impact of the amplitude of temporal blur fluctuations on visual acuity about emmetropic refraction. That the acuities in Condition 5 (native amplitude of fluctuations in SNR) and Condition 7 (half the amplitude of fluctuations that Condition 5) were not significantly different from baseline (Condition 1), indicates that the amplitude of these fluctuations may have to reach a certain threshold to have a negative impact on acuity (). The threshold for acuity loss perhaps lies between the native amplitude (Condition 5) and double its amplitude (Condition 6), given that the latter produced significant drop in acuity, compared to the former and baseline viewing ().
The lack of an acuity loss in Condition 7 is not surprising, given that the amplitude of fluctuations (0.95D of native fluctuations/2 = 0.48D) was rendered close to the depth of focus of the eye (0.5D).Citation21,Citation28 This magnitude is also approximately similar to the magnitude of physiological accommodative microfluctuations that may not interfere with visual acuity processing.Citation25
Overall, a more accurate description of all these results would require further insights into the phase relationship between the optotype presentation epoch and the temporal blur pattern and about human decision-making strategies in the presence of temporally varying blur. The former requires a detailed analysis of the experimental paradigm employed in this study while the latter requires experimentation of how acuity will drop with different amplitude and frequency combinations of blur. Studies are currently underway in our laboratory for further insights on these issues.Citation8
In summary, the disproportionate loss of visual acuity in SNR-A may arise from the combination of pseudomyopia and its temporal fluctuations. Between the two factors, pseudomyopia appears to have greater potency in disrupting visual acuity than the temporal fluctuations in blur. The latter, however, adds significant variability and elusiveness to visual acuity assessment in SNR-A, as reflected in the loss of task precision in this study.
Acknowledgements
The authors thank all the participants of this study.
Disclosure statement
No potential conflict of interest was reported by the author(s).
Additional information
Funding
References
- Bharadwaj SR, Ravisankar C, Roy S et al. Fluctuations of steady-state accommodation is a marker for screening spasm of near reflex. Transl Vis Sci Technol 2021; 10: 9.
- Bharadwaj SR, Roy S, Satgunam P. Spasm of near reflex: objective assessment of the near-triad. Invest Ophthalmol Vis Sci 2020; 61: 18.
- Goldstein JH, Schneekloth BB. Spasm of the near reflex: a spectrum of anomalies. Surv Ophthalmol 1996; 40: 269–278.
- Hyndman J. Spasm of the near reflex: literature review and proposed management strategy. J Binocul Vis Ocul Motil 2018; 68: 78–86.
- Roy S, Bharadwaj SR, Patil-Chhablani P et al. Spasm of near reflex: a comprehensive management protocol and treatment outcomes. J Aapos 2021; 25: 162e161.
- Lohman AW, Paris DP. Influence of longitudinal vibrations on image quality. Appl Opt 1965; 4: 393–398.
- Bartuzel MM, Robert Iskander D, Marin-Franch I et al. Defocus vibrations in optical systems-considerations in reference to the human eye. J Opt Soc Am A Opt Image Sci Vis 2019; 36: 464–470.
- Goswami S, Bharadwaj SR. Deterioration of visual acuity depends on the frequency and amplitude of time-varying optical defocus: British Congress of Optometry and Vision Science 2021 Abstracts. Ophthalmic Physiol Opt. 2022 Jan; 42 (1): 230–253.
- Iskander DR. Signal processing in visual optics. IEEE Signal Process Mag 2014; 31: 155–158.
- Nowicka H, Iskander DR. Potential of longitudinal vibrations in the human eye. In: Proceedings of the 7th European/1st World Meeting in Visual and Physiological Optics; 2014; Wroclaw, Poland.
- Maiello G, Walker L, Bex PJ et al. Blur perception throughout the visual field in myopia and emmetropia. J Vis 2017; 17: 3.
- Schmid KL, Robert Iskander D, Li RW et al. Blur detection thresholds in childhood myopia: single and dual target presentation. Vision Res 2002; 42: 239–247.
- Brainard DH. The psychophysics toolbox. Spat Vis 1997; 10: 433–436.
- Klein SA. Measuring, estimating, and understanding the psychometric function: a commentary. Percept Psychophys 2001; 63: 1421–1455.
- Campbell FW, Robson JG, Westheimer G. Fluctuations of accommodation under steady viewing conditions. J Physiol 1959; 145: 579–594.
- Johnson CA, Post RB, Tsuetaki TK. Short-term variability of the resting focus of accommodation. Ophthalmic Physiol Opt 1984; 4: 319–325.
- Atchison DA, Smith G, Efron N. The effect of pupil size on visual acuity in uncorrected and corrected myopia. Am J Optom Physiol Opt 1979; 56: 315–323.
- Campbell FW, Gregory AH. Effect of size of pupil on visual acuity. Nature 1960; 187: 1121–1123.
- Winn B, Charman WN, Pugh JR et al. Perceptual detectability of ocular accommodation microfluctuations. J Opt Soc Am A 1989; 6: 459–462.
- Atchison DA, Bradley A, Thibos LN et al. Useful variations of the Badal Optometer. Optom Vis Sci 1995; 72: 279–284.
- Atchison DA, Charman WN, Woods RL. Subjective depth-of-focus of the eye. Optom Vis Sci 1997; 74: 511–520.
- Sravani NG, Nilagiri VK, Bharadwaj SR. Photorefraction estimates of refractive power varies with the ethnic origin of human eyes. Sci Rep 2015; 5: 7976.
- Lakens D. Calculating and reporting effect sizes to facilitate cumulative science: a practical primer for t-tests and ANOVAs. Front Psychol 2013; 4: 863.
- Charman WN, Heron G. Fluctuations in accommodation: a review. Ophthalmic Physiol Opt 1988; 8: 153–164.
- Charman WN, Heron G. Microfluctuations in accommodation: an update on their characteristics and possible role. Ophthalmic Physiol Opt 2015; 35: 476–499.
- Satgunam P. Relieving accommodative Spasm: two case reports. Optom Vis Perf 2018; 6: 207–212.
- Bandela PK, Bharadwaj SR, Ho A et al. Real-time manipulation of blur-driven accommodation using an electrically-tunable lens: a feasibility study. Invest Ophthalmol Vis Sci 2021; 62: 2060.
- Burns DH, Allen PM, Edgar DF et al. A review of depth of focus in measurement of the amplitude of accommodation. Vision (Basel) 2018; 2: 37.